Heikin Ashi Volume

For those who love to trade using the Heikin Ashi Candlesticks, here it is one more powerful ally: Heikin Ashi Volume. This indicator is an exclusive idea and creation from us at Minions Labs for you.

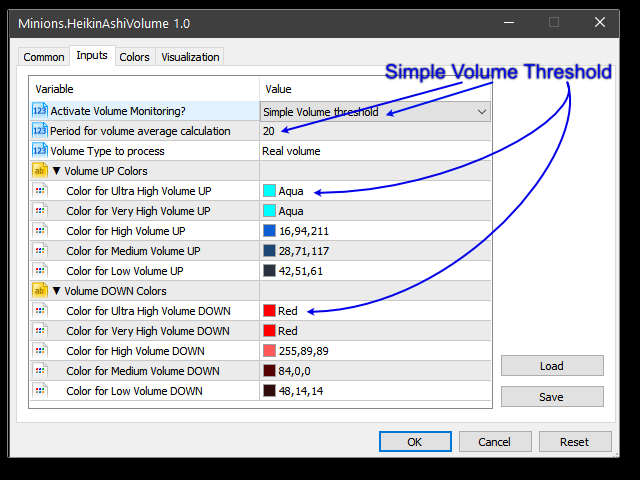
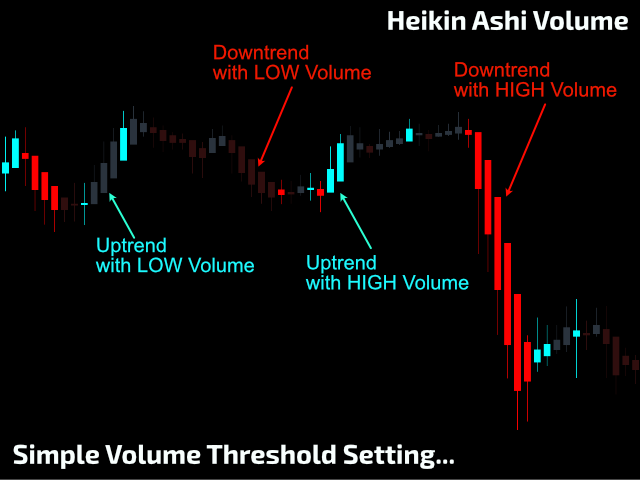
The idea behind this indicator is to have a visual cue over the Heiken Ashi candles pointing at those candles with big volume. For this to happen you can choose between 2 different techniques of identifying the "high" volume:

  1. Higher Volume above the last N previous bars average.
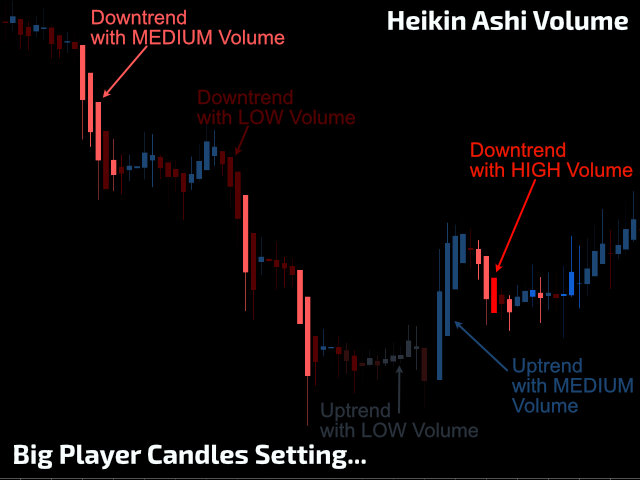
  2. Higher Volume segmented on "levels" (Ultra High, Very High, High, Medium and Low), which was brought from our award winning indicator called Big Player Candles.


SETTINGS

  • Type of Volume Monitoring to be applied over the candles.
  • Period for volume average calculations.
  • Colors for all the possibilities of Volume monitoring.

    BUFFERS TO USE ON YOUR EA

        #4 - Color buffer. Possible Values:
            1 = Uptrend Ultra-High Volume
            2 = Uptrend Very-High Volume
            3 = Uptrend High Volume
            4 = Uptrend Medium Volume
            5 = Uptrend Low Volume
            6 = Downtrend Ultra-High Volume
            7 = Downtrend Very-High Volume
            8 = Downtrend High Volume
            9 = Downtrend Medium Volume
            10 = Downtrend Low Volume


    Do you want to try it for yourself, live into your assets? Download the DEMO version here: Heikin Ashi Volume DEMO

    * Due to the new MQL5 policy developers cannot provide DEMO versions to the general public here in this website anymore.That is why you will be redirected to an external website clicking on the link above.

    * If you would like to try this indicator in a BackTest environment for Exper Advisor, please download the FREE DEMO version on the button found here on this product (left side of this screen).


    Didn't Find a Feature You Need?

    No product is perfect for everyone. If you think you need a missing feature from our product just send us a message. We love feedback!


    Рекомендуем также
    Smart FVG Stats
    - Md Rashidul Hasan
    5 (1)
    The  Smart FVG Statistics Indicator  is a powerful MetaTrader 5 tool designed to automatically identify, track, and analyze Fair Value Gaps (FVGs) on your charts. Love it? Hate it? Let me know in a review! Feature requests and ideas for new tools are highly appreciated. :) Try "The AUDCAD Trader": https://www.mql5.com/en/market/product/151841 Key Features Advanced  Fair Value Gap  Detection Automatic Identification : Automatically scans for both bullish and bearish FVGs across specified histo
    FREE
    VWAP Simple
    Deibson Carvalho
    4.24 (29)
    Средневзвешенная по объему цена аналогична скользящей средней, за исключением того, что объем включен для взвешивания средней цены за период. Средневзвешенная по объему цена [VWAP] - это динамическое средневзвешенное значение, предназначенное для более точного отражения истинной средней цены ценной бумаги за определенный период. Математически VWAP - это сумма денег (т. Е. Объем х цена), деленная на общий объем в любой временной интервал, обычно с рынка, открытого для рынка. VWAP отражает рын
    FREE
    Индикатор подчёркивает те моменты, которые профессиональный трейдер видит в обычных индикаторах. VisualVol визуально отображает разные показатели волатильности в единой шкале и общем масштабе. Подчёркивает цветом превышение показателей объёма. Одновременно могут быть отображены Тиковый и Реальный Объем, Действительный диапазон, ATR, размер свечи и ретурнс (разница open-close). Благодаря VisualVol вы увидите рыночные периоды и подходящее время для разных торговых операций. Эта версия предназначен
    FREE
    Value Chart Candlesticks
    Flavio Javier Jarabeck
    4.69 (13)
    The idea of a Value Chart indicator was presented in the very good book I read back in 2020 , " Dynamic Trading Indicators: Winning with Value Charts and Price Action Profile ", from the authors Mark Helweg and David Stendahl. The idea is simple and the result is pure genius: Present candlestick Price analysis in a detrended way! HOW TO READ THIS INDICATOR Look for Overbought and Oversold levels. Of course, you will need to test the settings a lot to find the "correct" one for your approach. It
    FREE
    Weis Waves
    Flavio Javier Jarabeck
    2.83 (18)
    The original author is David Weis, an expert in the Wyckoff Method. The Weis Wave is a modern adaptation of the 1930's Wyckoff Method, another expert in Tape Reading techniques and Chart Analysis. Weis Waves takes market volume and stacks it into waves according to price conditions giving the trader valuable insights about the market conditions. If you want to learn more about this subject you can find tons of videos in YouTube. Just look for "The Wickoff Method", "Weis Wave" and "Volume Spread
    FREE
    Bollinger Bands B
    Flavio Javier Jarabeck
    4.25 (4)
    John Bollinger created this indicator in 2010 as a way to read the original indicator (Bollinger Bands) in a more "technical" way, shown as an oscillator. The typical range of the Bollinger Bands %B is 0 - 0.5 - 1.0, where "0" represents the lower band, the "0.5" the middle band, and "1" the upper band. The line on the indicator represents the Closing prices. As simple as that. SETTINGS Bollinger Bands period of analysis Standard Deviation multiplier Shift Price type to be analyzed If you like
    FREE
    Follow The Line MT5
    Oliver Gideon Amofa Appiah
    4.6 (35)
    This indicator obeys the popular maxim that: "THE TREND IS YOUR FRIEND" It paints a GREEN line for BUY and also paints a RED line for SELL. (you can change the colors). It gives alarms and alerts of all kinds. IT DOES NOT REPAINT and can be used for all currency pairs and timeframes. Yes, as easy and simple as that. Even a newbie can use it to make great and reliable trades. NB: For best results, get my other premium indicators for more powerful and reliable signals. Get them here: https://www.m
    FREE
    Donchian Channel is an indicator created by Richard Donchian. It is formed by taking the highest high and the lowest low of the last specified period in candles. The area between high and low is the channel for the chosen period. Its configuration is simple. It is possible to have the average between the upper and lower lines, plus you have alerts when price hits one side. If you have any questions or find any bugs, please contact me. Enjoy!
    FREE
    Supports And Resistances Lines
    Francisco Gomes Da Silva
    4.65 (46)
    Индикатор зон поддержки и сопротивления MT5 этот индикатор умеет автоматически определять максимумы и минимумы. Этот индикатор поддержки и сопротивления создает линии поддержки и сопротивления на основе максимумов и минимумов. как построить линии поддержки и сопротивления. это индикатор для построения автоматических линий поддержки и сопротивления. как найти уровень поддержки с помощью индикатора. этот индикатор автоматически находит максимумы и минимумы. Индикатор автоматически создает линии по
    FREE
    Simple Vwap with the daily, weekly and monthly VWAP is the abbreviation for   volume-weighted average price , which is a technical analysis tool that shows the ratio of an asset's price to its total trade volume. It provides traders and investors with a measure of the average price at which a stock is traded over a given period of time. How it's used Identify entry and exit points:   Traders can use VWAP to determine when to buy or sell an asset.   Understand price trends :  Traders can use V
    FREE
    Общее описание Этот индикатор — усовершенствованная версия классического канала Дончия с добавлением практических функций для реальной торговли. Помимо стандартных трёх линий (верхняя, нижняя и средняя), система определяет пробои и отображает их на графике стрелками, показывая только линию, противоположную текущему направлению тренда для более чистого восприятия. Индикатор включает: Визуальные сигналы : цветные стрелки при пробое Автоматические уведомления : всплывающие окна, push и email Фильтр
    FREE
    Are you tired of drawing trendlines every time you're analyzing charts? Or perhaps you would like more consistency in your technical analysis. Then this is for you. This indicator will draw trend lines automatically when dropped on a chart. How it works Works similar to standard deviation channel found on mt4 and mt5. It has 2 parameters: 1. Starting Bar 2. Number of bars for calculation The   starting bar   is the bar which drawing of the trend lines will begin, while the   number of bars for c
    FREE
    Общее Описание Индикатор Fair Gap Value выявляет и подсвечивает «пробелы справедливой стоимости» на графике MetaTrader 5. Fair gap возникает, когда между минимумом одной свечи и максимумом другой свечи, разделённых одной промежуточной, образуется ценовой разрыв. Индикатор рисует цветные прямоугольники (бычьи и медвежьи), чтобы выделить эти зоны и обеспечить наглядную поддержку стратегий, основанных на ценовом действии. Ключевые Особенности Обнаружение бычьих gap : выделяет разрывы между минимумо
    FREE
    Friend of the Trend: Ваш Трекер Трендов Освойте рынок с помощью Friend of the Trend — индикатора, который упрощает анализ трендов и помогает определить лучшие моменты для покупки, продажи или ожидания. С интуитивно понятным и визуально привлекательным дизайном, Friend of the Trend анализирует движения цен и предоставляет четкие сигналы через цветной гистограмму: Зеленые полосы : Указывают на восходящий тренд, сигнализируя о возможностях для покупки. Красные полосы : Предупреждают о нисходящем тр
    FREE
    (Специальная акция к Новому Году - беЗплатное распространение!) Индикатор показывает реальный 'Масштаб по пунктам на бар' (идентично как при ручном выставлении в Терминале, см.скрин) в правом верхнем углу Графика. Изменение отображаемого значения происходит МГНОВЕННО при любом изменении масштаба высоты/ширины графика! (что очень удобно при планировании скриншотов). в Настройках: смена языка (Русский / Английский), размер шрифта отображаемого текста, коэфициент смещения текстовой метки от угла г
    FREE
    White Weis Volume Ticks
    Ricardo Almeida Branco
    5 (4)
    White Weis Volume This indicator shows the sum of the volume in each wave, bulish or bearish, as idealized by David Weis , but it brings an important addition , which is the marking of the bar with the highest volume of the wave (White Bar)! In coding the indicator, it was sought to optimize the code to require minimal processing during use and not to overload mt5. The indicator can be used for pre-trading analysis and study, where the trader analyzes possible points of support and resistance
    Donchian Pro
    Paulo Henrique Faquineli Garcia
    4.75 (4)
    The Donchian Channel Channels are among the most popular tools of technical analysis, as they visually convey to the analyst the limits within which most price movement tends to occur. Channel users know that valuable information can be obtained at any time, whether prices are in the central region of a band or close to one of the border lines. One of the best known techniques to explore these concepts is Bollinger Bands. However, John Bollinger was not the only one to research the application
    FREE
    PROMETHEUS TECHNICAN VERSION Free | By THE SONS A gift from The Sons — no strings, no trial, no expiry. Every trader deserves access to professional-grade market intelligence. That belief is why Prometheus Technical Version exists, and why it costs nothing. Consider it our handshake to the trading community. What You're Getting This is not a simplified tool dressed up as a gift. Prometheus Technican Version is a fully built, institutional-quality technical analysis indicator running a dual-model
    FREE
    MIDAS Super VWAP
    Flavio Javier Jarabeck
    4.27 (11)
    Imagine VWAP, MVWAP and MIDAS in one place... Well, you found it! Now you can track the movement of Big Players in various ways, as they in general pursue the benchmarks related to this measuring, gauging if they had good execution or poor execution on their orders. Traders and analysts use the VWAP to eliminate the noise that occurs throughout the day, so they can measure what prices buyers and sellers are really trading. VWAP gives traders insight into how a stock trades for that day and deter
    FREE
    Nem Nem
    Taha Saber Ashour Kamel
    Nem Nem is super accurate mt5 indicator it is working with any pair any time frame it will show and provide you with high Winrate signal you can use for forex pairs , gold and any other pairs it is easy to use also you can see the white lines for starting and end of signals it will help you to read the chart and enter and make correct decisions in trades. also it  will be clear for you when to enter and exit from any trades
    FREE
    VWAP Indicator, the short form of Volume Weighted Average Price, is similar to a moving average but takes into consideration the tick volume of the candles. The indicator calculates the moving average multiplying the price of each candle for the tick volume in the candle. Said calculation weighs with more significance price where more transactions were made. Features: Visual styling customizable Period customizable Ease of use
    FREE
    Free automatic Fibonacci is an indicator that automatically plots a Fibonacci retracement based on the number of bars you select on the BarsToScan setting in the indicator. The Fibonacci is automatically updated in real time as new highest and lowest values appears amongst the selected bars. You can select which level values to be displayed in the indicator settings. You can also select the color of the levels thus enabling the trader to be able to attach the indicator several times with differe
    FREE
    Simple QM Pattern   is a powerful and intuitive trading indicator designed to simplify the identification of the Quasimodo (QM) trading pattern. The QM pattern is widely recognized among traders for effectively signaling potential   reversals   by highlighting key market structures and price action formations. This indicator helps traders easily visualize the QM pattern directly on their charts, making it straightforward even for those who are new to pattern trading. Simple QM Pattern includes d
    FREE
    MACD Enhanced
    Nikita Berdnikov
    5 (3)
    Представляем   MACD  Enhanced  – усовершенствованный индикатор MACD (Moving Average Convergence Divergence), который предоставляет трейдерам расширенные возможности для анализа тренда и момента на финансовых рынках. Индикатор использует разницу между быстрой и медленной экспоненциальными скользящими средними для определения импульса, направления и силы тренда, создавая четкие визуальные сигналы для потенциальных точек входа и выхода. Внимание!   Для достижения наилучших результатов рекомендуется
    FREE
    Mae Pla Green Pen Analysis Framework The Mae Pla Green Pen Analysis Framework is a multi-timeframe price action scanner for XAUUSD (Gold Spot) . It monitors all 9 timeframes simultaneously — M1, M5, M15, M30, H1, H4, D1, W1, and MN — and displays pattern detection results on a real-time dashboard drawn directly on the chart. The indicator is based on the Mae Pla Green Pen trading methodology, which uses structured price action patterns to identify potential trade setups. Pattern Detection Three
    FREE
    VFI Quantum
    Nikita Berdnikov
    5 (1)
    Представляем VFI (Volume Flow Indicator) – индикатор для торговли, который анализирует соотношение объема и движения цены для выявления ключевых торговых возможностей. Индикатор отображает силу и направление потока объемов, предоставляя четкие сигналы о потенциальных точках входа и выхода. Сигналы формируются на основе пересечения нулевой линии, пересечения линии VFI и ее экспоненциальной скользящей средней (EMA), а также при выходе индикатора из зон перекупленности и перепроданности. Внимание!
    FREE
    Это инновационный индикатор измерения силы валют от INFINITY является незаменимым помощником для скальперов и трейдеров торгующих в долгую. Система анализа Силы/слабости валют давно известна и применяется на рынке ведущими трейдерами мира. Любая арбитражная торговля не обходится без этого анализа. Наш индикатор легко определяет силу базовых валют по отношению друг к другу. Он выводит линейные графики по всем или по текущей паре валют, позволяя проводить мгновенный анализ и поиск наиболее сильны
    FREE
    Indicator Description 4 Hull MA Color + Envelopes is a powerful trend-following indicator for MetaTrader 5 that combines four Hull Moving Averages (HMA) with Moving Average Envelopes to clearly identify market direction, trend strength, and potential reversal or pullback zones. This indicator is designed to reduce noise, react quickly to price movement, and provide a clean visual structure for professional trading.   Key Features   4 Hull Moving Averages (20, 50, 100, 200) Automatic color change
    FREE
    SMC Structure Markup
    Seyed Mohammad Hosseini Hejazi
    4.67 (15)
    Overview The Smart Money Structure Markup Indicator for MetaTrader 5 is a powerful tool designed to help traders identify key market structures based on popular Smart Money Concepts (SMC) strategies. This indicator detects micro-market structures, providing insights into price movements and potential trend changes. It highlights important elements such as valid Break of Structure (BOS), Change of Character (CHoCH), and Inducement (IDM), helping traders to make informed decisions. Key Features Ma
    FREE
    High Low Open Close
    Alexandre Borela
    4.98 (44)
    Если вам нравится этот проект, оставьте 5-звездочный обзор. Данный показатель рисует открытые, высокие, низкие и закрывающие цены на указанные период и его можно отрегулировать для специфического часового пояса. Это важные уровни, которые выглядят многие институциональные и профессиональные трейдеры и могут быть полезны для вас, чтобы знать места, где они могут быть больше активный. Доступные периоды: Предыдущий день. Предыдущая неделя. Предыдущий месяц. Предыдущий квартал. Предыдущий год. Или
    FREE
    С этим продуктом покупают
    ARIBot is a powerful trading companion designed to generate high-probability entry signals with dynamic TP/SL/DP levels based on volatility. Built-in performance tracking shows win/loss stats, PP1/PP2 hits, and success rates — all updated live. Key Features: Buy/Sell signals with adaptive volatility bands Real-time TP/SL/DP levels based on ATR Built-in MA Filter with optional ATR/StdDev volatility Performance stats panel (Success, Profit/Loss, PP1/PP2) Alerts via popup, sound, push, or email Cus
    SuperScalp Pro
    Van Minh Nguyen
    4.57 (21)
    SuperScalp Pro – Продвинутая скальпинговая индикаторная система с множественными фильтрами SuperScalp Pro — это продвинутый скальпинговый индикатор, который сочетает классический Supertrend с несколькими интеллектуальными фильтрами подтверждения для поиска торговых возможностей. Он эффективно работает на различных таймфреймах от M1 до H4, с оптимизированной производительностью на XAUUSD, BTCUSD и основных валютных парах Forex. Индикатор предоставляет четкие сигналы Buy и Sell, а также автоматиче
    Entry In The Zone and SMC Multi Timeframe is a real-time 2-in-1 market analysis tool that combines market structure analysis and a No Repaint BUY / SELL signal system into a single indicator, built on Smart Money Concepts (SMC) — a widely adopted framework used by professional traders to understand market structure. This indicator helps you see the market more clearly, make decisions based on structure rather than guesswork, and focus on high-probability zones where price is more likely to react
    Каждый покупатель этого индикатора получает дополнительно Бесплатно: Авторскую утилиту "Bomber Utility", которая автоматически сопровождает каждю торговую операцию, устанавливает уровни Стоп Лосс и Тейк профит и закрывает сделки согласно правилам этой стратегии, Сет-файлы для настройки этого индикатора на различных активах, Сет-файлы для настройки Bomber Utility в режимы: "Минимум Риска", "Взвешенный Риск" и "Стратегия Выжидания", Пошаговый видео-мануал, который поможет вам быстро установить, на
    Power Candles V3 - Первый самооптимизирующийся индикатор силы Power Candles V3 превращает анализ силы рынка в полностью готовую торговую систему. Индикатор не просто окрашивает график по силе рынка - в фоне работает живая авто-оптимизация, которая выдаёт лучший Stop Loss, Take Profit и порог сигнала для вашего символа. Один клик - и эта настройка принята для живой торговли. Этот инструмент входит в экосистему Stein Investments.  Изучите все 18 инструментов, получите рекомендации по сетапам с по
    Представляю Вам отличный технический индикатор GRABBER, который работает, как готовая торговая стратегия "Все включено"! В одном программном коде интегрированы мощные инструменты для технического анализа рынка, торговые сигналы (стрелки), функции алертов и Push уведомлений.  Каждый покупатель этого индикатора получает дополнительно БЕСПЛАТНО:  Grabber Утилиту для автоматического управления открытыми ордерами, Пошаговый видео-мануал : как установить, настроить и торговать, Авторские сет-файлы дл
    SignalTech MT5 is a trading system for EURUSD, USDCHF, USDJPY, AUDUSD, NZDUSD, EURJPY, AUDJPY, NZDJPY, CADJPY H2 and H3 Timeframe.  It can generate signals with Buy/Sell Arrows and Pop-Up/Sound Alerts. Each signal has clear Entry and Stop Loss levels, which should be automatically flagged on the chart, as well as potential Targets 1, 2, and 3. The Entry and TP levels are fixed after the trade is taken. The exit level is dynamic. If there are signs of a potential short-term trend reversal, the
    Если вы покупаете этот индикатор, вы получите мой профессиональный Trade Manager + EA БЕСПЛАТНО. Прежде всего стоит подчеркнуть, что эта торговая система является индикатором без перерисовки, без повторной отрисовки и без задержки, что делает ее идеальной как для ручной, так и для роботизированной торговли. Онлайн курс, руководство и загрузка пресетов. «Smart Trend Trading System MT5» - это комплексное торговое решение, созданное для новичков и опытных трейдеров. Он объединяет более 10 премиаль
    Gann Made Easy   - это профессиональная, но при этом очень простая в применении Форекс система, основанная на лучших принципах торговли по методам господина У.Д. Ганна. Индикатор дает точные BUY/SELL сигналы, включающие в себя уровни Stop Loss и Take Profit. ПОЖАЛУЙСТА, СВЯЖИТЕСЬ СО МНОЙ ПОСЛЕ ПОКУПКИ, ЧТОБЫ ПОЛУЧИТЬ ТОРГОВЫЕ ИНСТРУКЦИИ И ОТЛИЧНЫЕ ДОПОЛНИТЕЛЬНЫЕ ИНДИКАТОРЫ БЕСПЛАТНО! Вероятно вы уже не раз слышали о торговли по методам Ганна. Как правило теория Ганна отпугивает от себя не только
    Btmm state engine pro
    Garry James Goodchild
    5 (4)
    BTMM State Engine Pro is a MetaTrader 5 indicator for traders who use the Beat The Market Maker approach: Asian session context, kill zone timing, level progression, peak formation detection, and a multi-pair scanner from a single chart. It combines cycle state logic with a built-in scanner dashboard so you do not need the same tool on many charts at once. What it does Draws the Asian session range; session times can follow broker server offset or be set in inputs. Tracks level progression (L
    FX Trend NG: Следующее поколение интеллектуального анализа трендов на разных рынках Обзор FX Trend NG — это профессиональный инструмент анализа трендов и мониторинга рынка с поддержкой нескольких таймфреймов. Он позволяет за секунды получить полное структурное понимание текущего состояния рынка. Вместо переключения между десятками графиков вы мгновенно видите, какие инструменты находятся в тренде, где импульс ослабевает и где наблюдается сильная синхронизация между таймфреймами. Специальное пр
    Представляем       Quantum Breakout PRO   , новаторский индикатор MQL5, который меняет ваш способ торговли в зонах прорыва! Разработан командой опытных трейдеров со стажем торговли более 13 лет,       Квантовый прорыв PRO       разработан, чтобы поднять ваше торговое путешествие к новым высотам с его инновационной и динамичной стратегией зоны прорыва. Quantum Breakout Indicator покажет вам сигнальные стрелки на зонах прорыва с 5 целевыми зонами прибыли и предложением стоп-лосса на основе поля
    Quantum TrendPulse
    Bogdan Ion Puscasu
    5 (23)
    Представляем   Quantum TrendPulse   , совершенный торговый инструмент, который объединяет мощь   SuperTrend   ,   RSI   и   Stochastic   в один комплексный индикатор, чтобы максимизировать ваш торговый потенциал. Разработанный для трейдеров, которые ищут точность и эффективность, этот индикатор помогает вам уверенно определять рыночные тренды, сдвиги импульса и оптимальные точки входа и выхода. Основные характеристики: Интеграция SuperTrend:   легко следуйте преобладающим рыночным тенденциям и п
    Топовый индикатор МТ5, дающий сигналы для входа в сделки без перерисовки! Идеальные точки входа в сделки для  валют, крипты, металлов, акций, индексов !  Смотрите  видео  (6:22) с примером отработки всего одного сигнала, окупившего индикатор. Версия индикатора для MT4 Преимущества индикатора Сигналы на вход без перерисовки Если сигнал появился, он никуда НЕ исчезает! В отличие от индикаторов с перерисовкой, которые ведут к потере депозита, потому что могут показать сигнал, а потом убрать его. Б
    Прежде всего стоит подчеркнуть, что этот торговый индикатор не перерисовывается, не перерисовывает и не отставает, что делает его идеальным как для ручной, так и для роботизированной торговли. Руководство пользователя: настройки, вводы и стратегия. Атомный аналитик - это индикатор ценового действия PA, который использует силу и импульс цены, чтобы найти лучший край на рынке. Оборудованный расширенными фильтрами, которые помогают убирать шумы и ложные сигналы, и повышают торговый потенциал. Испо
    Раскройте силу торговли трендами с помощью индикатора Trend Screener: вашего идеального решения для торговли трендами, основанного на нечеткой логике и мультивалютной системе! Повысьте уровень своей торговли по тренду с помощью Trend Screener, революционного индикатора тренда, основанного на нечеткой логике. Это мощный индикатор отслеживания тренда, который сочетает в себе более 13 инструментов и функций премиум-класса и 3 торговые стратегии, что делает его универсальным выбором для превращения
    OmniSync Projection
    Antonio-alin Teculescu
    5 (1)
    Chronos Fractal Engine is an innovative price projection indicator for MetaTrader 5, designed to transform your technical analysis by intelligently identifying and projecting historical price patterns. Built upon an advanced correlation algorithm and the fractal principles of the market, this powerful tool visualizes potential future price movements, giving you a unique edge in your trading decisions. What is Chronos Fractal Engine? At its core, the Chronos Fractal Engine employs a sophisticat
    Эта панель показывает последние доступные   гармонические паттерны   для выбранных символов, так что вы сэкономите время и будете более эффективны /   MT4 версия . Бесплатный индикатор:   Basic Harmonic Pattern Колонки индикатора Symbol:   отображаются выбранные символы Trend   :   бычий или медвежий Pattern   :   тип паттерна (Гартли, бабочка, летучая мышь, краб, акула, шифр или ABCD) Entry   :   цена входа SL:   цена стоп-лосса TP1:   цена первого тейк-профита TP2:   цена второго тейк-профи
    Azimuth Pro
    Ottaviano De Cicco
    5 (7)
    Azimuth Pro V2: Синтетический фрактальный структурный анализ и подтверждённые входы для MT5 Обзор Azimuth Pro — многоуровневый индикатор свинговой структуры от Merkava Labs . Четыре вложенных уровня свингов, привязанный к свингам VWAP, определение ABC-паттернов, трёхтаймфреймная структурная фильтрация и подтверждённые входы на закрытой свече — один график, один рабочий процесс от микро-свингов до макро-циклов. Это не слепой сигнальный продукт. Это рабочий процесс, основанный на структуре, для т
    FX Levels: Исключительно точные уровни поддержки и сопротивления для всех рынков Краткий обзор Ищете надежный способ определить уровни поддержки и сопротивления для любых инструментов—валют, индексов, акций или сырьевых товаров? FX Levels сочетает традиционный «Lighthouse» метод с современным динамическим подходом, обеспечивая почти универсальную точность. Благодаря сочетанию опыта реальных брокеров и автоматических ежедневных плюс «в реальном времени» обновлений, FX Levels поможет вам выявлят
    Прежде всего стоит подчеркнуть, что этот Торговый Инструмент является Неперерисовывающимся Нерепейнтинговым Индикатором, что делает его идеальным для профессиональной торговли. Онлайн-курс, руководство пользователя и демонстрация. Индикатор Концепций Умного Действия Цены - очень мощный инструмент как для новичков, так и для опытных трейдеров. Он объединяет более 20 полезных индикаторов в одном, комбинируя передовые торговые идеи, такие как анализ Inner Circle Trader и стратегии торговли концеп
    RelicusRoad Pro: Квантовая Рыночная Операционная Система СКИДКА 70% ПОЖИЗНЕННЫЙ ДОСТУП (ОГРАНИЧЕНО) - ПРИСОЕДИНЯЙТЕСЬ К 2000+ ТРЕЙДЕРАМ Почему большинство трейдеров теряют деньги даже с «идеальными» индикаторами? Потому что они торгуют Единичными Концепциями в вакууме. Сигнал без контекста — это лотерея. Чтобы выигрывать стабильно, вам нужна КОНФЛЮЭНЦИЯ . RelicusRoad Pro — это не простой стрелочный индикатор. Это полная Количественная Рыночная Экосистема . Она отображает «Дорогу Справедливой Сто
    Индикатор Trend Ai - отличный инструмент, который улучшит анализ рынка трейдером, сочетая идентификацию тренда с точками входа и предупреждениями о развороте. Этот индикатор позволяет пользователям уверенно и точно ориентироваться в сложностях рынка Форекс Помимо первичных сигналов, индикатор Trend Ai определяет вторичные точки входа, возникающие во время откатов или коррекций, позволяя трейдерам извлекать выгоду из коррекции цены в рамках установленного тренда. Важные преимущества: · Работае
    Давайте сначала будем честны. Ни один индикатор сам по себе не сделает вас прибыльным. Если кто-то говорит вам обратное — он продаёт вам мечту. Любой индикатор, который показывает идеальные стрелки покупки/продажи, можно сделать безупречным — просто увеличьте нужный участок истории и сделайте скриншот успешных сделок. Мы так делать не будем. SMC Intraday Formula — это инструмент. Он считывает структуру рынка за вас, определяет зоны с наивысшей вероятностью движения цены и точно показывает, как
    Crystal Heikin Ashi Signals - Professional Trend & Signal Detection Indicator Advanced Heikin Ashi Visualization with Intelligent Signal System for Manual & Automated Trading Final Price: $149 ---------> Price goes up $10 after every 10 sales . Limited slots available — act fast . Overview Crystal Heikin Ashi Signals is a professional-grade MetaTrader 5 indicator that combines pure Heikin Ashi candle visualization with an advanced momentum-shift detection system. Designed for both manual traders
    ARICoin is a powerful trading companion designed to generate high-probability entry signals with dynamic TP/SL/DP levels based on volatility. Built-in performance tracking shows win/loss stats, PP1/PP2 hits, and success rates all updated live. Key Features: Buy/Sell signals with adaptive volatility bands Real-time TP/SL/DP levels based on ATR Built-in MA Filter with optional ATR/StdDev volatility Performance stats panel (Success, Profit/Loss, PP1/PP2) Alerts via popup, sound, push, or email Cust
    Market Structure Order Block Dashboard MT5 — это индикатор MT5, разработанный для трейдеров, которые хотят читать рыночную структуру и основные зоны реакции цены прямо на графике. Он объединяет BOS, ChoCH, Order Blocks, Fair Value Gaps (FVG), Ликвидность, Kill Zones, Volume Profile и компактную панель для быстрого анализа. Индикатор предназначен для трейдеров, использующих рыночную структуру, концепции ICT и Smart Money как основу для принятия решений. Он помогает выявлять продолжения тренда, во
    Smart Stop Indicator – Интеллектуальная точность стоп лоссов прямо на графике Обзор Smart Stop Indicator это специализированное решение для трейдеров, которые хотят устанавливать стоп лоссы чётко и методично, а не на интуитивной основе. Индикатор объединяет классическую логику прайс экшн (higher highs, lower lows) с современной системой распознавания пробоев, чтобы определить действительно логичный уровень стопа. В трендах, диапазонах или фазах резких движений он показывает оптимальные зоны SL
    Meridian Pro
    Ottaviano De Cicco
    5 (1)
    Meridian Pro: Профессиональная мульти-таймфрейм матрица трендов для MT5 Обзор Meridian Pro — это мульти-таймфрейм матрица трендов от Merkava Labs , которая сжимает направление, силу, состояние импульса и согласованность матрицы в одну компактную панель. Один адаптивный движок, последовательно применяемый от M1 до W1. Без настройки под отдельные символы. Без нагромождения индикаторов. Одна структурированная оценка по всем активам и всем таймфреймам. Акция запуска — получите Meridian Pro за USD 99
    Bill Williams Advanced предназначен для автоматического анализа графика по системе " Profitunity " Билла Уильямса. Индикатор анализирует сразу четыре таймфрейма. Инструкция/Мануал ( Обязательно читайте перед приобретением ) Преимущества 1. Анализирует график по системе "Profitunity" Билла Уильямса. Сигналы помещает в таблицу в углу экрана и на график цены. 2. Находит все известные сигналы АО и АС, а также сигналы зон. Оснащён трендовым фильтром по Аллигатору. 3. Находит "Дивергентный бар", а та
    Другие продукты этого автора
    Mini POC
    Flavio Javier Jarabeck
    4.93 (29)
    For those who struggle with overbloated Volume Profile/Market Profile indicators, here is a solution that contains only the Point of Control (POC) information. Super-fast and reliable, the Mini POC indicator presents this vital information visually within your chart. Totally customizable in splittable timeframes, type of Volume, calculation method, and how many days back you need. SETTINGS Timeframe to split the POCs within the day. Volume type to use: Ticks or Real Volume. Calculation method .
    FREE
    Auto Support and Resistances
    Flavio Javier Jarabeck
    4.57 (70)
    Are you tired of drawing Support & Resistance levels for your Quotes? Are you learning how to spot Support & Resistances? No matter what is your case, Auto Support & Resistances will draw those levels for you! AND, it can draw them from other timeframes, right into you current chart, no matter what timeframe you are using... You can also Agglutinate regions/zones that are too much closer to each other and turning them into one single Support & Resistance Level. All configurable. SETTINGS Timefr
    FREE
    Inside Bar Radar
    Flavio Javier Jarabeck
    4.67 (6)
    The Inside Bar pattern is a very well known candlestick formation used widely by traders all over the world and in any marketplace. This approach is very simple and adds a little confirmation candle, so it adds a third past candlestick to the count to confirm the direction of the move (upward or downward). Obviously, there is no power on this candlestick formation if the trader has no context on what it is happening on the market he/she is operating, so this is not magic, this "radar" is only a
    FREE
    Tabajara V5
    Flavio Javier Jarabeck
    4.83 (36)
    Metatrader 5 version of the famous Andre Machado's Tabajara indicator. If you don't know Andre Machado's Technical Analysis work you don't need this indicator... For those who need it and for those several friend traders who asked this porting from other platforms, here it is... FEATURES 8-period Moving Average 20-period Moving Average 50-period Moving Average 200-period Moving Average Colored candles according to the inflexion of the 20-period MA SETTINGS You can change the Period of all MA's
    FREE
    Closing Price Reversal
    Flavio Javier Jarabeck
    5 (11)
    Closing Price Reversal is a very well known and traded candlestick pattern. This little indicator paints with specific (user-selected) colors the Closing Price Reveral Up and Down patterns, as well as the Inside Bars (as a bonus). Higher timeframes are more effective  as with all other candlesticks patterns. Do NOT trade solely on this indicator. Search the web for "Closing Price Reversal" to learn about the several approaches that can be used with this pattern. One of them is combining short/me
    FREE
    Weis Waves
    Flavio Javier Jarabeck
    2.83 (18)
    The original author is David Weis, an expert in the Wyckoff Method. The Weis Wave is a modern adaptation of the 1930's Wyckoff Method, another expert in Tape Reading techniques and Chart Analysis. Weis Waves takes market volume and stacks it into waves according to price conditions giving the trader valuable insights about the market conditions. If you want to learn more about this subject you can find tons of videos in YouTube. Just look for "The Wickoff Method", "Weis Wave" and "Volume Spread
    FREE
    Aggression Volume
    Flavio Javier Jarabeck
    4.29 (17)
    Aggression Volume Indicator is the kind of indicator that is rarely found in the MQL5 community because it is not based on the standard Volume data provided by the Metatrader 5 platform. It requires the scrutiny of all traffic Ticks requested on the platform... That said, Aggression Volume indicator requests all Tick Data from your Broker and processes it to build a very special version of a Volume Indicator, where Buyers and Sellers aggressions are plotted in a form of Histogram. Additionally,
    FREE
    Economic Markers
    Flavio Javier Jarabeck
    4.79 (14)
    Easily get all relevant economic events of the current day right into your chart, as markers. Filter what kind of markers do you want: by country (selected individually) and by Importance (High relevance, Medium, Low or any combination of these). Configure the visual cues to your liking. If there is more than one event set to the very same time, their Names will be stacked and you will see the messages merged with the plus (+) sign on the marker. Obviously that long or too much events on the sam
    FREE
    Symbol Watermark
    Flavio Javier Jarabeck
    4.57 (14)
    Another request from my brotherhood was putting the name of the Symbol being seen - a little bigger - on the Chart, just to get sure that they are seeing the correct one... Mistakes pay a high price on the market... It is a very effective, and almost resource-null-consuming indicator that displays the current Symbol Name and Timeframe in almost any position of your Chart, with any color, and any Font Size... And also you can change the divisor character that is presented between the Symbol Name
    FREE
    Big Player Candles
    Flavio Javier Jarabeck
    4.91 (23)
    If you heard about The Wyckoff Method, Volume Spread Analysis, etc... You are probably searching for the candlestick indicator that shows you the Volume spread all over the current bar, signaling every types of market status... You can control the several Market Levels with custom colors... It is up to you to decide how to use it. Our job is provide you with the indicator... If you like this indicator, all I am asking is a little Review (not a Comment, but a REVIEW! )...    This will mean A LO
    FREE
    VWAP and MVWAP
    Flavio Javier Jarabeck
    3.88 (8)
    Volume Weighted Average Price (VWAP) is a trading benchmark commonly used by Big Players that gives the average price a Symbol has traded throughout the day. It is based on both Volume and price. Additionally we put in this indicator the MVWAP (Moving Volume Weighted Average Price). For those who do not know the usage and the importance od this indicator I recommend a great article about this subject at Investopedia ( https://www.investopedia.com/articles/trading/11/trading-with-vwap-mvwap.asp )
    FREE
    Market Momentum
    Flavio Javier Jarabeck
    4.43 (7)
    The Market Momentum indicator is based on the Volume Zone Oscillator (VZO), presented by Waleed Aly Khalil in the 2009 edition of the International Federation of Technical Analysts journal, and presents a fresh view of this market valuable data that is oftenly misunderstood and neglected: VOLUME. With this new approach of "seeing" Volume data, traders can infer more properly market behavior and increase their odds in a winning trade. "The VZO is a leading volume oscillator; its basic usefulness
    FREE
    MIDAS Super VWAP
    Flavio Javier Jarabeck
    4.27 (11)
    Imagine VWAP, MVWAP and MIDAS in one place... Well, you found it! Now you can track the movement of Big Players in various ways, as they in general pursue the benchmarks related to this measuring, gauging if they had good execution or poor execution on their orders. Traders and analysts use the VWAP to eliminate the noise that occurs throughout the day, so they can measure what prices buyers and sellers are really trading. VWAP gives traders insight into how a stock trades for that day and deter
    FREE
    Server Clock
    Flavio Javier Jarabeck
    5 (5)
    Many friends asked me for a simple, non-obtrusive, resource-friendly clock to track the time during their trades. It seems pretty obvious, but it is a must-have for those trading the market manually, waiting for the Market News, or just to visually know what time it is... Trading is an absorbing endeavor! So, here it is... Totally configurable, including Font Type, Font Size and Chart Location: Upper Left/Center/Right OR Lower Left/Center/Right, with a little twist of adjusting the Offset, just
    FREE
    Force Numbers
    Flavio Javier Jarabeck
    5 (1)
    Several assets in several markets have the behavior of using specific numbers as Force Numbers, where support, resistance and price thrust is created. Let this indicator draw those levels of support and resistance for you. You can also stack it to show different level of Prices! This technique is being used by Tape Readers and Order Flow traders all over the world for a long time. Give it a try. Challenge yourself to study new ways of Price Action! SETTINGS What Price reference to use in the c
    FREE
    The traditional Money Flow Index indicator, this time, EA friendly . There are 3 buffers exposed that can be used by EAs to automatically analyze the Overbought and Oversold conditions of the quote. Just use the traditional iCustom() function to get these signals. This Money Flow Index calculation is based on the traditional Metaquote's MFI indicator. SETTINGS MFI Period Volume type to analyze (Real Volume or Ticks) Starting Overbought region Starting Oversold region USING WITH EAs Buffer #0: 
    FREE
    Stackable VWAP
    Flavio Javier Jarabeck
    3.5 (4)
    Volume Weighted Average Price (VWAP) is a trading benchmark commonly used by Big Players that gives the average price a Symbol has traded throughout the day. It is based on both Volume and price. Additionally we put in this indicator the MVWAP (Moving Volume Weighted Average Price). For those who do not know the usage and the importance od this indicator I recommend a great article about this subject at Investopedia ( https://www.investopedia.com/articles/trading/11/trading-with-vwap-mvwap.asp
    FREE
    Waves Sizer
    Flavio Javier Jarabeck
    3.86 (7)
    Wyckoff fans, enjoy! Ideally to be used with the Weis Waves indicator, but it can be easily used alone, the Waves Sizer puts the range (in resulting Price movement) done by the Price on its market swings. You can control how accurate or loose will be the swings. This tool is very helpful for visually know how much the Price has traveled in your Timeframe. This way you can confront this level of effort with the resulting Volume, etc... Weis Waves indicator: https://www.mql5.com/en/market/produc
    FREE
    Price Momentum
    Flavio Javier Jarabeck
    4.92 (12)
    Value Chart indicator presents the Price evolution in a new form. This indicator, Price Momentum , was developed taking all the calculations presented in the book " Dynamic Trading Indicators " by Mark W. Helweg and David Stendahl (2002). The technique involves de-trended Prices from a user-defined Period of analysis and the addition of a Volatility index correction. The result is an Oscillator with 3 zones: Fair Price Value, Overbought/Oversold and Extremely Overbought/Oversold zones. Adding th
    FREE
    The concept is simple: Plotting Price behavior within several periods of time. Some Symbols behave very well during the trading day - with this I mean Intraday trading - and this behavior ends up plotting effectively well with the proposed Exponential Moving Averages in this indicator... Obviously that this behavior could not be seen in all Symbols, but you can give it a try... Just drop this indicator in a chart and you will see for yourself... This indicator is intended for "Feeling the Trend"
    FREE
    Flux Diffuser
    Flavio Javier Jarabeck
    4.33 (6)
    Based on Brazilian trader André Moraes' Difusor de Fluxo theory, the indicator is a more reliable version of the original MACD. It is a great confirmation indicator for Swing Trading and also can be used as a Day Trading tool. If you are not familiar with the concept or André's trading strategies, I strongly recommend his excelent book named "Se Afastando da Manada" in which he explains in detail how this indicator is used. Even if you don't know the Portuguese language it is not difficult to un
    FREE
    ATR Monitor
    Flavio Javier Jarabeck
    4.8 (5)
    ATR is a measure of volatility introduced by market technician J. Welles Wilder Jr. in his book, "New Concepts in Technical Trading Systems". In general, traders are accustomed to seeing the ATR in the form of a sub-window indicator. What I am presenting here is a simplified version of ATR - just the current ATR number - very useful for monitoring just the very moment of the current chart. If you want to monitor several timeframes in the same chart, just add the ATR Monitor indicator several tim
    FREE
    Price Trail Chart
    Flavio Javier Jarabeck
    5 (2)
    For those who hate candlesticks in lower timeframes (M1 through M15) we "invented" a clean new way to follow Price movement and displacement (volatility) called Price Trail Chart . The big "secret" is to get rid of those annoying candle wicks and draw the whole complete candle without them, this way we get a cleaner chart and a new view of the Price Path. No Open or Close markings, just LOW's and HIGH's, full body candle. Additionaly we inserted a Volume monitor from our Best Downloaded indicato
    FREE
    Candle Zones
    Flavio Javier Jarabeck
    You probably heard about Candlesticks behaviors, which in most of the times could denote and trace Volume behaviors even if you are not watching Volume itself... Well, this indicator will do this. Naked traders love to rely solely on candlesticks patterns and with Candle Zones you can trap special patterns and DRAW THEM on your chart. As simple as that. There are several filters you can tweak in order to achieve the analysis you want. Just give it a try. After several months of testing, we think
    FREE
    ATR Monitor ATR is a measure of volatility introduced by market technician J. Welles Wilder Jr. in his book, "New Concepts in Technical Trading Systems". In general, traders are accustomed to seeing the ATR in the form of a sub-window indicator. What I am presenting here is a simplified version of ATR - just the current ATR number - very useful for monitoring just the very moment of the current chart. And, by default, this indicator will not show up on screen, you can just use the buffers thems
    FREE
    Arrows Cleaner
    Flavio Javier Jarabeck
    5 (4)
    For those who use the Trading Arrows on the chart for later study, but use the Triple Screen approach and got all those arrows everywhere on all additional charts, here it is: Arrows Cleaner! Just drop it on the chart and leave it there. When needed, just with 1-click you get rid of all those annoying arrows... SETTINGS You can position the little Button on any corner of the chart. Additionally you can displace it with the Offset settings. You can enlarge or shrink its size, as well as the text
    FREE
    Minions Labs' Candlestick Pattern Teller It shows on your chart the names of the famous Candlesticks Patterns formations as soon as they are created and confirmed. No repainting. That way beginners and also professional traders who have difficulties in visually identifying candlestick patterns will have their analysis in a much easier format. Did you know that in general there are 3 types of individuals: Visual, Auditory, and Kinesthetic? Don't be ashamed if you cannot easily recognize Candlesti
    Economic Markers PRO
    Flavio Javier Jarabeck
    4 (1)
    Easily get all relevant economic events of the current day right into your chart, as markers. Filter what kind of markers do you want: by country (selected individually) and by Importance (High relevance, Medium, Low or any combination of these). Configure the visual cues to your liking. Additionaly you have the ability to add up to 5 personal markers of your own agenda. With Alerts and/or with blackout periods, if you are using it within an Expert Advisor! All in one Economic Calendar indicator
    The Metatrader 5 has a hidden jewel called Chart Object, mostly unknown to the common users and hidden in a sub-menu within the platform. Called Mini Chart, this object is a miniature instance of a big/normal chart that could be added/attached to any normal chart, this way the Mini Chart will be bound to the main Chart in a very minimalist way saving a precious amount of real state on your screen. If you don't know the Mini Chart, give it a try - see the video and screenshots below. This is a gr
    The Market Momentum indicator is based on the Volume Zone Oscillator (VZO), presented by Waleed Aly Khalil in the 2009 edition of the International Federation of Technical Analysts journal, and presents a fresh view of this market valuable data that is oftenly misunderstood and neglected: VOLUME. With this new approach of "seeing" Volume data, traders can infer more properly market behavior and increase their odds in a winning trade. "The VZO is a leading volume oscillator; its basic usefulness
    Фильтр:
    Ziya1218
    81
    Ziya1218 2022.06.12 11:19 
     

    Пользователь не оставил комментарий к оценке

    Flavio Javier Jarabeck
    354943
    Ответ разработчика Flavio Javier Jarabeck 2022.06.12 14:09
    Sure! Please send me a message through Telegram at: @MinionsLabs ;)
    Ответ на отзыв