Heikin Ashi Volume

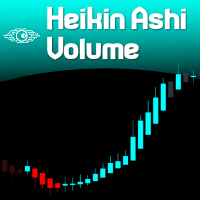
Para aqueles que adoram negociar usando os Candlesticks Heikin Ashi, aqui está mais um aliado poderoso: Heikin Ashi Volume. Este indicador é uma ideia e criação exclusiva nossa aqui na Minions Labs para você.

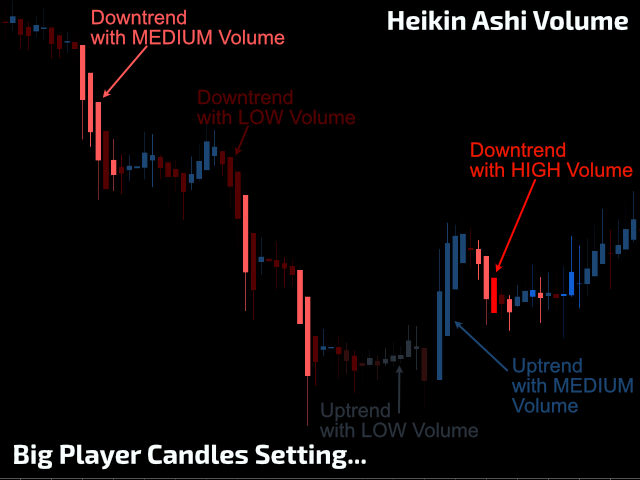
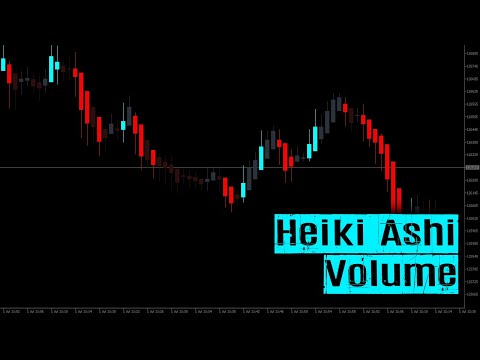
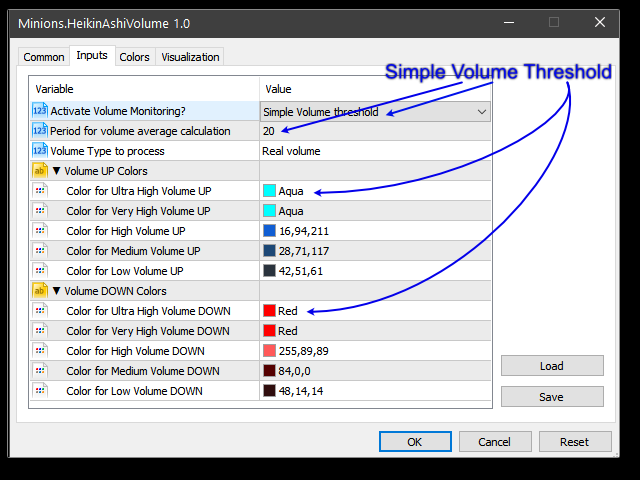
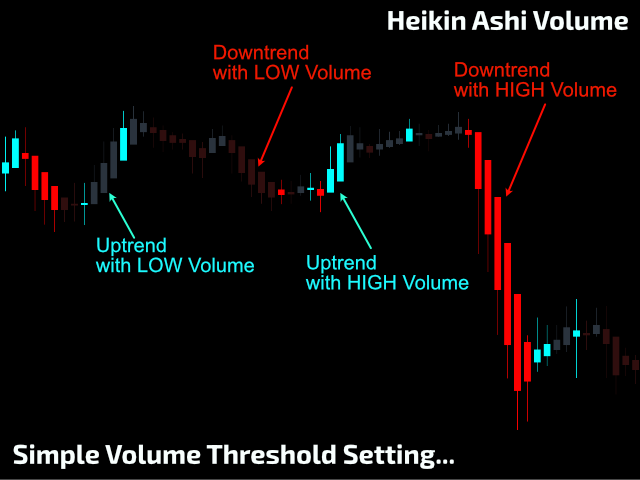
A ideia por trás deste indicador é ter uma pista visual sobre os candlesticks Heiken Ashi apontando para aqueles com grande volume. Para que isso aconteça, você pode escolher entre 2 técnicas diferentes de identificar o volume "alto":

  1. Volume maior acima da média dos últimos N bars anteriores.
  2. Volume maior segmentado em "níveis" (Ultra Alto, Muito Alto, Alto, Médio e Baixo), que foi trazido do nosso indicador premiado chamado Big Player Candles.


CONFIGURAÇÕES

  • Tipo de Monitoramento de Volume a ser aplicado sobre os candlesticks.
  • Período para cálculos da média de volume.
  • Cores para todas as possibilidades de monitoramento de Volume.

    BUFFERS PARA USAR NO SEU EA

        #4 - Buffer de Cores. Valores Possíveis:
            1 = Volume Ultra-Alto em Tendência de Alta
            2 = Volume Muito Alto em Tendência de Alta
            3 = Volume Alto em Tendência de Alta
            4 = Volume Médio em Tendência de Alta
            5 = Volume Baixo em Tendência de Alta
            6 = Volume Ultra-Alto em Tendência de Baixa
            7 = Volume Muito Alto em Tendência de Baixa
            8 = Volume Alto em Tendência de Baixa
            9 = Volume Médio em Tendência de Baixa
            10 = Volume Baixo em Tendência de Baixa


    Gostaria de experimentá-lo por si mesmo, ao vivo em seus ativos? Baixe a versão DEMO aqui: Heikin Ashi Volume DEMO

    * Devido à nova política da MQL5, os desenvolvedores não podem mais fornecer versões DEMO para o público em geral aqui neste site. É por isso que você será redirecionado para um site externo ao clicar no link acima.

    * Se você gostaria de experimentar este indicador em um ambiente de BackTest para Expert Advisor, por favor, baixe a versão DEMO GRATUITA no botão encontrado aqui neste produto (lado esquerdo desta tela).


    Não Encontrou uma Funcionalidade que Precisa?

    Nenhum produto é perfeito para todos. Se você acha que precisa de uma funcionalidade ausente de nosso produto, basta nos enviar uma mensagem. Nós adoramos feedback!
    Produtos recomendados
    Smart FVG Stats
    - Md Rashidul Hasan
    5 (1)
    The  Smart FVG Statistics Indicator  is a powerful MetaTrader 5 tool designed to automatically identify, track, and analyze Fair Value Gaps (FVGs) on your charts. Love it? Hate it? Let me know in a review! Feature requests and ideas for new tools are highly appreciated. :) Try "The AUDCAD Trader": https://www.mql5.com/en/market/product/151841 Key Features Advanced  Fair Value Gap  Detection Automatic Identification : Automatically scans for both bullish and bearish FVGs across specified histo
    FREE
    VWAP Simple
    Deibson Carvalho
    4.24 (29)
    O Preço médio ponderado por volume é semelhante a uma média móvel, exceto que o volume é incluído para ponderar o preço médio durante um período. O preço médio ponderado por volume [VWAP] é uma média ponderada dinâmica projetada para refletir com mais precisão o preço médio verdadeiro de uma segurança em um determinado período. Matematicamente, o VWAP é o somatório do dinheiro (ou seja, Volume x Preço) transacionado dividido pelo volume total em qualquer horizonte de tempo, normalmente do merca
    FREE
    The indicator highlights the points that a professional trader sees in ordinary indicators. VisualVol visually displays different volatility indicators on a single scale and a common align. Highlights the excess of volume indicators in color. At the same time, Tick and Real Volume, Actual range, ATR, candle size and return (open-close difference) can be displayed. Thanks to VisualVol, you will see the market periods and the right time for different trading operations. This version is intended f
    FREE
    Value Chart Candlesticks
    Flavio Javier Jarabeck
    4.57 (14)
    The idea of a Value Chart indicator was presented in the very good book I read back in 2020 , " Dynamic Trading Indicators: Winning with Value Charts and Price Action Profile ", from the authors Mark Helweg and David Stendahl. The idea is simple and the result is pure genius: Present candlestick Price analysis in a detrended way! HOW TO READ THIS INDICATOR Look for Overbought and Oversold levels. Of course, you will need to test the settings a lot to find the "correct" one for your approach. It
    FREE
    Veja quanto volume cada onda de preço precisou, quanto andou e em quanto tempo, comparado com as ondas anteriores, direto no gráfico de preço do MetaTrader 5. O JET Weis Waves PRO desenha as ondas de preço sobre os candles: uma linha verde para cada onda de alta e uma vermelha para cada onda de baixa, de uma virada até a seguinte. A onda vira quando o preço volta o valor de reversão que você definir (em pontos, em % do preço ou em múltiplos do ATR). No fim de cada onda, um rótulo mostra o volume
    Weis Waves
    Flavio Javier Jarabeck
    2.83 (18)
    The original author is David Weis, an expert in the Wyckoff Method. The Weis Wave is a modern adaptation of the 1930's Wyckoff Method, another expert in Tape Reading techniques and Chart Analysis. Weis Waves takes market volume and stacks it into waves according to price conditions giving the trader valuable insights about the market conditions. If you want to learn more about this subject you can find tons of videos in YouTube. Just look for "The Wickoff Method", "Weis Wave" and "Volume Spread
    FREE
    Bollinger Bands B
    Flavio Javier Jarabeck
    4.5 (6)
    John Bollinger created this indicator in 2010 as a way to read the original indicator (Bollinger Bands) in a more "technical" way, shown as an oscillator. The typical range of the Bollinger Bands %B is 0 - 0.5 - 1.0, where "0" represents the lower band, the "0.5" the middle band, and "1" the upper band. The line on the indicator represents the Closing prices. As simple as that. SETTINGS Bollinger Bands period of analysis Standard Deviation multiplier Shift Price type to be analyzed If you like
    FREE
    Follow The Line MT5
    Oliver Gideon Amofa Appiah
    4.6 (35)
    This indicator obeys the popular maxim that: "THE TREND IS YOUR FRIEND" It paints a GREEN line for BUY and also paints a RED line for SELL. (you can change the colors). It gives alarms and alerts of all kinds. IT DOES NOT REPAINT and can be used for all currency pairs and timeframes. Yes, as easy and simple as that. Even a newbie can use it to make great and reliable trades. NB: For best results, get my other premium indicators for more powerful and reliable signals. Get them here: https://www.m
    FREE
    LT Donchian Channel
    Thiago Duarte
    4.86 (7)
    Donchian Channel (ou canal de Donchian) é um indicador criado por  Richard Donchian. Ele é  formado tomando a máxima mais alta e a mais baixa mais baixa do último período especificado em velas. A área entre alta e baixa é o canal para o período escolhido. Sua configuração é simples. É possível ter a média entre a linha superior e inferior além de alertas quando o preço atinge um dos lados. Se tiver alguma dúvida ou encontrar alguma falha, me contate. Faça bom uso!
    FREE
    Fluxo de volume comprador e vendedor numa janela separada, no seu gráfico do MetaTrader 5. O JET Volume Flow mostra, numa janela separada, quanto do volume recente entrou em barras de alta e quanto entrou em barras de queda. Acima de zero, o fluxo é comprador (histograma verde); abaixo de zero, é vendedor (histograma vermelho). Os movimentos de preço muito pequenos são ignorados e os picos de volume fora do normal são limitados, para que uma única barra não domine a leitura. O fluxo é avaliado n
    FREE
    RSI back arrows
    Smaylle Rafael Coelho Mariano
    O indicador   Setas de Retorno do RSI   é uma ferramenta poderosa projetada para traders que utilizam o Índice de Força Relativa (RSI) para identificar possíveis reversões de mercado. Este indicador destaca especificamente quando o RSI sai das zonas   sobrecomprada   ou   sobrevendida , fornecendo sinais visuais claros para informar as decisões de negociação. Principais Características: Sinais Visuais : O indicador marca setas no gráfico quando o RSI retorna à zona neutra, facilitando a identifi
    FREE
    Supports And Resistances Lines
    Francisco Gomes Da Silva
    4.66 (47)
    Níveis de Suportes e resistências Conheça e teste nosso indicador com a função Multi Time frame onde você pode usar todos os timeframes dentro do gráfico atual como identificar suportes e resistências automaticamente Este indicador de suporte e resistências cria linhas de suporte e linhas de resistência usando o indicador "Fractals" com base Como criar linhas de suporte O Indicador cria linhas de suporte automaticamente toda vez que o “Fractals” cria um fundo automaticamente ou faz um novo fundo
    FREE
    Stochastic   +   RSI   Multi-Timeframe   Dashboard   with   Momentum   Strength Need Trade Assistant? Trade Panel Pro MT 5 Please leave a review, if you like this.   OVERVIEW A   professional   multi-timeframe   dashboard   indicator   that   displays   Stochastic   Oscillator   and   RSI   (Relative   Strength   Index)   values   from   7   different   timeframes   simultaneously   on   a   single   compact   panel.   Perfect   for   scalpers   and   day   traders   who   need   quick   m
    FREE
    TradeVision Pro
    Ian Nganga Comba
    TradeVisonPro Forex Analyzer Pro Painel de análise e monitoramento de contas de trading MT5 TradeVisonPro Forex Analyzer Pro é uma solução de análise de trading e monitoramento de contas desenvolvida para usuários do MetaTrader 5. O produto organiza os dados de trading do MT5 em um painel web estruturado, permitindo que os traders visualizem informações da conta, monitorem posições abertas, analisem o histórico de operações, acompanhem estratégias, mantenham um diário de trading e revisem estatí
    FREE
    Basic Vwap
    james mugendi
    4 (1)
    Simple Vwap with the daily, weekly and monthly VWAP is the abbreviation for   volume-weighted average price , which is a technical analysis tool that shows the ratio of an asset's price to its total trade volume. It provides traders and investors with a measure of the average price at which a stock is traded over a given period of time. How it's used Identify entry and exit points:   Traders can use VWAP to determine when to buy or sell an asset.   Understand price trends :  Traders can use V
    FREE
    Master HMA
    Leonel Alberto Jose Quintana
    Master HMA para MetaTrader 5 Master HMA é um indicador técnico desenvolvido para MetaTrader 5 que combina diferentes cálculos Hull Moving Average em uma estrutura visual destinada à análise da direção, inclinação e comportamento do movimento do preço. O indicador utiliza três períodos de HMA: Fast, Main e Slow. A relação entre essas linhas permite observar mudanças na estrutura do movimento e acompanhar diferentes fases do mercado. A HMA principal utiliza cores diferentes para representar os est
    FREE
    Donchian Breakout And Rsi
    Mattia Impicciatore
    4.33 (3)
    Descrição geral Este indicador é uma versão aprimorada do Canal Donchian clássico, enriquecida com funções práticas para o trading real. Além das três linhas padrão (máxima, mínima e linha do meio), o sistema detecta breakouts e os mostra visualmente com setas no gráfico, exibindo apenas a linha oposta à direção da tendência atual para uma leitura mais limpa. O indicador inclui: Sinais visuais : setas coloridas nos breakouts Notificações automáticas : alerta pop-up, push e e-mail Filtro RSI : pa
    FREE
    Are you tired of drawing trendlines every time you're analyzing charts? Or perhaps you would like more consistency in your technical analysis. Then this is for you. This indicator will draw trend lines automatically when dropped on a chart. How it works Works similar to standard deviation channel found on mt4 and mt5. It has 2 parameters: 1. Starting Bar 2. Number of bars for calculation The   starting bar   is the bar which drawing of the trend lines will begin, while the   number of bars for c
    FREE
    GDS Renko Pip ST Chart - Pip-Based Renko Chart Indicator for MetaTrader 5 GDS Renko Pip ST Chart is a pip-based Renko chart indicator for MetaTrader 5. It helps traders build and study cleaner Renko price movement using a practical fixed pip or point-based brick structure. This tool is designed as a Renko chart foundation for manual analysis. It does not predict the market, does not generate buy or sell signals and does not decide whether a trade should be opened. Renko EDGE EA Golden Delta | A
    FREE
    Descrição Geral O Indicador Fair Gap Value identifica e destaca “fair value gaps” no gráfico do MetaTrader 5. Um fair gap ocorre quando há um vazio de preço entre a mínima de uma vela e a máxima de outra, separadas por uma vela intermediária. O indicador desenha retângulos coloridos (de viés altista e baixista) para ressaltar essas áreas, oferecendo suporte visual claro para estratégias de price action. Principais Funcionalidades Detecção de gap altista : realça gaps entre a mínima da vela atual
    FREE
    MSX SuperTrend Visual Indicator Overview MSX SuperTrend Visual Indicator is a MetaTrader 5 indicator designed to display trend direction and market structure using a SuperTrend-based calculation with optional filtering components. The indicator combines trend visualization, volatility measurement and optional EMA-based filtering to provide a clear graphical representation of market conditions. Features • SuperTrend-based trend visualization • ATR-based volatility calculation • Optional Heikin A
    FREE
    Friend of the trend : Seu Rastreador de Tendências Domine o mercado com o Friend of the trend , o indicador que simplifica a análise de tendências e te ajuda a identificar os melhores momentos para comprar, vender ou esperar. Com um design intuitivo e visualmente impactante, o Trend Analisa os movimentos de preço e entregar sinais através de um histograma colorido: Barras Verdes : Sinalizam uma tendência de alta, indicando oportunidades de compra. Barras Vermelhas : Alertam para uma tendência de
    FREE
    (Special New Year promotion - free price!) The indicator displays the actual 'Scale in points per bar' (identical to the manual setting in the Terminal, see screenshot) in the upper right corner of the chart. The displayed value changes INSTANTLY whenever the chart scale is changed! (This is very convenient when planning screenshots). In Settings: Change language (Russian/English), font size of the displayed text, text label offset coefficient from the graph corner, equally in X and Y directi
    FREE
    White Weis Volume Ticks
    Ricardo Almeida Branco
    5 (4)
    White Weis Volume Este indicador mostra o somatório do volume em cada onda, bulish ou bearish, conforme idealizado por David Weis, mas traz um importante adicional que é a marcação da barra de maior volume da onda (White Bar)! Na codificação do indicador, foi buscado otimizar o código para exigir o mínimo processamento durante o uso e não sobrecarregar o mt5. O indicador pode ser usado para análise e estudo pré pregão, onde o trader analisa possíveis pontos de suporte e resistência com base
    Deviation Trend Profile Overview Deviation Trend Profile is a MetaTrader 5 chart indicator that combines three visual layers in a single chart window: a moving average with momentum-based coloring, deviation bands calculated from volatility, and a horizontal distribution profile drawn to the right of the current price. The indicator is an analytical tool. It does not open, modify or close trades, and it is not a complete trading system. It is designed to help the user observe trend direction, mo
    FREE
    JT360 DNA Mini PnL Pointer V1.04 Public Compacto. Claro. Sempre à vista. O JT360 DNA Mini PnL Pointer é um indicador leve para MetaTrader 5 que apresenta o lucro ou prejuízo flutuante agregado de todas as posições abertas no símbolo do gráfico atual. O seu design compacto combina o PnL baseado no risco, expresso em R, uma pequena barra visual e uma matriz de cores configurável. As cores características da JT360 — turquesa e magenta — destacam os valores extremos e facilitam a identificação rápid
    FREE
    HMA Scalper Pro
    Vladimir Shumikhin
    5 (1)
    HMA Scalper Pro for MetaTrader 5 HMA Scalper Pro é um indicador de tendência para MetaTrader 5, baseado no algoritmo Hull Moving Average (HMA), publicado pela primeira vez por Alan Hull em 2005. O indicador foi projetado para analisar a direção da tendência atual e exibir uma linha suavizada construída no algoritmo Hull Moving Average. Em comparação com as médias móveis tradicionais, este algoritmo foi desenvolvido para reduzir o atraso, mantendo a suavidade da linha. HMA Scalper Pro permite
    FREE
    Renko Heatmap Pro – ATR Renko Trend, Reversal and Trade Levels Renko Heatmap Pro is a MetaTrader 5 (MT5) Renko-style trend and volatility analysis indicator that uses Average True Range (ATR)-based calculations to visualise directional price movement, potential trend reversals, and changing market conditions on a conventional price chart. Designed for traders who want Renko-inspired analysis without relying solely on a separate offline Renko chart, the indicator presents calculated directional s
    Donchian Pro
    Paulo Henrique Faquineli Garcia
    5 (3)
    O Canal Donchian Os canais são uma das ferramentas de análise técnica mais populares porque transmitem intuitivamente aos analistas as restrições que tendem a ocorrer na maioria das mudanças de preço. Os usuários do canal sabem que informações valiosas podem ser obtidas a qualquer momento, independentemente de o preço estar no centro de uma faixa ou próximo a uma das fronteiras. Uma das técnicas mais famosas para explorar esses conceitos são as bandas de Bollinger. No entanto, John Bollinger não
    FREE
    AD Pro
    Ola Marten Hamberg
    A/D Pro is a modern version of the classic Accumulation/Distribution indicator. It keeps the standard MetaTrader 5 A/D calculation and adds new display modes, automatic divergence detection, alerts and a live status panel, so you can see buying and selling pressure at a glance. The A/D indicator measures where each bar closes within its range and weights it by volume. A rising line shows accumulation (buying pressure), a falling line shows distribution (selling pressure). Divergences between A
    FREE
    Os compradores deste produto também adquirem
    Trend Sniper X
    Sarvarbek Abduvoxobov
    4.86 (44)
    Trend Sniper X é um indicador de acompanhamento de tendência para múltiplos tempos gráficos no MetaTrader 5 que ajuda os traders a identificar a direção da tendência e potenciais pontos de reversão com clareza e precisão. para MT4: https://www.mql5.com/en/market/product/193245 Informações sobre o preço: O preço atual é promocional e está sujeito a alterações à medida que novas atualizações e funcionalidades forem lançadas. Oferta Bônus: Para obter o Auto-Trade Assistant EA GRATUITO para este in
    Um novo Rei chegou à cidade - Indicador + Gestão de Ordens (TP1 + TP2 + TP3) + Enviador opcional de sinais para Telegram INCLUÍDO (GRÁTIS) (SISTEMA COMPLETO DE TRADING e SINAIS) Nosso melhor EA para Ouro: Gold Slayer Este indicador inclui uma estratégia avançada, um sistema de trading com gestão de ordens personalizável e um sistema de reversão à média que combina extensões de envelopes, apoiado por múltiplos filtros inteligentes de confirmação, como o RSI, para capturar entradas de reversão de
    Smart Trend Trading System — MetaTrader 5 Após a compra, envie-me uma mensagem no MQL5 para receber Smart Universal Expert Advisor GRÁTIS, além do curso online, do manual em PDF e do acesso ao grupo privado. O STTS reúne a direção da tendência, sinais de entrada e saída, zonas de reversão e níveis de preço importantes diretamente no seu gráfico. Siga o sistema manualmente ou conecte um EA compatível separado para executar operações automaticamente com as configurações que você escolher. UM SISTE
    O Entry Points Pro mostra onde entrar, onde colocar o stop e com qual lote operar — antes de você colocar a ordem. PREÇO Agora 199 USD: 8 cópias por este preço, depois 249 USD. O preço final é 349 USD. Eu ganho meu dinheiro operando nos mercados e mostro isso, por isso não preciso vender este indicador para todo mundo. É uma ferramenta para traders que pensam por conta própria, não um botão mágico. Sem rompimento, não há operação. Uma seta cinza é um sinal cancelado: o preço não rompeu o candle
    Tenha sua vantagem no trading à vista! M5 Sniper é um novo indicador da MeanFX. Ele combina sinais de trading precisos com níveis adaptativos de TP/SL — criando, como resultado, as melhores operações estatísticas possíveis! O preço aumenta a cada 5 compras, o próximo preço é de 69$ Envie-me uma mensagem após a compra para receber dicas/guia e um EA bônus O que o faz se destacar? Desempenho estatístico comprovado no Gold XAUUSD ( funciona em praticamente todos os ativos , com foco em dominar um ú
    Zoryk Gold
    Reda El Koutbane
    4.79 (19)
    O desconto termina em 24 horas — próximo preço $ 69 ZORYK — Sistema avançado de sinais para XAUUSD no MetaTrader 5 Você conhece essa sensação. Você passa muito tempo analisando o ouro. Espera pela entrada certa. Finalmente abre a operação e o preço começa imediatamente a se mover contra você. Você fecha cedo demais, move o Stop Loss ou hesita por alguns segundos. Depois disso, o mercado alcança exatamente o destino que você esperava originalmente, mas sem você dentro da operação. O problema ne
    Ultra Indicator
    Ihor Otkydach
    5 (1)
    O ULTRA é um indicador técnico que funciona numa base «tudo-em-um» — analisa o mercado de forma independente, gera sinais de negociação, apresenta níveis para definir ordens de stop-loss e sugere quando encerrar as negociações para garantir lucros ou minimizar perdas. Por outras palavras, não importa se não sabe analisar o mercado, determinar níveis — onde definir o seu stop-loss — ou se tem dificuldades com a gestão do capital. O ULTRA fará tudo isso por si! BÓNUS PARA O COMPRADOR: Após adquiri
    Gann Made Easy   é um sistema de negociação Forex profissional e fácil de usar, baseado nos melhores princípios de negociação usando a teoria do sr. W. D. Gann. O indicador fornece sinais precisos de COMPRA e VENDA, incluindo níveis de Stop Loss e Take Profit. Você pode negociar mesmo em movimento usando notificações PUSH. Entre em contato comigo após a compra para receber instruções de negociação e ótimos indicadores extras gratuitamente! Provavelmente você já ouviu muitas vezes sobre os método
    SuperScalp Pro
    Van Minh Nguyen
    4.54 (37)
    SuperScalp Pro - Professional Multi-Layer Confluence Scalping System O SuperScalp Pro é um indicador avançado de scalping que aprimora o Supertrend clássico com vários filtros inteligentes de confirmação. Ele ajuda a identificar oportunidades de Buy/Sell com maior probabilidade de sucesso, reduzindo significativamente os sinais falsos. Setas claras de Buy e Sell aparecem diretamente no gráfico, juntamente com os níveis de Stop Loss e Take Profit baseados em ATR, calculados automaticamente em tem
    SMC Intraday Formula
    VividMind Digital Solutions
    5 (26)
    Vamos ser honestos primeiro. Nenhum indicador sozinho vai te tornar lucrativo. Se alguém te disser o contrário, está te vendendo um sonho. Qualquer indicador que mostre setas perfeitas de compra/venda pode ser feito para parecer impecável — basta dar zoom na parte certa da história e tirar um print das operações vencedoras. Nós não fazemos isso.  SMC Intraday Formula é uma ferramenta. Ela lê a estrutura do mercado para você, identifica as zonas de maior probabilidade de preço e mostra exatament
    GoldenX Entry MT5
    VividMind Digital Solutions
    5 (17)
    GoldenX Entry é um indicador para MT5 com um algoritmo adaptativo Smart Entry Trend, um sistema de pontuação de sinais, um detector de regime de mercado e um filtro de volatilidade. Cada sinal inclui um nível de entrada calculado, três níveis de Take-Profit (TP1, TP2, TP3) e um nível de Stop-Loss. Ele é construído sobre múltiplas camadas analíticas projetadas para se adaptar a diferentes condições de mercado, combinando um sistema analítico multicamadas com um otimizador integrado e um sistema d
    Gold Trend Coach MT5
    Cristhian Alexander Gaibor Cuasquer
    4.27 (11)
    Sinais de compra e venda sem repintura para o ouro (XAUUSD) no MetaTrader 5. Todo sinal vem com stop loss e três take profits. Um filtro Smart Money Concepts com BOS e CHoCH, para você operar a favor da estrutura, não contra ela. Um Mentor ao vivo no seu painel que guia cada passo, da entrada até o TP3. E alertas direto no seu celular e no seu próprio canal do Telegram. Isso é o Gold Trend Coach. Nunca mais opere sozinho. KIT DO COMPRADOR GRÁTIS junto com a sua compra: 1. Telegram Alert Bridge:
    Boba Analysis Suite
    Trade Ready Solutions LLC
    5 (2)
    Boba Analysis Suite O Boba Analysis Suite é um indicador de análise para o MetaTrader 5. Reúne a estrutura do mercado, as zonas de preço relevantes e o contexto geral do mercado numa única visualização do gráfico. Desenvolvido a partir da experiência prática como trader e formador de traders, apoia um processo de análise estruturado: avaliar a direção do mercado, identificar níveis importantes e analisar vários períodos gráficos em conjunto. Análise em contexto O significado de cada sinal depend
    FX Power MT5 NG
    Daniel Stein
    5 (33)
    FX Power: Analise a Força das Moedas para Decisões de Negociação Mais Inteligentes Visão Geral FX Power é a sua ferramenta essencial para compreender a força real das principais moedas e do ouro em quaisquer condições de mercado. Identificando moedas fortes para comprar e fracas para vender, FX Power simplifica as decisões de negociação e revela oportunidades de alta probabilidade. Quer você prefira seguir tendências ou antecipar reversões usando valores extremos de Delta, esta ferramenta adap
    Azimuth Pro
    Ottaviano De Cicco
    5 (7)
    Azimuth Pro V2: Estrutura Fractal Sintética e Entradas Confirmadas para MT5 Visão geral Azimuth Pro é um indicador de estrutura swing multinível da Merkava Labs . Quatro camadas de swing aninhadas, VWAP ancorado em swings, detecção de padrões ABC, filtragem estrutural de três timeframes e entradas confirmadas em barra fechada — um gráfico, um fluxo de trabalho dos micro-swings aos macro-ciclos. Este não é um produto de sinais cegos. É um fluxo de trabalho baseado em estrutura para traders que v
    FiboSniper Pro
    Van Minh Nguyen
    5 (4)
    FiboSniper Pro – Multi-Filter Fibonacci System with Auto SL/TP and Control Panel FiboSniper Pro é um indicador técnico que combina Fibonacci Envelopes dinâmicos com vários filtros de confirmação para gerar sinais seletivos de Buy e Sell. Os níveis de Fibonacci são calculados com base em Moving Average e ATR e, em seguida, filtrados por ADX, EMA, RSI, ATR, Volume, Time e estrutura das velas. O indicador exibe diretamente no gráfico os níveis automáticos de Stop Loss e Take Profit baseados em ATR,
    M1 Sniper MT5
    Oleg Rodin
    5 (7)
    O   M1 SNIPER   é um sistema indicador de negociação fácil de usar. É um indicador de seta projetado para o período M1. O indicador pode ser usado como um sistema independente para scalping no período M1 e pode ser usado como parte do seu sistema de negociação existente. Embora este sistema de negociação tenha sido projetado especificamente para negociação no M1, ele também pode ser usado em outros períodos. Originalmente, desenvolvi este método para negociar XAUUSD e BTCUSD. Mas considero-o úti
    Apex Patterns PRO Compre o indicador - Obtenha um Expert Advisor baseado nele GRATUITAMENTE. Inteligência Auto-otimizada de Padrões e Rompimentos Os rastreadores de padrões tradicionais dependem de entradas fixas, frequentemente apresentando baixo desempenho quando a volatilidade e as estruturas do mercado mudam. O Apex Patterns PRO foi projetado para se adaptar às mudanças nas condições do mercado, combinando o reconhecimento estrutural de padrões de gráfico, filtragem de momentum e auto-otimi
    SQN Max indicator for MT5 by ITC
    Renaud Herve Francois Candel
    Sqn Max Indicator Sqn Max is an exclusive indicator to trade the market with high effectiveness. The indicator is based on price action, volatility and trend. This indicator is as simple as possible but not too simple. The indicator can generate alerts to ease the trading process. You don't have to stay all day in front of your screen. The indicator can be used with any class of assets and with any time frame. It is possible to achieve better results trading our list of selected assets. We achi
    Adaptive Price Action Engine Compre um indicador, ganhe o EA de graça Análise Auto-Otimizada de Tendências e Padrões de Candlestick em Múltiplos Timeframes Os mercados estão em constante mudança, e nem todos os padrões de Price Action têm o mesmo valor em todas as condições de mercado. O Adaptive Price Action Engine foi desenvolvido para se adaptar às mudanças nas condições do mercado, combinando estrutura de tendência, análise Multi-Timeframe, padrões de candlestick e otimização estatística em
    Atomic Analyst MT5
    Issam Kassas
    4.51 (65)
    Atomic Analyst — MetaTrader 5 Após a compra, envie-me uma mensagem no MQL5 para receber Smart Universal Expert Advisor GRÁTIS, além do curso online, do manual em PDF e do acesso ao grupo privado. O Atomic Analyst reúne a ação do preço, a direção da tendência, sinais de entrada e saída, Stop Loss e vários níveis de Take Profit diretamente no seu gráfico. VEJA O SINAL. ENTENDA O CENÁRIO. O Atomic Analyst organiza sua análise em informações visuais claras: • Setas de compra e venda para identificar
    Próxima Atualização — Versão 2.52 em Breve! [NOVO] Prepare-se para 4 Grandes Novos Recursos Projetados para Aprimorar sua Análise de Mercado e seu Fluxo de Trabalho de Trading Estamos levando a análise de mercado a um novo nível com 4 novos recursos desenvolvidos para atender às suas necessidades de trading. Apresentamos: 1. TRADE OVERVIEW DASHBOARD 2. CONFLUENCE AT ZONE 3. STRONG & WEAK HIGH/LOW 4. OTE 1. TRADE OVERVIEW DASHBOARD Um painel que ajuda você a compreender mais facilmente o panoram
    Divergence Bomber
    Ihor Otkydach
    4.89 (94)
    Cada comprador deste indicador recebe adicionalmente, e de forma gratuita: A ferramenta exclusiva "Bomber Utility", que acompanha automaticamente cada operação, define os níveis de Stop Loss e Take Profit e fecha operações de acordo com as regras da estratégia; Arquivos de configuração (set files) para ajustar o indicador em diferentes ativos; Set files para configurar o Bomber Utility nos modos: "Risco Mínimo", "Risco Balanceado" e "Estratégia de Espera"; Um vídeo tutorial passo a passo que a
    Tokyo mt5 Indicator
    Vasiliy Strukov
    5 (15)
    O Tokyo Indicator oferece uma visão geral visual clara da direção da tendência, de possíveis sinais de negociação e das condições de mercado. Sua linha de tendência em degraus e codificada por cores distingue as fases de alta (azul) das fases de baixa (magenta). Setas direcionais correspondentes destacam possíveis oportunidades de compra e venda quando a tendência exibida muda. Um painel integrado reúne o sinal atual, o viés de mercado, o momentum, a volatilidade e a qualidade do sinal em uma v
    Power Candles MT5
    Daniel Stein
    4.58 (12)
    Power Candles V3 - Indicador de força com auto-otimização O Power Candles V3 transforma a força da moeda e do instrumento num plano de negociação prático em todos os gráficos aos quais está associado. Em vez de se limitar a colorir as velas, executa uma otimização automática em tempo real em segundo plano e apresenta-lhe os melhores valores de Stop Loss, Take Profit e limiar de sinal para o símbolo em questão. Basta um clique para o adotar na negociação em tempo real — as linhas de entrada, Stop
    Currency Strength Wizard   é um indicador muito poderoso que fornece uma solução completa para uma negociação bem-sucedida. O indicador calcula o poder deste ou daquele par forex usando os dados de todas as moedas em vários intervalos de tempo. Esses dados são representados em uma forma de índice de moeda fácil de usar e linhas de energia de moeda que você pode usar para ver o poder desta ou daquela moeda. Tudo o que você precisa é anexar o indicador ao gráfico que deseja negociar e o indicador
    Naked Forex Tweezer Pro Indicator Tweezer Pro Indicator is a pattern recognition indicator for Forex, Stocks, Indices, Futures, Commodities and Cryptos. The standard Tweezer is a two bar pattern. Our enhanced version is a multi-bar pattern. We filter the patterns for you so that you only get the     best and most effective patterns   and ignore the noise. The Tweezer pattern is a simple and effective pattern to trade. The strategy that comes with the Tweezer is based on price action. The Twe
    Auto Optimized SpeedAngle é um sistema de vetorização de momentum de nível institucional que elimina o sobreajuste ( curve-fitting ) por meio da otimização contínua de avanço ( Walk-Forward Optimization , WFO). Em vez de depender de entradas estáticas que se degradam quando os regimes de mercado mudam, o indicador recalibra dinamicamente seus parâmetros utilizando validação fora de amostra ( Out-of-Sample , OOS), garantindo que os sinais exibidos representem vantagens estatísticas genuínas e não
    Smc Pro ToolKit
    Talal N Z Aljarusha
    5 (13)
    SMC PRO TOOLKIT — SMART MONEY ANALYSIS & STRUCTURED TRADE PLANNING SMC Pro ToolKit is a professional Smart Money Concepts analysis workspace for MetaTrader 5. It combines market structure, multi-timeframe analysis, institutional price zones, setup evaluation, confirmation tools, volume context, alerts, and risk planning inside one organized chart environment. One workspace. Multiple layers of confirmation. One structured trading plan. OPEN COMPLETE USER GUIDE MULTI-CONDITION SETUP ENGINE At
    Indicador multi-moeda de força e momentum MT5 O Dynamic Forex28 Navigator é a evolução dos nossos indicadores populares de longa data, reunindo o poder de cinco em um: Advanced Currency Strength28 Indicator (700 avaliações) Advanced Currency IMPULSE with ALERT (530 avaliações) Currency Strength EXOTICS GOLD Impulse with Alert CS28 Combo Signals (bônus atual) Não é necessário comprar quatro indicadores e empilhá-los nos seus gráficos. Tudo está reunido em um único indicador poderoso: a força dos
    Mais do autor
    Auto Support and Resistances
    Flavio Javier Jarabeck
    4.56 (71)
    Are you tired of drawing Support & Resistance levels for your Quotes? Are you learning how to spot Support & Resistances? No matter what is your case, Auto Support & Resistances will draw those levels for you! AND, it can draw them from other timeframes, right into you current chart, no matter what timeframe you are using... You can also Agglutinate regions/zones that are too much closer to each other and turning them into one single Support & Resistance Level. All configurable. SETTINGS Timefr
    FREE
    Mini POC
    Flavio Javier Jarabeck
    4.93 (29)
    For those who struggle with overbloated Volume Profile/Market Profile indicators, here is a solution that contains only the Point of Control (POC) information. Super-fast and reliable, the Mini POC indicator presents this vital information visually within your chart. Totally customizable in splittable timeframes, type of Volume, calculation method, and how many days back you need. SETTINGS Timeframe to split the POCs within the day. Volume type to use: Ticks or Real Volume. Calculation method .
    FREE
    Tabajara V5
    Flavio Javier Jarabeck
    4.84 (37)
    Metatrader 5 version of the famous Andre Machado's Tabajara indicator. If you don't know Andre Machado's Technical Analysis work you don't need this indicator... For those who need it and for those several friend traders who asked this porting from other platforms, here it is... FEATURES 8-period Moving Average 20-period Moving Average 50-period Moving Average 200-period Moving Average Colored candles according to the inflexion of the 20-period MA SETTINGS You can change the Period of all MA's
    FREE
    Inside Bar Radar
    Flavio Javier Jarabeck
    4.67 (6)
    The Inside Bar pattern is a very well known candlestick formation used widely by traders all over the world and in any marketplace. This approach is very simple and adds a little confirmation candle, so it adds a third past candlestick to the count to confirm the direction of the move (upward or downward). Obviously, there is no power on this candlestick formation if the trader has no context on what it is happening on the market he/she is operating, so this is not magic, this "radar" is only a
    FREE
    Aggression Volume
    Flavio Javier Jarabeck
    4.29 (17)
    O Indicador de Volume de Agressão é o tipo de indicador que raramente é encontrado na comunidade MQL5 porque não é baseado nos dados de Volume padrão fornecidos pela plataforma Metatrader 5. Ele requer a análise de todos os Ticks de tráfego solicitados na plataforma... Dito isso, o indicador de Volume de Agressão solicita todos os Dados de Tick do seu Broker e os processa para construir uma versão muito especial de um Indicador de Volume, onde as agressões de Compradores e Vendedores são plotada
    FREE
    MIDAS Super VWAP
    Flavio Javier Jarabeck
    4.27 (11)
    Imagine VWAP, MVWAP and MIDAS in one place... Well, you found it! Now you can track the movement of Big Players in various ways, as they in general pursue the benchmarks related to this measuring, gauging if they had good execution or poor execution on their orders. Traders and analysts use the VWAP to eliminate the noise that occurs throughout the day, so they can measure what prices buyers and sellers are really trading. VWAP gives traders insight into how a stock trades for that day and deter
    FREE
    Closing Price Reversal
    Flavio Javier Jarabeck
    5 (11)
    Closing Price Reversal is a very well known and traded candlestick pattern. This little indicator paints with specific (user-selected) colors the Closing Price Reveral Up and Down patterns, as well as the Inside Bars (as a bonus). Higher timeframes are more effective  as with all other candlesticks patterns. Do NOT trade solely on this indicator. Search the web for "Closing Price Reversal" to learn about the several approaches that can be used with this pattern. One of them is combining short/me
    FREE
    Weis Waves
    Flavio Javier Jarabeck
    2.83 (18)
    The original author is David Weis, an expert in the Wyckoff Method. The Weis Wave is a modern adaptation of the 1930's Wyckoff Method, another expert in Tape Reading techniques and Chart Analysis. Weis Waves takes market volume and stacks it into waves according to price conditions giving the trader valuable insights about the market conditions. If you want to learn more about this subject you can find tons of videos in YouTube. Just look for "The Wickoff Method", "Weis Wave" and "Volume Spread
    FREE
    Economic Markers
    Flavio Javier Jarabeck
    4.79 (14)
    Easily get all relevant economic events of the current day right into your chart, as markers. Filter what kind of markers do you want: by country (selected individually) and by Importance (High relevance, Medium, Low or any combination of these). Configure the visual cues to your liking. If there is more than one event set to the very same time, their Names will be stacked and you will see the messages merged with the plus (+) sign on the marker. Obviously that long or too much events on the sam
    FREE
    Big Player Candles
    Flavio Javier Jarabeck
    4.91 (23)
    If you heard about The Wyckoff Method, Volume Spread Analysis, etc... You are probably searching for the candlestick indicator that shows you the Volume spread all over the current bar, signaling every types of market status... You can control the several Market Levels with custom colors... It is up to you to decide how to use it. Our job is provide you with the indicator... If you like this indicator, all I am asking is a little Review (not a Comment, but a REVIEW! )...    This will mean A LO
    FREE
    Stackable VWAP
    Flavio Javier Jarabeck
    3.5 (4)
    Volume Weighted Average Price (VWAP) is a trading benchmark commonly used by Big Players that gives the average price a Symbol has traded throughout the day. It is based on both Volume and price. Additionally we put in this indicator the MVWAP (Moving Volume Weighted Average Price). For those who do not know the usage and the importance od this indicator I recommend a great article about this subject at Investopedia ( https://www.investopedia.com/articles/trading/11/trading-with-vwap-mvwap.asp
    FREE
    VWAP and MVWAP
    Flavio Javier Jarabeck
    4 (9)
    Volume Weighted Average Price (VWAP) is a trading benchmark commonly used by Big Players that gives the average price a Symbol has traded throughout the day. It is based on both Volume and price. Additionally we put in this indicator the MVWAP (Moving Volume Weighted Average Price). For those who do not know the usage and the importance od this indicator I recommend a great article about this subject at Investopedia ( https://www.investopedia.com/articles/trading/11/trading-with-vwap-mvwap.asp )
    FREE
    Money Flow Index EA Friendly
    Flavio Javier Jarabeck
    3.67 (3)
    O indicador tradicional Money Flow Index, desta vez, compatível com EAs . Existem 3 buffers expostos que podem ser usados por EAs para analisar automaticamente as condições de sobrecompra e sobrevenda da cotação. Basta usar a função tradicional iCustom() para obter esses sinais. Este cálculo do Money Flow Index é baseado no indicador MFI tradicional da Metaquote. CONFIGURAÇÕES Período do MFI Tipo de volume para analisar (Volume Real ou Ticks) Início da região de sobrecompra Início da região de
    FREE
    Symbol Watermark
    Flavio Javier Jarabeck
    4.63 (16)
    Another request from my brotherhood was putting the name of the Symbol being seen - a little bigger - on the Chart, just to get sure that they are seeing the correct one... Mistakes pay a high price on the market... It is a very effective, and almost resource-null-consuming indicator that displays the current Symbol Name and Timeframe in almost any position of your Chart, with any color, and any Font Size... And also you can change the divisor character that is presented between the Symbol Name
    FREE
    Server Clock
    Flavio Javier Jarabeck
    5 (5)
    Many friends asked me for a simple, non-obtrusive, resource-friendly clock to track the time during their trades. It seems pretty obvious, but it is a must-have for those trading the market manually, waiting for the Market News, or just to visually know what time it is... Trading is an absorbing endeavor! So, here it is... Totally configurable, including Font Type, Font Size and Chart Location: Upper Left/Center/Right OR Lower Left/Center/Right, with a little twist of adjusting the Offset, just
    FREE
    Waves Sizer
    Flavio Javier Jarabeck
    3.86 (7)
    Wyckoff fans, enjoy! Ideally to be used with the Weis Waves indicator, but it can be easily used alone, the Waves Sizer puts the range (in resulting Price movement) done by the Price on its market swings. You can control how accurate or loose will be the swings. This tool is very helpful for visually know how much the Price has traveled in your Timeframe. This way you can confront this level of effort with the resulting Volume, etc... Weis Waves indicator: https://www.mql5.com/en/market/produc
    FREE
    Market Momentum
    Flavio Javier Jarabeck
    4.43 (7)
    O indicador de Momento do Mercado é baseado no Oscilador de Zona de Volume (VZO), apresentado por Waleed Aly Khalil na edição de 2009 do jornal da Federação Internacional de Analistas Técnicos , e apresenta uma nova visão desses valiosos dados de mercado que muitas vezes são mal compreendidos e negligenciados: o VOLUME. Com essa nova abordagem de "ver" os dados de Volume, os traders podem inferir de maneira mais adequada o comportamento do mercado e aumentar suas chances em uma negociação bem-su
    FREE
    Flux Diffuser
    Flavio Javier Jarabeck
    4.33 (6)
    Based on Brazilian trader André Moraes' Difusor de Fluxo theory, the indicator is a more reliable version of the original MACD. It is a great confirmation indicator for Swing Trading and also can be used as a Day Trading tool. If you are not familiar with the concept or André's trading strategies, I strongly recommend his excelent book named "Se Afastando da Manada" in which he explains in detail how this indicator is used. Even if you don't know the Portuguese language it is not difficult to un
    FREE
    Force Numbers
    Flavio Javier Jarabeck
    5 (1)
    Several assets in several markets have the behavior of using specific numbers as Force Numbers, where support, resistance and price thrust is created. Let this indicator draw those levels of support and resistance for you. You can also stack it to show different level of Prices! This technique is being used by Tape Readers and Order Flow traders all over the world for a long time. Give it a try. Challenge yourself to study new ways of Price Action! SETTINGS What Price reference to use in the c
    FREE
    ATR Monitor
    Flavio Javier Jarabeck
    4.8 (5)
    O ATR é uma medida de volatilidade introduzida pelo famoso autor J. Welles Wilder Jr. em seu livro "New Concepts in Technical Trading Systems". Em geral, os traders estão acostumados a ver o ATR na forma de um indicador em uma sub-janela do gráfico. O que estou apresentando aqui é uma versão simplificada do ATR - apenas contendo o número atual do ATR - muito útil para monitorar apenas o momento atual do mercado. Se você quiser monitorar vários tempos gráficos dentro do gráfico corrente, bast
    FREE
    Price Trail Chart
    Flavio Javier Jarabeck
    5 (2)
    For those who hate candlesticks in lower timeframes (M1 through M15) we "invented" a clean new way to follow Price movement and displacement (volatility) called Price Trail Chart . The big "secret" is to get rid of those annoying candle wicks and draw the whole complete candle without them, this way we get a cleaner chart and a new view of the Price Path. No Open or Close markings, just LOW's and HIGH's, full body candle. Additionaly we inserted a Volume monitor from our Best Downloaded indicato
    FREE
    Time Spaced Moving Averages
    Flavio Javier Jarabeck
    5 (3)
    The concept is simple: Plotting Price behavior within several periods of time. Some Symbols behave very well during the trading day - with this I mean Intraday trading - and this behavior ends up plotting effectively well with the proposed Exponential Moving Averages in this indicator... Obviously that this behavior could not be seen in all Symbols, but you can give it a try... Just drop this indicator in a chart and you will see for yourself... This indicator is intended for "Feeling the Trend"
    FREE
    Price Momentum
    Flavio Javier Jarabeck
    4.92 (12)
    Value Chart indicator presents the Price evolution in a new form. This indicator, Price Momentum , was developed taking all the calculations presented in the book " Dynamic Trading Indicators " by Mark W. Helweg and David Stendahl (2002). The technique involves de-trended Prices from a user-defined Period of analysis and the addition of a Volatility index correction. The result is an Oscillator with 3 zones: Fair Price Value, Overbought/Oversold and Extremely Overbought/Oversold zones. Adding th
    FREE
    Candle Zones
    Flavio Javier Jarabeck
    You probably heard about Candlesticks behaviors, which in most of the times could denote and trace Volume behaviors even if you are not watching Volume itself... Well, this indicator will do this. Naked traders love to rely solely on candlesticks patterns and with Candle Zones you can trap special patterns and DRAW THEM on your chart. As simple as that. There are several filters you can tweak in order to achieve the analysis you want. Just give it a try. After several months of testing, we think
    FREE
    ATR Monitor EA Friendly
    Flavio Javier Jarabeck
    ATR Monitor ATR is a measure of volatility introduced by market technician J. Welles Wilder Jr. in his book, "New Concepts in Technical Trading Systems". In general, traders are accustomed to seeing the ATR in the form of a sub-window indicator. What I am presenting here is a simplified version of ATR - just the current ATR number - very useful for monitoring just the very moment of the current chart. And, by default, this indicator will not show up on screen, you can just use the buffers thems
    FREE
    Arrows Cleaner
    Flavio Javier Jarabeck
    5 (4)
    For those who use the Trading Arrows on the chart for later study, but use the Triple Screen approach and got all those arrows everywhere on all additional charts, here it is: Arrows Cleaner! Just drop it on the chart and leave it there. When needed, just with 1-click you get rid of all those annoying arrows... SETTINGS You can position the little Button on any corner of the chart. Additionally you can displace it with the Offset settings. You can enlarge or shrink its size, as well as the text
    FREE
    Candlestick Pattern Teller
    Flavio Javier Jarabeck
    5 (1)
    Minions Labs' Candlestick Pattern Teller It shows on your chart the names of the famous Candlesticks Patterns formations as soon as they are created and confirmed. No repainting. That way beginners and also professional traders who have difficulties in visually identifying candlestick patterns will have their analysis in a much easier format. Did you know that in general there are 3 types of individuals: Visual, Auditory, and Kinesthetic? Don't be ashamed if you cannot easily recognize Candlesti
    Economic Markers PRO
    Flavio Javier Jarabeck
    4 (1)
    Easily get all relevant economic events of the current day right into your chart, as markers. Filter what kind of markers do you want: by country (selected individually) and by Importance (High relevance, Medium, Low or any combination of these). Configure the visual cues to your liking. Additionaly you have the ability to add up to 5 personal markers of your own agenda. With Alerts and/or with blackout periods, if you are using it within an Expert Advisor! All in one Economic Calendar indicator
    Mini Chart Indicators
    Flavio Javier Jarabeck
    The Metatrader 5 has a hidden jewel called Chart Object, mostly unknown to the common users and hidden in a sub-menu within the platform. Called Mini Chart, this object is a miniature instance of a big/normal chart that could be added/attached to any normal chart, this way the Mini Chart will be bound to the main Chart in a very minimalist way saving a precious amount of real state on your screen. If you don't know the Mini Chart, give it a try - see the video and screenshots below. This is a gr
    Market Momentum PRO
    Flavio Javier Jarabeck
    The Market Momentum indicator is based on the Volume Zone Oscillator (VZO), presented by Waleed Aly Khalil in the 2009 edition of the International Federation of Technical Analysts journal, and presents a fresh view of this market valuable data that is oftenly misunderstood and neglected: VOLUME. With this new approach of "seeing" Volume data, traders can infer more properly market behavior and increase their odds in a winning trade. "The VZO is a leading volume oscillator; its basic usefulness
    Filtro:
    Ziya1218
    101
    Ziya1218 2022.06.12 11:19 

    O usuário não deixou nenhum comentário para sua avaliação

    Flavio Javier Jarabeck
    366675
    Resposta do desenvolvedor Flavio Javier Jarabeck 2022.06.12 14:09
    Sure! Please send me a message through Telegram at: @MinionsLabs ;)
    Responder ao comentário