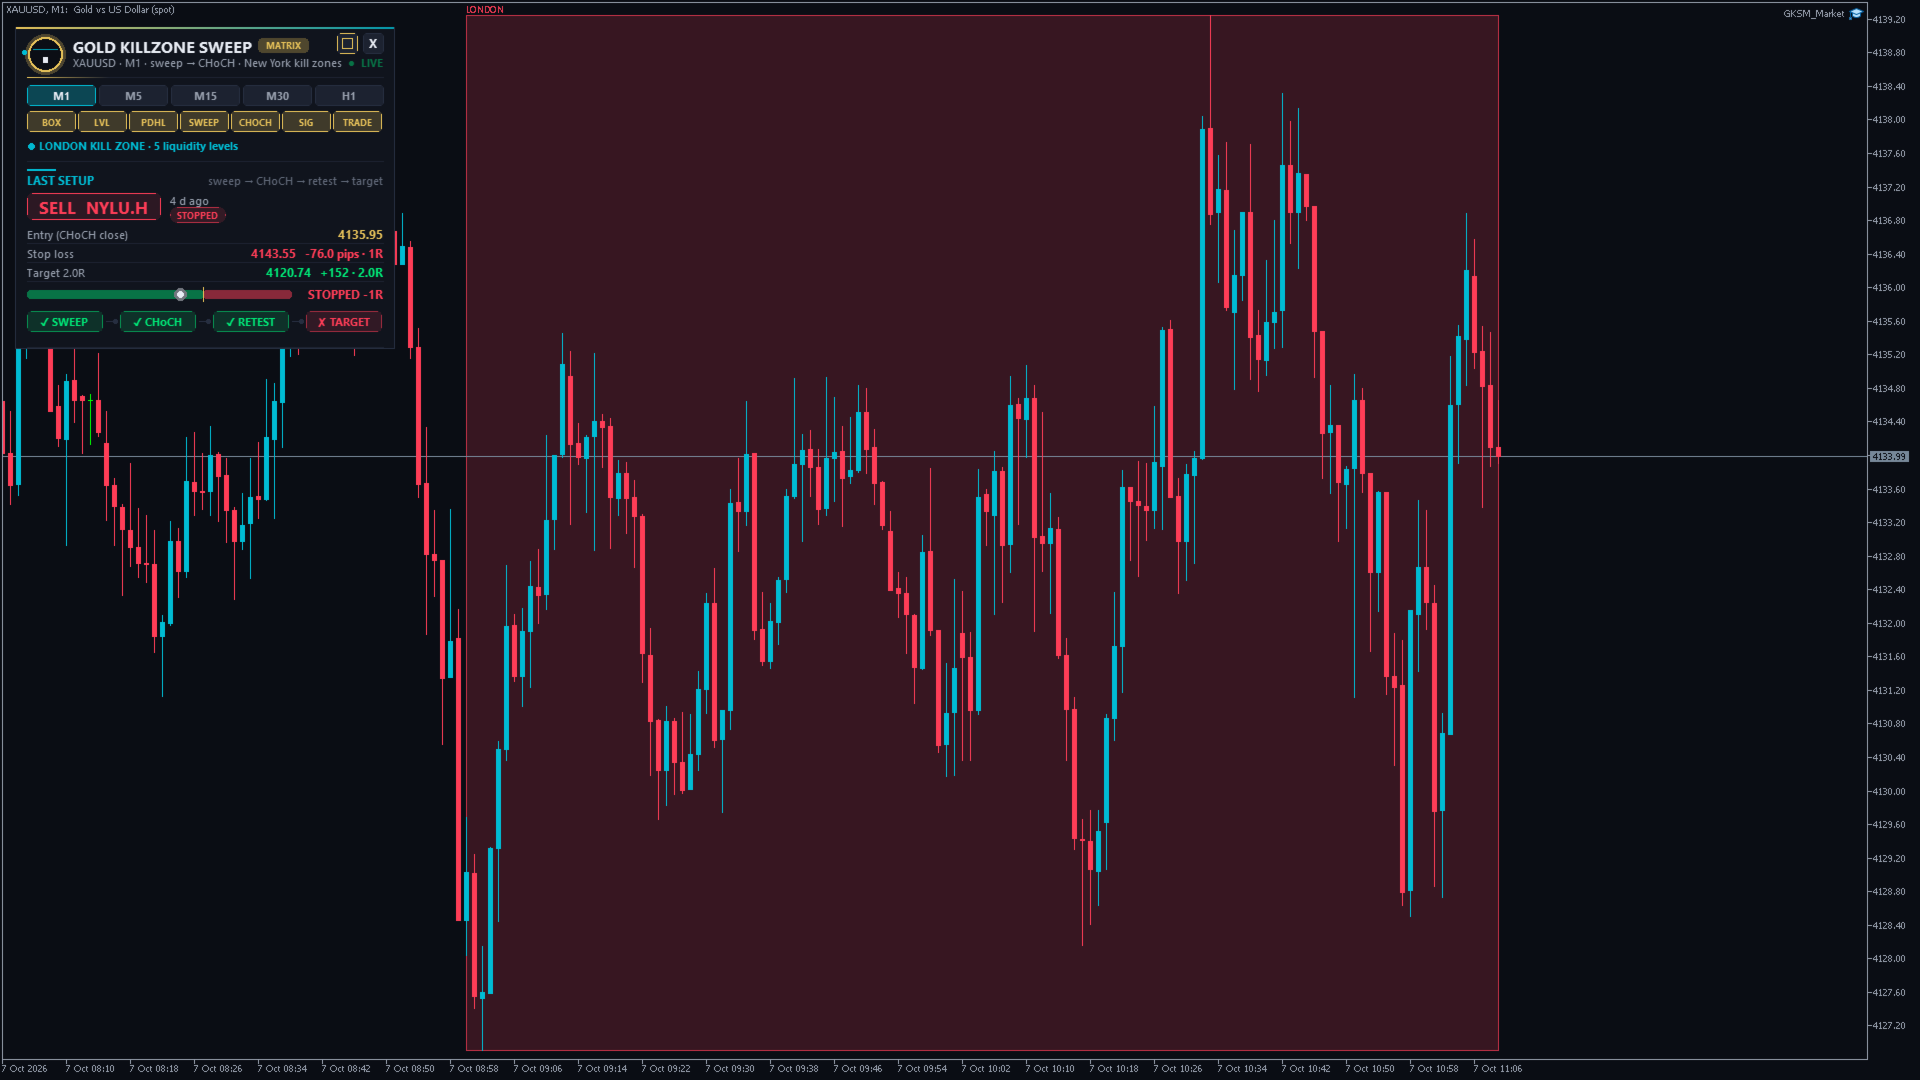
Gold Killzone Sweep Matrix
- Индикаторы
-
Kay Zaremba
 Trader and MQL4 / MQL5 / Pine Script developer behind trader.lifestyle.
YouTube: youtube.com/@traderlifestyle
What I do:
• Build free indicators and Expert Advisors for MT4, MT5
• Turn strategies from YouTube videos, TradingView scripts and forum posts into working code - Версия: 1.0
- Активации: 5
Gold Killzone Sweep Matrix trades the most famous ICT idea for gold. Every kill zone (Asia, London, New York) leaves a high and a low. Stop orders sit beyond them, and that is liquidity. Smart money takes this liquidity (the sweep) and then turns the market (the change of character, CHoCH).
Most kill zone indicators only draw the lines and leave the rest to you. This one does the whole job. It finds the sweep, confirms the CHoCH and prints a buy or sell arrow with entry, stop loss and target. Every past signal is tracked to its real result in the built-in trade journal.
| ✔ Never repaints | The indicator uses closed candles only. An arrow stays where it appeared, both live and in the Strategy Tester. |
| ✔ Complete trade plan | Each signal gives an entry, a stop beyond the sweep and a target at the opposing liquidity. |
| ✔ New York time, automatic | The indicator detects daylight saving and your broker's server offset by itself. You do not need to set anything. |
| ✔ Built for XAUUSD | The default settings come from a study on 17 months of gold M5 data, split into an in-sample and an out-of-sample period. |
■ The idea in 30 seconds
| 1. Liquidity | The high and the low of each kill zone. Stops of the shorts rest above the highs (buy-side liquidity, BSL). Stops of the longs rest below the lows (sell-side liquidity, SSL). |
| 2. Sweep | Price trades through one of these levels and triggers the stops. The level is marked ✕ swept, and a gold dot with ▲ / ▼ SWEEP appears. |
| 3. CHoCH | Shortly after the sweep, a candle closes through the last swing in the other direction. This shows the market has turned. |
| 4. Trade | The trade goes in the direction of the CHoCH. The stop goes behind the sweep and the target at the liquidity on the other side. |
Example: price takes the London low (SSL), then a candle closes above the last swing high. The result is a BUY signal, with the stop below the sweep low and the target at the next untouched high.
■ How to trade it, step by step
| Step 1 Chart | Open XAUUSD M5 and load the indicator. Keep the default settings. You do not need to set a time zone or GMT offset. |
| Step 2 Wait | You do not need to do anything until an alert comes. The Liquidity map in the dashboard shows the nearest untouched highs and lows. When a level is swept, the panel shows "LOND.L swept → BUY needs a close above 4128.40 · 5/24". That is the setup forming. Do not enter yet. |
| Step 3 Signal | When a candle closes through the swing, you get an arrow plus an alert with entry, stop and target. The signal only comes if the CHoCH forms inside the London, NY AM or NY PM kill zone and the CHoCH candle has real momentum (body of at least 0.5 × ATR). |
| Step 4 Entry | Default: enter at market right after the arrow appears. The entry price is the close of the CHoCH candle. If you prefer the retest entry from the classic ICT model, set Entry = Limit at the CHoCH level. You then get a limit price. The order is cancelled when it is not filled within 12 candles or when price reaches the target first. The panel shows the limit status. |
| Step 5 Stop loss | Use the stop from the signal. It sits beyond the most extreme price of the sweep plus a small ATR buffer. If the sweep extreme breaks, the idea is wrong. Never trade without the stop. |
| Step 6 Target | Use the target from the signal. It is the nearest untouched liquidity level on the other side that gives at least 1.5 R:R. The panel shows which one, for example Target NYAM.H. If no level is far enough away, the target is a fixed 2 R:R. |
| Step 7 Size | Risk the same small amount on every trade, for example 0.5–1 % of the account. The lot size follows from the stop distance: lots = money at risk / (stop distance in price × contract value per 1.00 price move). The panel shows the stop in pips and as 1R. |
| Step 8 Manage | Set and forget: the trade ends at the stop (-1R) or at the target (+R:R). The journal counts every signal exactly this way. The Active setup card shows the live R and the chain SWEEP → CHoCH → RETEST → TARGET. |
When to skip a signal:
- High-impact news within the next 30 minutes (NFP, CPI, FOMC). The spread widens and stops get hit without reason.
- The spread is unusually wide, for example around the daily close and rollover.
- You already hold a trade in the same direction. Each signal is independent, so keep your total risk in mind.
■ What you see on the chart
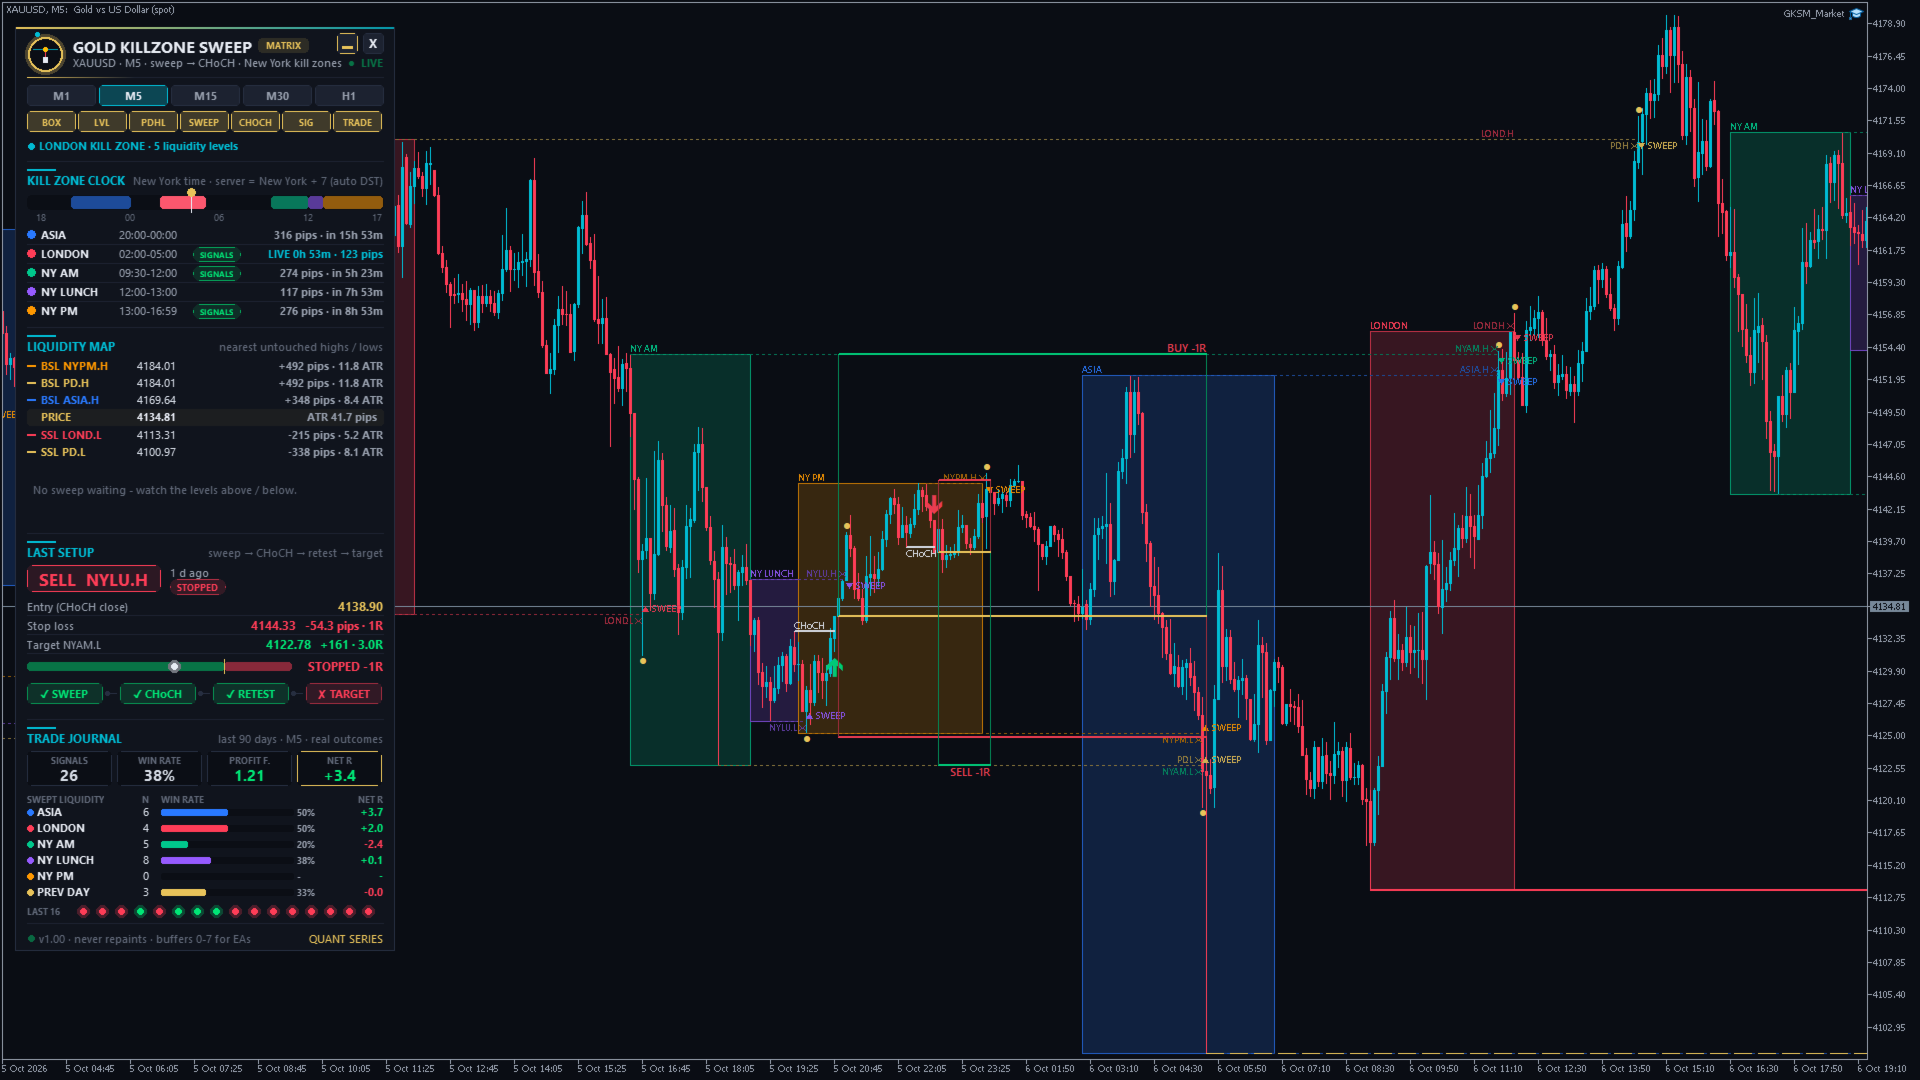
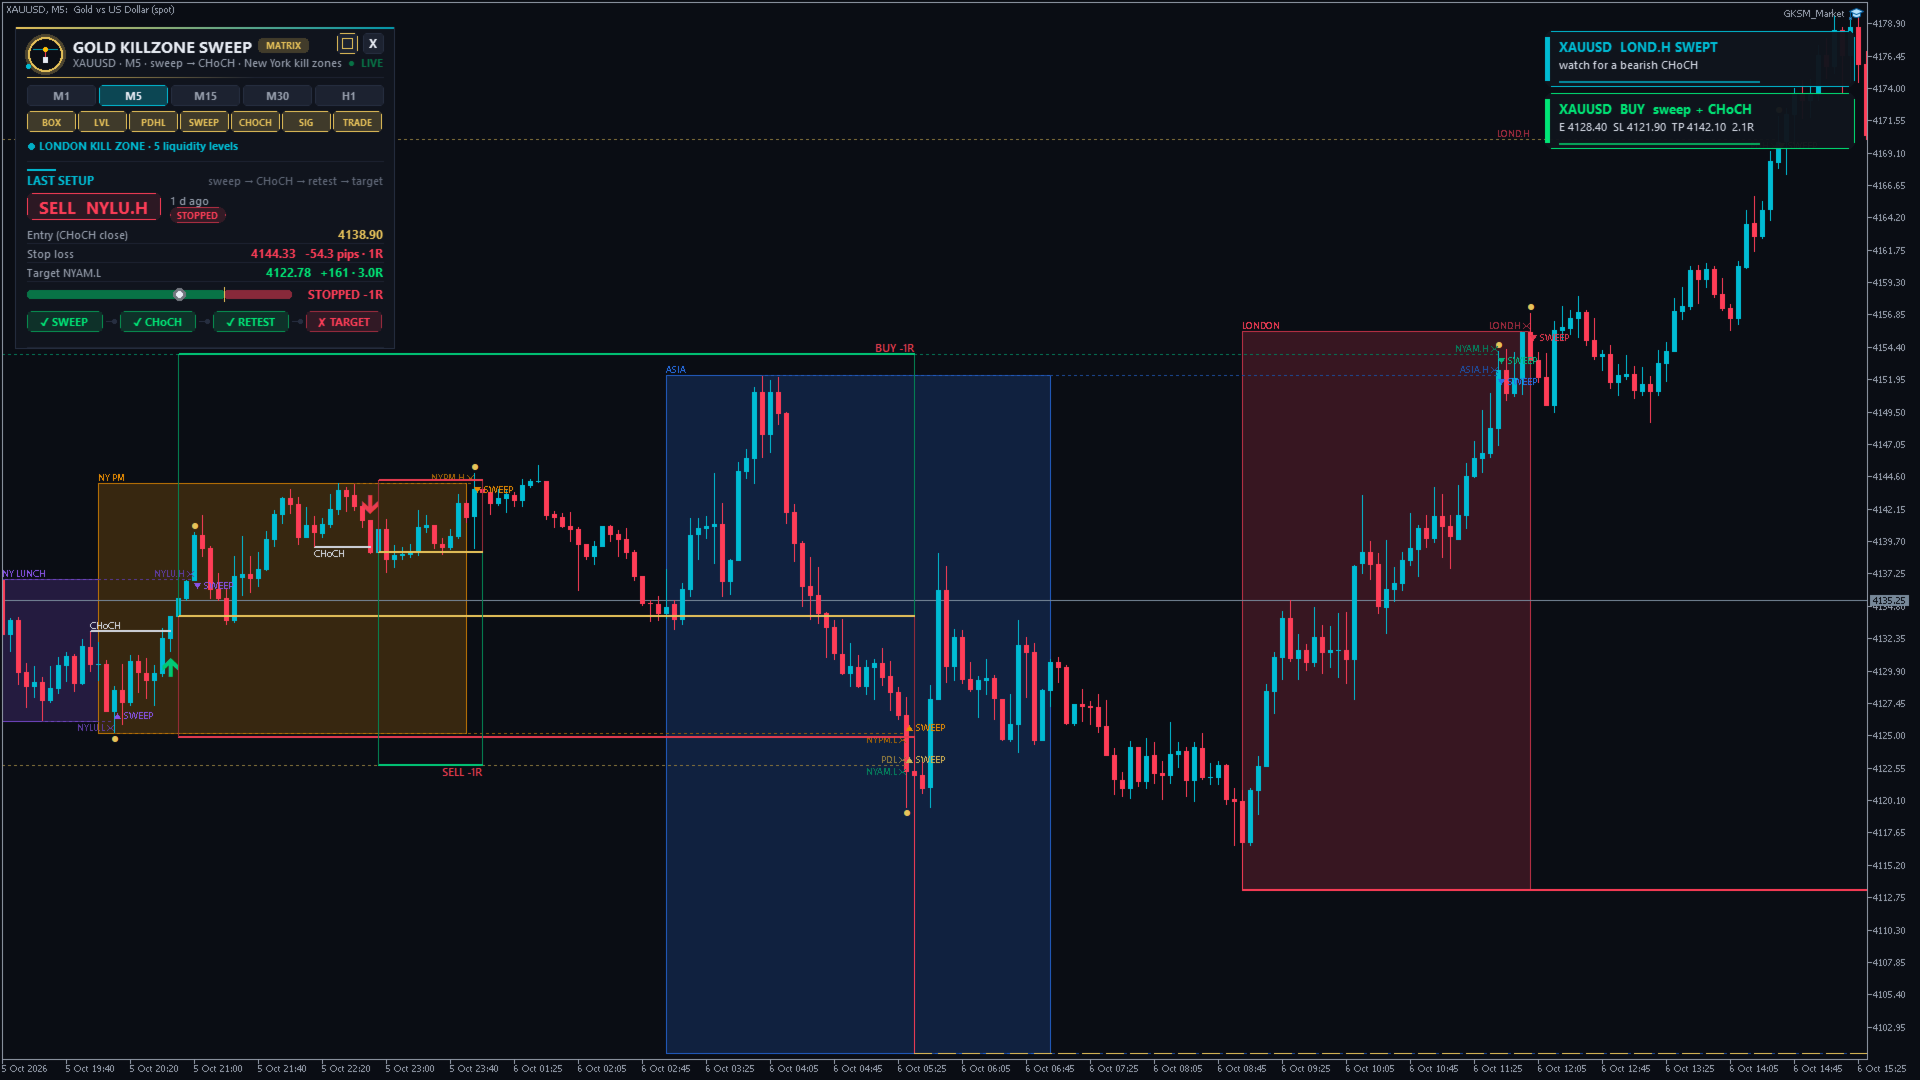
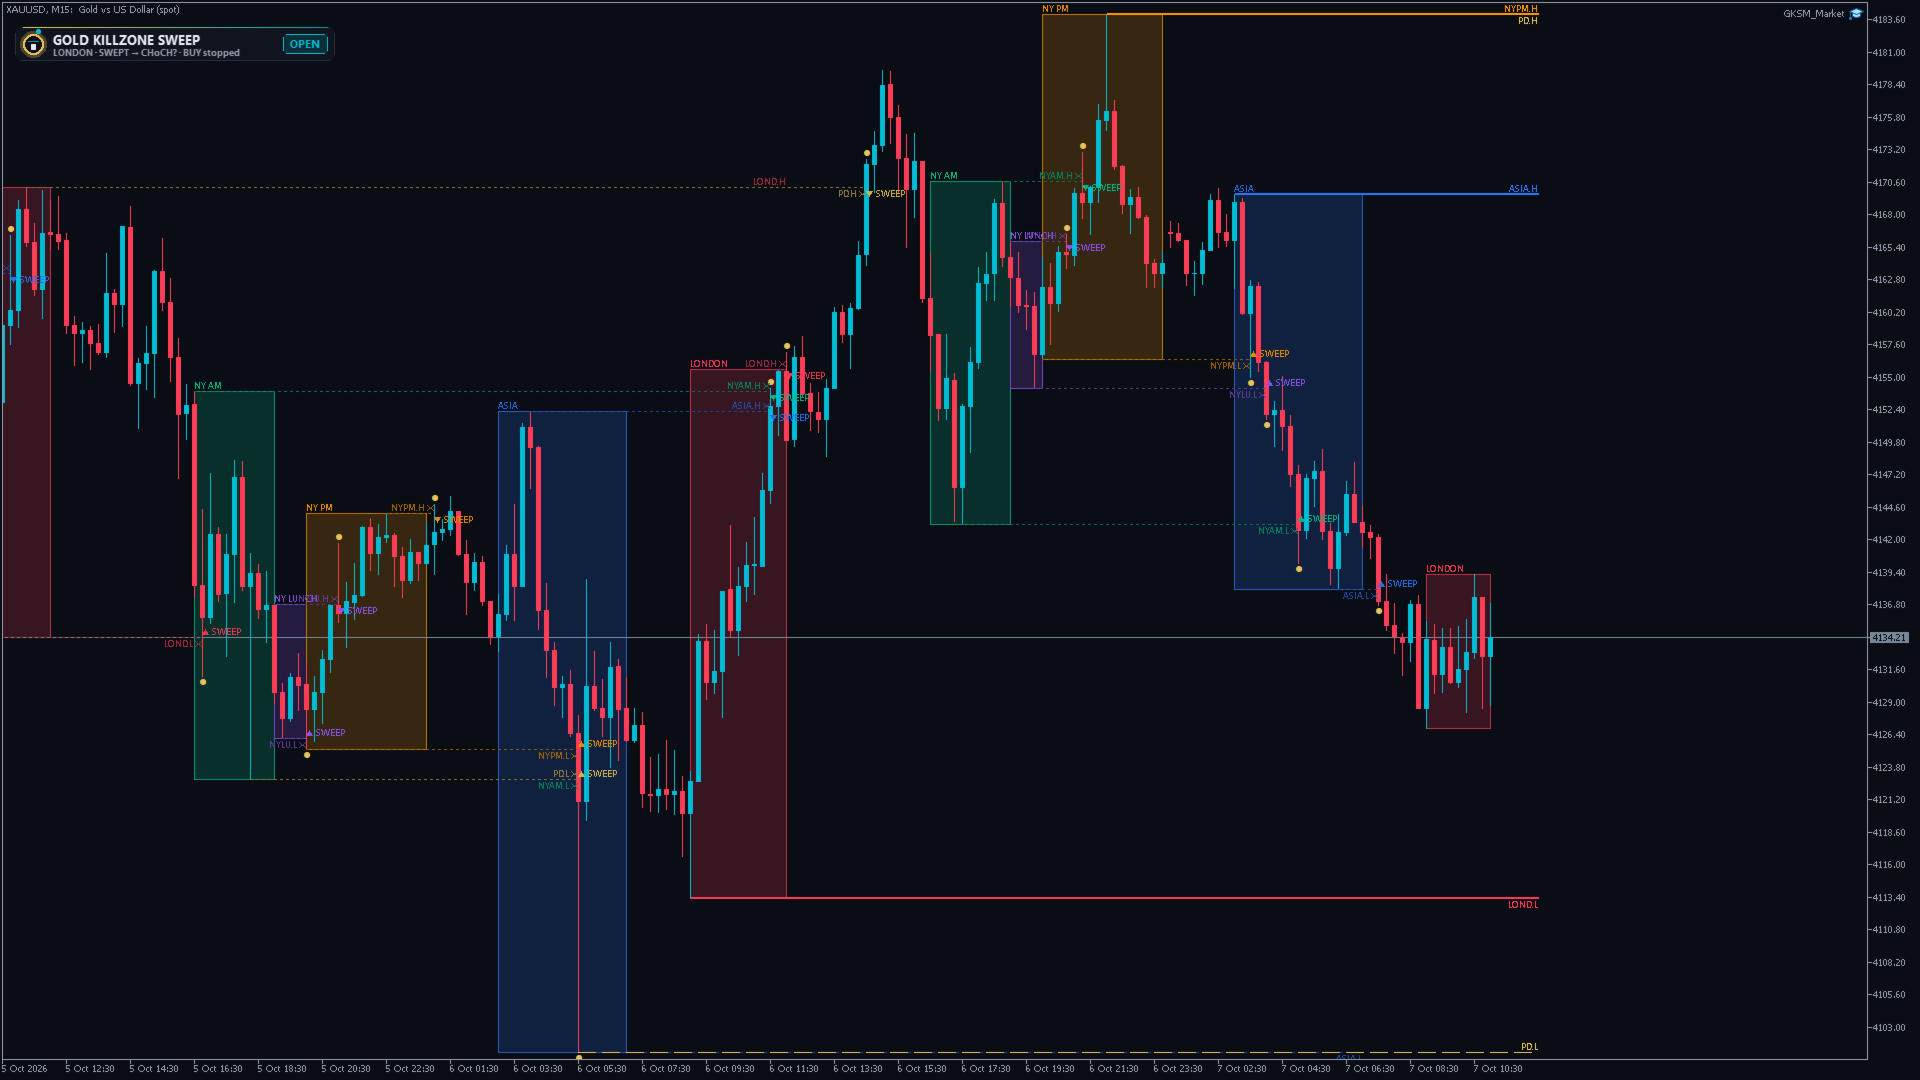
| Coloured boxes | The kill zones: Asia (blue), London (red), NY AM (green), NY Lunch (purple), NY PM (orange). Each box spans the high and low of its session. |
| Solid lines LOND.H, ASIA.L ... | Active liquidity, meaning untouched kill zone highs and lows. They extend to the right until price takes them. |
| Dotted line + ✕ | The level was swept, or a newer session of the same kill zone replaced it. |
| Dashed gold lines PD.H / PD.L | Previous day high and low, the largest pools of liquidity of the day. |
| Gold dot + SWEEP | The candle that took a level. |
| White line "CHoCH" | The swing that was broken, from the swing to the candle that closed through it. |
| ▲ / ▼ arrow | The signal, on the CHoCH candle. |
| Frame with gold, red and green lines | The trade: entry in gold, stop in red, target in green. The label at the end shows the result, for example BUY +2.1R ✔ or SELL -1R. |
■ The dashboard
- Kill zone clock: the 24-hour New York day with all kill zones and a live marker. It shows which kill zone is running, how much time is left, each session's range, and the start time of each kill zone in your server time.
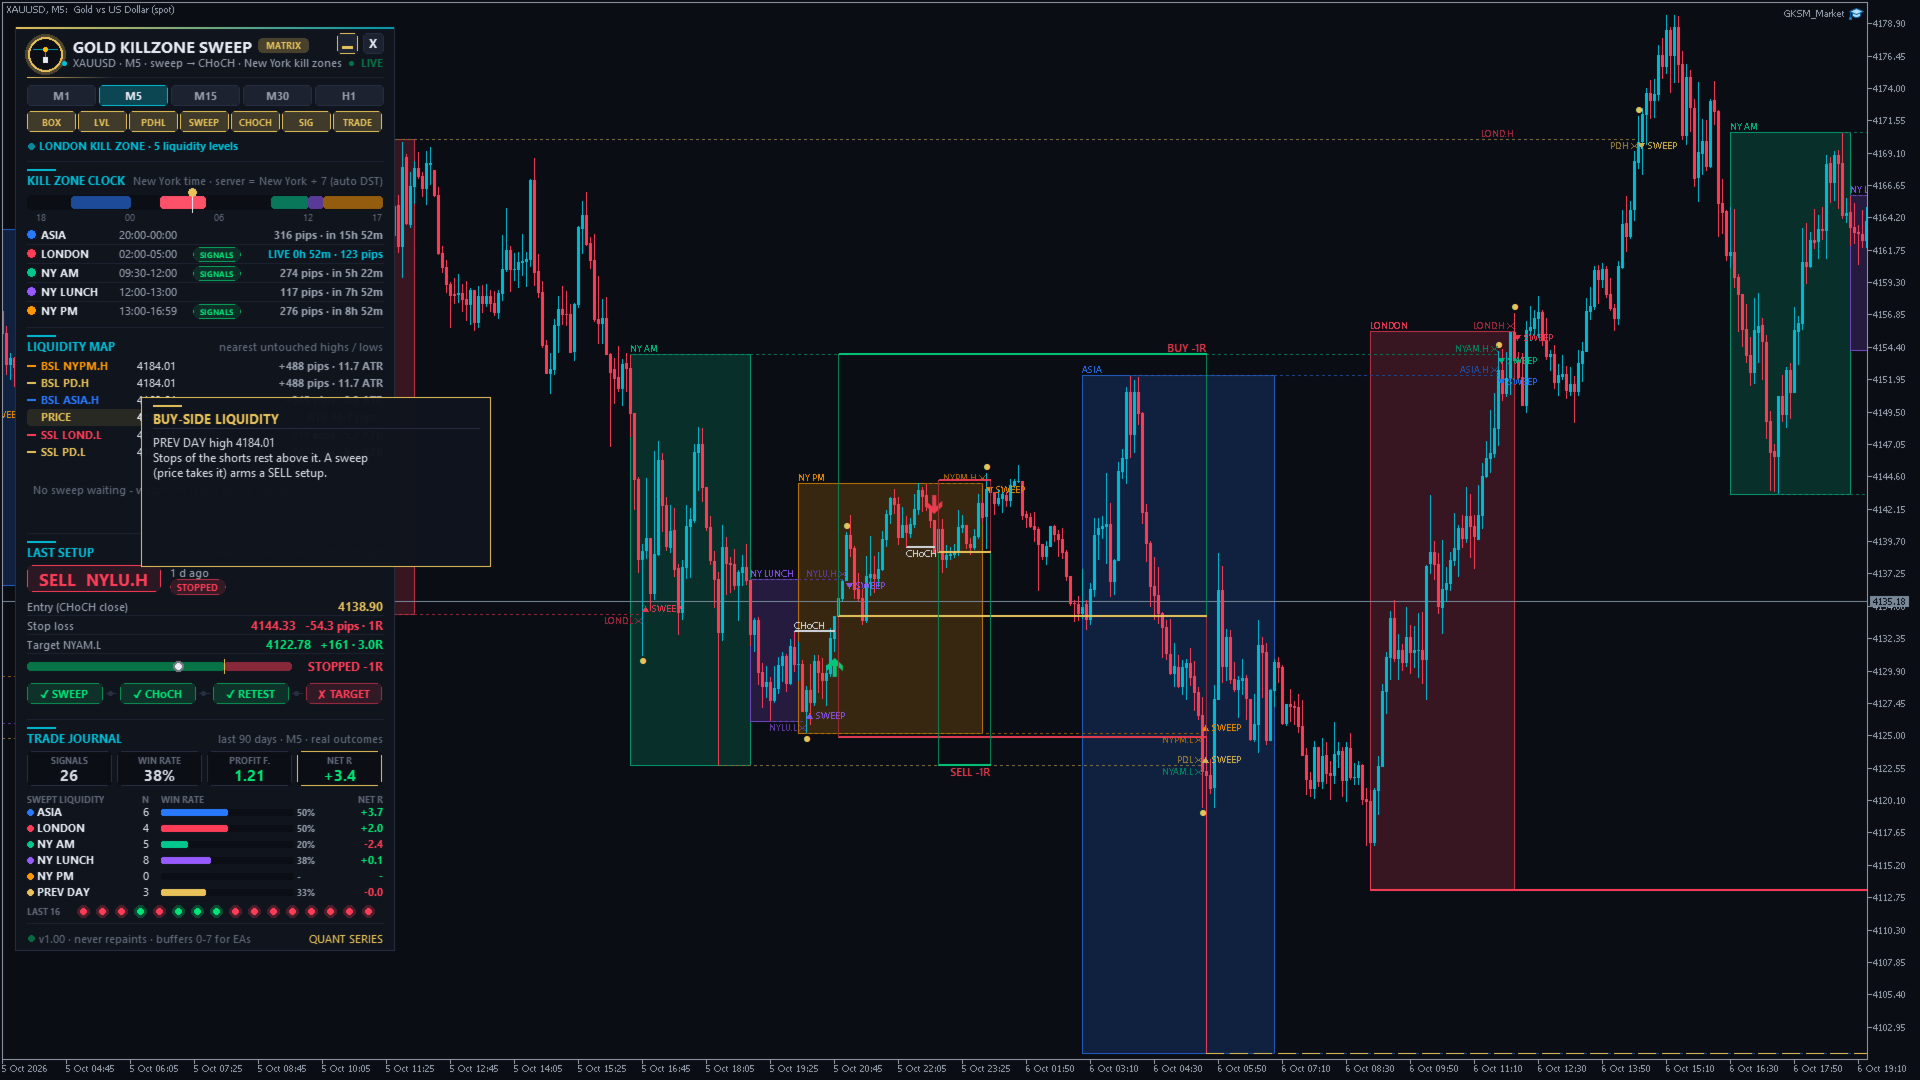
- Liquidity map: the 3 nearest untouched highs above and lows below, with the distance in pips and in ATR. It also shows every sweep that is waiting for its CHoCH, with the price that must break and the bars used.
- Active / last setup: direction, entry, stop, target, R:R, live result, a progress bar and the step chain.
- Trade journal: signals, win rate, profit factor and net R of the last 90 days, broken down by the kill zone that was swept, plus the last 16 results. These are real outcomes on your broker's data.
- Timeframe buttons, layer buttons (boxes, levels, previous day, sweeps, CHoCH, signals, trades), a compact mode and explanations on mouse over.
- Close the panel with X; it shrinks to a pill, and one click opens it again. Drag it anywhere. It moves away from other panels of the same series automatically.
■ Timeframes and symbols
| XAUUSD M5 | Recommended. The defaults were tuned here, and you get about 1–3 signals per week. |
| M1 | More signals but more noise and a higher spread share. This is for experienced scalpers. |
| M15 – H1 | Works, but there are fewer signals and wider stops. Use it mainly to see the liquidity picture. |
| H4 and above | Kill zones are intraday, so the indicator stays off and the panel asks you to switch. |
| Other symbols | Indices, forex and silver work the same way, but the defaults were made for gold. |
■ Main inputs
| Kill zones 1–5 | Name, time (New York time), colour, and whether signals are allowed inside each kill zone. By default, signals are allowed in London, NY AM and NY PM. |
| Which levels stay active | Either the most recent session of each kill zone (the classic view) or every unswept level of the last N days. |
| Sweep | Either any take of the level or a wick rejection only, where the candle closes back inside. |
| Swing length (5) | The size of the structure that the CHoCH must break. Smaller values give more but weaker signals. |
| Max. bars sweep → CHoCH (24) | A sweep that does not turn within this time is dropped. |
| Displacement (0.5 × ATR) | The minimum body of the CHoCH candle. Set it to 0 to switch the filter off. |
| Entry / stop / target | Market or retest entry, the stop buffer, the minimum R:R for the liquidity target, the fixed R:R, and the minimum and maximum stop size in ATR. |
| History (90 days) | The period used for the signals and the journal. |
■ Alerts
The indicator can alert on a new signal, a filled retest entry, a target or stop hit, a swept level, and a kill zone opening. Each alert can go out as a popup, sound, push notification to your phone, e-mail or on-chart toast. Every alert includes the entry, stop and target, so you can trade from your phone.
■ Time zone and broker
All kill zones are in New York time and the US daylight saving switch is handled automatically. The broker offset is detected when the terminal connects. Brokers on New York + 7 (GMT+2/+3) work immediately. For any other broker you can enter the GMT offset under Server GMT offset. The panel shows the detected offset and the start of each kill zone in your server time.
■ For Expert Advisors (iCustom)
Buffer 0 buy arrow, 1 sell arrow, 2 buy-side sweep, 3 sell-side sweep, 4 signal (+1 buy / -1 sell), 5 entry, 6 stop loss, 7 target. The values are written on the closed signal candle and never change. Read shift 1 on each new bar.
■ FAQ
| Why is there no signal today? | A signal needs a sweep, then a CHoCH with momentum, inside a signal kill zone, within 24 bars. Many days have none. That is the filter doing its job. The liquidity map shows whether a setup is forming. |
| The arrow came after the move started. Is it late? | The CHoCH is only confirmed when the candle has closed, and that is why the indicator never repaints. If you prefer a better price, use the retest entry. |
| Does it repaint? | No. Closed candles only, from a fixed start. Run it in the visual Strategy Tester and compare: the arrows stay where they appeared. |
| The kill zone boxes are at the wrong time. | Your broker does not use New York + 7. Enter its GMT offset in Server GMT offset, for example 0 or 3. |
| Stop and target were hit in the same candle. What counts? | The stop. The journal is strict on purpose. |
| Why does the journal differ from another broker? | Each broker has slightly different prices and candles, so a level can be swept on one feed and missed on another. |
| Does it open trades? | No. It is a decision tool. To automate it, read the buffers from your EA. |
Trading involves risk. Past results in the journal or in any study do not guarantee future results. Always use a stop loss and risk only money you can afford to lose.