TrendReversalProbability

Trend Reversal Probability

Overview

Trend Reversal Probability is an analytical indicator for MetaTrader 5. It does not open, close or manage trades. Its purpose is to describe one specific property of the market in numbers: how long the current directional state of a smoothed momentum oscillator has already lasted, and how unusual that duration is compared with the same measurement on previous occasions.
The indicator runs in a separate window. On every bar it updates the duration of the current state, the average and standard deviation of all completed state durations available on the chart, and an empirical percentile value for the current duration.

What the indicator measures

The calculation chain is based on the median price of each bar, that is the average of the high and the low.
  1. Two simple moving averages of the median price are calculated, a fast one over 5 bars and a slow one over 34 bars. Their difference forms a momentum oscillator.
  2. The bar-to-bar change of that oscillator is separated into its rising and falling parts. Both parts are smoothed with a Wilder style moving average over the period set in the input parameters.
  3. The smoothed values are converted into a single centred value that moves roughly between -50 and +50. The zero line of that centred value is the reference point.
  4. Crossing the zero line upwards or downwards starts a new state. The indicator counts the number of bars elapsed since the last crossing, and calls this the signal duration.
  5. Every time a state ends, its final duration is added to a running statistic. From all completed durations the indicator keeps the mean and the standard deviation, which are plotted as the average duration line and the deviation levels.
  6. The current duration is compared with that distribution. The result is an empirical percentile displayed as a percentage in the upper left corner of the indicator window.
The result is a statistical description of the past and the present. It is not a forecast of price, and it does not state that a reversal will happen. A high percentile only means that the current state has lasted longer than most of the comparable states seen earlier on the same chart and settings.

Chart elements

The indicator draws the following elements in its own subwindow.
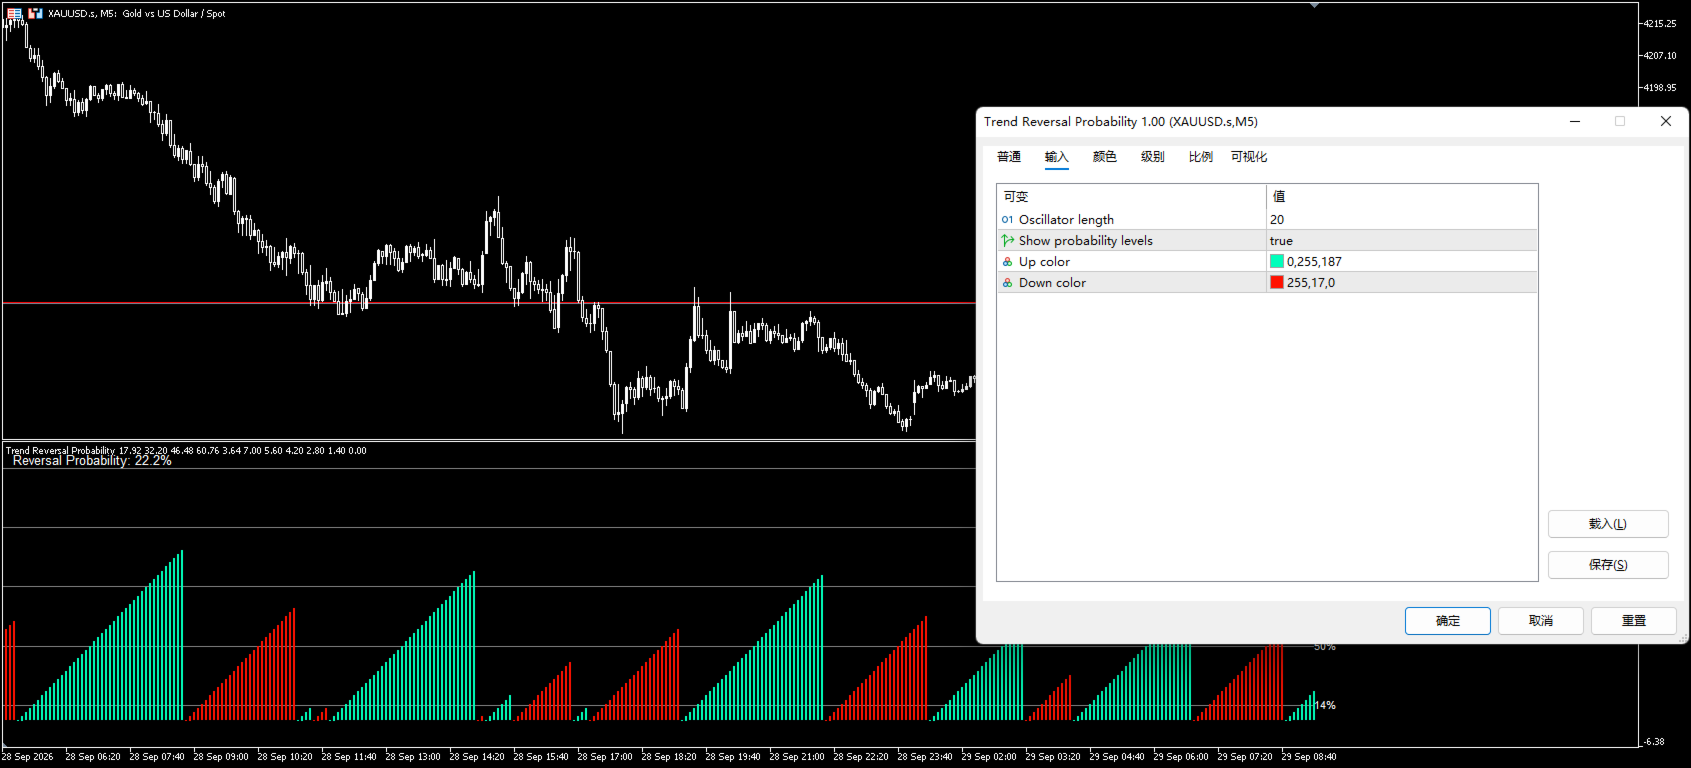
  • Average Duration​ - the mean of all completed state durations.
  • Upper 1 SD, Upper 2 SD, Upper 3 SD​ - the average duration plus one, two and three standard deviations.
  • Lower 1 SD​ - the average duration minus one standard deviation.
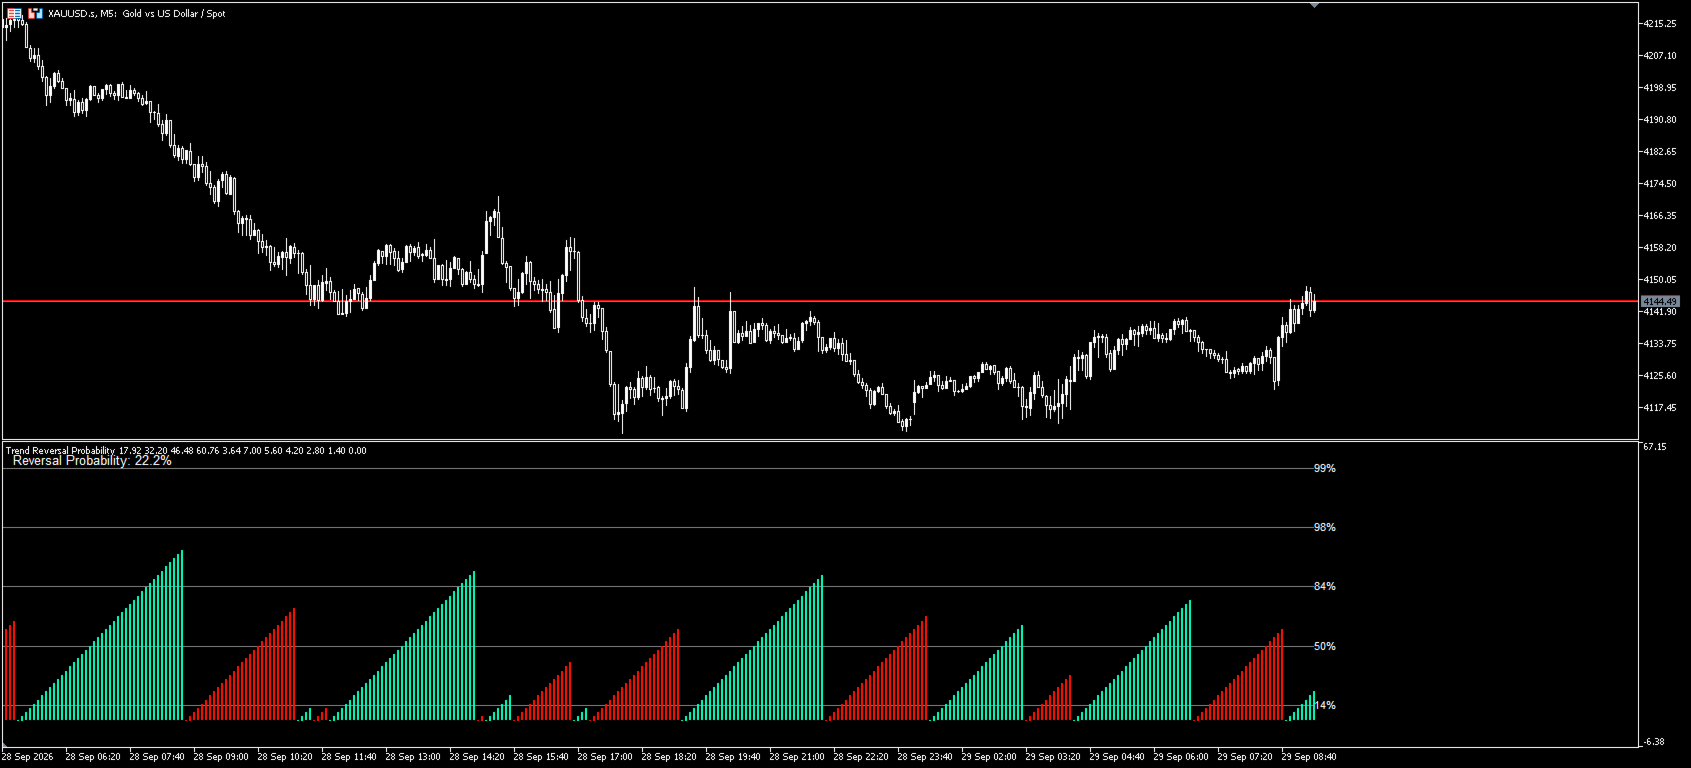
  • Signal Duration​ - a histogram of the number of bars since the last zero line crossing. The bar is painted with the up colour while the centred value is above zero and with the down colour while it is below zero.
  • Signal Duration 80%, 60%, 40%, 20%​ - four additional histograms showing the same duration value scaled to 80, 60, 40 and 20 percent. They are provided for visual presentation and make the height of the current state easier to read against the levels.
  • Extreme Reversal Probability​ - an orange arrow placed above the histogram when the current duration exceeds the average duration plus three standard deviations.
Text labels showing 14%, 50%, 84%, 98% and 99% can be displayed at the average duration and at the deviation levels. These labels mark the positions of the average duration and of one, two and three standard deviations above it, with the 14% label placed one standard deviation below the average.
A label in the upper left corner of the subwindow shows the current percentile value, for example Reversal Probability: 87.4%.

Alerts

The indicator can send standard terminal alerts when the following conditions are met on a closed or closing bar.
  • The percentile value rises above 84%.
  • The percentile value rises above 98%.
  • The percentile value falls below 14%.
  • The duration counter returns to zero, which means a new state has started.
The alerts use the standard terminal alert function. They can be silenced in the terminal options if they are not needed.

Input parameters

Parameter
Default
Description
Oscillator length
20
Period of the Wilder style smoothing applied to the rising and falling parts of the oscillator change. Higher values produce a slower centred value and longer states.
Show probability levels
true
Enables or disables the text labels at the average duration and deviation levels.
Up color
0,255,187
Colour used for the histograms while the centred value is above zero.
Down color
255,17,0
Colour used for the histograms while the centred value is below zero.
The fast and slow moving average periods, 5 and 34, and the window used for the duration volatility, 100 bars, are fixed in this version and are not exposed as inputs.

How to use it

The indicator is intended as a context tool that is read alongside a trading method, not as a standalone source of entries.
  • Loading​ - attach the indicator to any symbol and any timeframe. It appears in a separate window below the price chart.
  • Reading the histogram​ - the height of the Signal Duration histogram shows how many bars the current directional state has lasted. The colour shows the direction of the state according to the centred value.
  • Reading the levels​ - the grey lines show what has been a typical duration on this symbol and timeframe. A histogram that stays below the average duration line is still inside the usual range. A histogram approaching or exceeding the second and third deviation levels is in a range that has been rare in the loaded history.
  • Reading the percentile​ - the value in the subwindow summarises the same information as a single number between 0 and 100.
  • Practical applications​ - the value can be used to review how long a move has already been running, to plan where attention to an open position may be increased, to compare the behaviour of several symbols or timeframes, or to study how state durations behave on a chosen instrument.
  • Reset behaviour​ - when the centred value crosses the zero line, the duration counter starts again from zero. The percentile falls back accordingly and the reset alert can be raised.
Because the statistic is built from completed states found on the loaded history, the number of bars available on the chart matters. A longer history provides more completed states and a more stable average duration.

Requirements and limitations

  • MetaTrader 5 build with support for separate window indicators.
  • At least 56 bars are required before any calculation starts, and noticeably more before the average duration, the deviation levels and the percentile become available. The left part of the chart can therefore stay empty.
  • Values on the forming bar are recalculated on every tick and can change until the bar closes.
  • The indicator does not use DLL calls and does not perform any trading operations.
  • It can be used on any symbol and any timeframe provided by the terminal.
  • The indicator does not place objects on the price chart. All objects are drawn inside its own subwindow and are removed when the indicator is removed.

Notes on risk

Trading financial markets involves substantial risk. This indicator is an analytical tool. It describes statistical properties of past state durations and does not predict future price movement, does not guarantee that any reversal will occur, and does not provide investment advice or trading signals that can be followed mechanically. Any decision based on the values shown by this indicator remains the full responsibility of the user.

Support

Questions, comments and requests are handled through the product comments section and the built-in MQL5.com messaging system.
It will switch to a subscription service after exceeding 100 downloads.
Рекомендуем также
MACD Enhanced
Nikita Berdnikov
4 (4)
Представляем   MACD  Enhanced  – усовершенствованный индикатор MACD (Moving Average Convergence Divergence), который предоставляет трейдерам расширенные возможности для анализа тренда и момента на финансовых рынках. Индикатор использует разницу между быстрой и медленной экспоненциальными скользящими средними для определения импульса, направления и силы тренда, создавая четкие визуальные сигналы для потенциальных точек входа и выхода. Внимание!   Для достижения наилучших результатов рекомендуется
FREE
Общее описание Этот индикатор — усовершенствованная версия классического канала Дончия с добавлением практических функций для реальной торговли. Помимо стандартных трёх линий (верхняя, нижняя и средняя), система определяет пробои и отображает их на графике стрелками, показывая только линию, противоположную текущему направлению тренда для более чистого восприятия. Индикатор включает: Визуальные сигналы : цветные стрелки при пробое Автоматические уведомления : всплывающие окна, push и email Фильтр
FREE
Follow The Line MT5
Oliver Gideon Amofa Appiah
4.6 (35)
This indicator obeys the popular maxim that: "THE TREND IS YOUR FRIEND" It paints a GREEN line for BUY and also paints a RED line for SELL. (you can change the colors). It gives alarms and alerts of all kinds. IT DOES NOT REPAINT and can be used for all currency pairs and timeframes. Yes, as easy and simple as that. Even a newbie can use it to make great and reliable trades. NB: For best results, get my other premium indicators for more powerful and reliable signals. Get them here: https://www.m
FREE
JT360 DNA Mini PnL Pointer V1.04 Public Компактно. Наглядно. Всегда перед глазами. JT360 DNA Mini PnL Pointer — это лёгкий индикатор для MetaTrader 5, который отображает суммарную текущую прибыль или убыток по всем открытым позициям текущего символа графика. Компактная индикация непосредственно на графике объединяет PnL относительно первоначального риска в формате R, тонкую мини-полоску и настраиваемую цветовую матрицу. Фирменные цвета JT360 — бирюзовый и пурпурный — выделяют крайние значения и
FREE
Indicator Description 4 Hull MA Color + Envelopes is a powerful trend-following indicator for MetaTrader 5 that combines four Hull Moving Averages (HMA) with Moving Average Envelopes to clearly identify market direction, trend strength, and potential reversal or pullback zones. This indicator is designed to reduce noise, react quickly to price movement, and provide a clean visual structure for professional trading.   Key Features   4 Hull Moving Averages (20, 50, 100, 200) Automatic color change
FREE
Free automatic Fibonacci is an indicator that automatically plots a Fibonacci retracement based on the number of bars you select on the BarsToScan setting in the indicator. The Fibonacci is automatically updated in real time as new highest and lowest values appears amongst the selected bars. You can select which level values to be displayed in the indicator settings. You can also select the color of the levels thus enabling the trader to be able to attach the indicator several times with differe
FREE
Are you tired of drawing trendlines every time you're analyzing charts? Or perhaps you would like more consistency in your technical analysis. Then this is for you. This indicator will draw trend lines automatically when dropped on a chart. How it works Works similar to standard deviation channel found on mt4 and mt5. It has 2 parameters: 1. Starting Bar 2. Number of bars for calculation The   starting bar   is the bar which drawing of the trend lines will begin, while the   number of bars for c
FREE
Rainbow MT5
Jamal El Alama
4 (1)
Description : Rainbow MT5 is a technical indicator based on Moving Average with period 34 and very easy to use. When price crosses above MA and MA changes color to green, then this is a signal to buy. When price crosses below MA and MA changes color to red, then this is a signal to sell. The Expert advisor ( Rainbow EA MT5 ) based on Rainbow MT5 indicator is now available here . MT4 version is available here .
FREE
PZ Penta O MT5
PZ TRADING SLU
3.8 (5)
The Penta-O is a 6-point retracement harmonacci pattern which usually precedes big market movements. Penta-O patterns can expand and repaint quite a bit. To make things easier this indicator implements a twist: it waits for a donchian breakout in the right direction before signaling the trade. The end result is an otherwise repainting indicator with a very reliable trading signal. The donchian breakout period is entered as an input. [ Installation Guide | Update Guide | Troubleshooting | FAQ | A
FREE
PROMETHEUS TECHNICAN VERSION Free | By THE SONS A gift from The Sons — no strings, no trial, no expiry. Every trader deserves access to professional-grade market intelligence. That belief is why Prometheus Technical Version exists, and why it costs nothing. Consider it our handshake to the trading community. What You're Getting This is not a simplified tool dressed up as a gift. Prometheus Technican Version is a fully built, institutional-quality technical analysis indicator running a dual-model
FREE
RSI abcd
Francisco Gomes Da Silva
3.75 (4)
RSI ABCD Pattern Finder: Technical Strategy 1. How the Indicator Works Combines the classic RSI with automatic detection of ABCD harmonic patterns . Key Components Standard RSI (adjustable period) Peak and Trough Markers (arrows) ABCD Patterns (green/red lines) Overbought (70) and Oversold (30) Filters 2. MT5 Setup period = 14 ; // RSI period size = 4 ; // Maximum pattern size OverBought = 70 ; // Overbought level OverSold = 30 ; // Oversold level Filter = USE_FILTER_ YES ; // Confirmation filte
FREE
Donchian Channel is an indicator created by Richard Donchian. It is formed by taking the highest high and the lowest low of the last specified period in candles. The area between high and low is the channel for the chosen period. Its configuration is simple. It is possible to have the average between the upper and lower lines, plus you have alerts when price hits one side. If you have any questions or find any bugs, please contact me. Enjoy!
FREE
Important Lines
Terence Gronowski
4.88 (24)
Индикатор отображает линии пивот, уровни максимума, минимума и закрытия предыдущего дня, а также минимум и максимум предыдущего часа. Нужно просто установить этот индикатор на график, чтобы отобразить все эти важные линии, нет необходимости настраивать множество отдельных индикаторов. Почему важны определенные линии Максимум и минимум предыдущего дня : эти уровни используются для торговли на дневном графике. Очень часто, если цена становится выше или ниже минимума/максимума предыдущего дня, про
FREE
Easy Correlations Indicator The Easy Correlations Indicator is designed to help traders analyze the relationship between two correlated instruments. By monitoring the distance between their Relative Strength Index (RSI) values, the indicator highlights situations where one instrument has moved significantly further than the other. This creates potential trading opportunities: Sell the stronger instrument (overstretched RSI) Buy the weaker instrument (lagging RSI) Because the positions are opened
FREE
Мультитаймфреймовый трендовый индикатор, на основе индикатора ADX / ADXWilder c уровнями Фибоначчи Индикатор показывает трендовые участки, используя данные индикатора ADX или ADXWilder с нескольких таймфреймов. Импульсный режим индикатора позволяет поймать начало тренда, а несколько "Экранов" с разными таймфреймами позволяют отфильтровать рыночный шум. На график цены добавляются уровни Фибоначчи, которые имеют гибкие настройки. Принцип работы индикатора: если PDI больше NDI, то устанавливается
FREE
Blame The Box is a lightweight session range and breakout analysis indicator engineered specifically for MetaTrader 5. Built to support and enhance your personal trading strategy, it automatically identifies custom intraday consolidation ranges, maps out dynamic breakout levels, and displays real-time position sizing directly on your chart. Important Note: Blame The Box is an analytical and risk-calculation tool designed to assist your own technical analysis and discretionary trading strategy.
FREE
This indicator is especially for the binary trading. Time frame is 1 minutes and exp time 5 or 3 minutes only. You must be use martingale 3 step. So you must put lots size is 10 % at most. You should use Mt2 trading platform to connect with my indicator to get more signal without human working. This indicator wining rate is over 80% but you may get 100% of profit by using martingale 3 step. You should use MT2 Trading Platform to connect meta trader platform and binary platform . You can get mt2
FREE
# DAILY SUPPORT AND RESISTANCE LEVELS - SEO OPTIMIZED DESCRIPTION ## SHORT DESCRIPTION (160 characters max) ``` Free pivot points indicator with daily support resistance levels for MT5. Perfect for intraday forex day trading and scalping strategies. ``` **Character count:** 159 **Keywords included:** pivot points, support, resistance, MT5, forex, day trading, scalping, free --- ## FULL DESCRIPTION (HTML Formatted for MQL5) ### Main Title **Daily Support and Resistance Levels - Free Pivot
FREE
Daily Entry M1 – Индикатор MT5 Daily Entry M1 — это индикатор MetaTrader 5, созданный для трейдеров, которые сосредоточены на краткосрочных внутридневных торговых возможностях на таймфрейме M1. Индикатор анализирует рыночные условия и отображает четкие стрелки BUY и SELL непосредственно на графике, когда подтверждаются его внутренние условия входа. Индикатор предназначен для поиска потенциальных зон разворота рынка и пытается определять точки входа вблизи внутридневной вершины или основания, по
FREE
MACD, который разворачивается, пока движение ещё стоит того, чтобы его брать. Schaff Trend Cycle MTF прогоняет MACD через два стохастических прохода, что сжимает его в цикл от нуля до ста с резкими ранними разворотами вместо медленного сползания обычного MACD, и срабатывает на развороте из зоны, а не на пересечении. Любой старший таймфрейм на любом графике, только закрытые старшие бары. Продукт бесплатный: без пробного периода, без закрытых функций, без страницы апгрейда. MACD, построенный на бы
FREE
Fabii Metro Step RSI
Fabien Georges Andre Guillemaud
Хватит входить на колебаниях импульса, которые разворачиваются через одну свечу. Две ступенчатые линии, один график. No repaint. Любая пара, любой timeframe. На графике за 2 минуты. Бесплатный тест в Strategy Tester. Get more indicators here Baselines, volatility filters and oscillators. No repaint. Зачем это нужно Вы видите разворот Relative Strength Index (RSI) и входите. Через несколько свечей он разворачивается обратно: сигнал был шумом. RSI двигается с каждой свечой, поэтому небольшое ко
FREE
TrendVision AI
Murtadha Majid Jeyad Al-Khuzaie
TrendVision AI – Smart Trend Channels & Price Forecasting for MetaTrader 5 Discover market structure and explore potential future price direction with TrendVision AI, an advanced technical indicator for MetaTrader 5 that combines automatic trendline analysis with a machine-learning-based price forecasting model. How Does TrendVision AI Work? TrendVision AI analyzes historical candlestick data within a configurable lookback window. It automatically draws two trendlines directly on the chart:
FREE
This indicator consist of Standard BBMA Standard signal Sign on chart added EMA50 Behavior Tracking: The chart background changes color based on the EMA50 (default is black) and shifts to white when a breakout of the Bollinger Bands occurs. Three Engulfing Color Change: Automatically adjusts colors to help you easily determine market zones. default yellow/white High-Low Line Sign: Highlights the potential trading range and key price levels for better visual  MHV
FREE
Intraday Spark Chart Overview Intraday Spark Chart is an MT5 indicator for intraday analysis. It converts the current price change of a symbol into a percentage of the daily opening price and plots the result in a separate subwindow. Every trading day starts again from the zero line, so each day is drawn as a separate segment and the intraday move of the current day can be observed directly. The indicator is a data visualization tool. It does not generate trading signals and does not provide inv
FREE
Goldcrest Indicator — Free Gold Trading Signals for MetaTrader 5 Engineered for Gold. Built for Precision. Goldcrest Indicator is a free, powerful, and easy-to-use MetaTrader 5 indicator designed to help traders identify potential trading opportunities in the gold market (XAUUSD). Built using the proprietary Goldcrest signal-detection framework, the indicator monitors market conditions and displays clear BUY and SELL signals with entry prices and initial SL references directly on your chart , he
FREE
Coral trend is   a trend-following indicator that is widely popular among FOREX traders . It is usually used as a confluence with other indicators. It uses combinations of moving averages with complex smoothing formulas! It has two configurable parameters: Coefficient   - smoothing ratio (*) Applied price Calculation: Coral = (-0.064) * B6 + 0.672 * B5 - 2.352 * B4 + 2.744 * B3
FREE
Girassol Sunflower MT5 Indicator
Saullo De Oliveira Pacheco
3.86 (7)
This is the famous Sunflower indicator for Metatrader5. This indicator marks possible tops and bottoms on price charts. The indicator identifies tops and bottoms in the asset's price history, keep in mind that the current sunflower of the last candle repaints, as it is not possible to identify a top until the market reverses and it is also not possible to identify a bottom without the market stop falling and start rising. If you are looking for a professional programmer for Metatrader5, please
FREE
Northstar Flow Candles MT5 is a free chart indicator for traders who use Heikin Ashi candles to review trend context. Its purpose is visual analysis, with candle states and optional markers on the MetaTrader 5 chart. This is a visual tool. It does not place trades or provide popup, push or email notifications. Chart context Five candle states: strong bullish, bullish, balanced, bearish and strong bearish. Context settings based on fast and slow exponential moving averages, ADX and ATR-normalize
FREE
Blahtech VWAP - Volume Weighted Average Price (VWAP) is the ratio of price to total volume. It provides an average price over a specified time interval.  Links [  Install  |  Update  |  Documentation   ] Feature Highlights Configurable VWAP Line Sessions, intervals, anchored or continuous Previous day settlement line Standard Deviation bands Alerts at bar close or real time Automatic Broker or Tick volumes Significantly reduced CPU usage Input Parameters Expert Advisor Mode  - Reserved for iCu
FREE
CosmiCLab SMC FIBO CosmiCLab SMC FIBO — это профессиональный торговый индикатор, основанный на концепциях Smart Money Concepts (SMC), анализе структуры рынка и уровнях Fibonacci. Индикатор автоматически определяет свинги рынка и строит уровни Fibonacci по последнему импульсному движению. Также индикатор определяет ключевые изменения структуры рынка: BOS — Break Of Structure CHOCH — Change Of Character Дополнительно отображаются сигнальные стрелки BUY / SELL при пробое структуры. Индикатор подход
С этим продуктом покупают
Trend Sniper X
Sarvarbek Abduvoxobov
4.86 (44)
Trend Sniper X — это трендовый индикатор для MetaTrader 5, работающий на нескольких таймфреймах, который помогает трейдерам точно и ясно определять направление тренда и потенциальные точки разворота. для MT4: https://www.mql5.com/en/market/product/193245 Информация о цене: Текущая цена является промо-ценой и может измениться по мере выхода предстоящих обновлений и новых функций. Бонусное предложение: Чтобы получить БЕСПЛАТНЫЙ авто-трейд советник Assistant EA для этого индикатора, пожалуйста, на
Новый король в городе — Индикатор + управление ордерами (TP1 + TP2 + TP3) + опциональный Telegram-сигнал-сендер ВКЛЮЧЁН (БЕСПЛАТНО) (ПОЛНОЦЕННАЯ ТОРГОВАЯ И СИГНАЛЬНАЯ СИСТЕМА) Gold Slayer EA Этот индикатор включает в себя продвинутую стратегию, торговую систему с настраиваемым управлением ордерами и систему mean reversion, которая сочетает расширения Envelope и поддерживается несколькими интеллектуальными фильтрами подтверждения, такими как RSI, для поиска высоковероятных точек разворота с сигн
Smart Trend Trading System — MetaTrader 5 После покупки напишите мне на MQL5, чтобы БЕСПЛАТНО получить Smart Universal Expert Advisor, а также доступ к онлайн-курсу, руководство в формате PDF и доступ к закрытой группе. STTS объединяет направление тренда, сигналы входа и выхода, зоны разворота и важные ценовые уровни прямо на графике. Торгуйте по системе вручную или подключите отдельный совместимый советник для автоматического исполнения с выбранными вами настройками. ОДНА СИСТЕМА. ЧЕТЫРЕ ТОРГОВ
Entry Points Pro показывает, где входить, где ставить стоп и каким лотом торговать — до того, как вы поставите ордер. ЦЕНА Сейчас 199 USD: 8 копий по этой цене, затем 249 USD. Финальная цена — 349 USD. Я зарабатываю торговлей на рынке и показываю это, поэтому мне не нужно продавать этот индикатор всем подряд. Это инструмент для трейдеров, которые думают своей головой, а не волшебная кнопка. Нет пробоя — нет сделки. Серая стрелка — отменённый сигнал: цена не пробила сигнальную свечу, значит, н
Zoryk Gold
Reda El Koutbane
4.79 (19)
Скидка заканчивается через 24 часа — следующая цена $ 69 ZORYK — продвинутая сигнальная система для XAUUSD в MetaTrader 5 Вам знакомо это чувство. Вы долго анализируете золото. Ждёте подходящего момента для входа. Наконец открываете сделку — и цена сразу начинает двигаться против вас. Вы закрываете позицию слишком рано, передвигаете Stop Loss или сомневаетесь всего несколько секунд. После этого рынок достигает именно той цели, которую вы ожидали изначально, но уже без вас. Проблема не всегда за
Получите своё торговое преимущество в поле зрения! M5 Sniper — это новый индикатор от MeanFX. Он сочетает точные торговые сигналы с адаптивными уровнями TP/SL — в результате создавая лучшие возможные статистические сделки! Цена увеличивается каждые 5 покупок, следующая цена — 69$ Напишите мне после покупки, чтобы получить советы/руководство и бонусного EA Что выделяет его среди других? Проверенная статистическая эффективность на Gold XAUUSD ( работает практически на каждом активе , с акцентом н
Gann Made Easy   - это профессиональная, но при этом очень простая в применении Форекс система, основанная на лучших принципах торговли по методам господина У.Д. Ганна. Индикатор дает точные BUY/SELL сигналы, включающие в себя уровни Stop Loss и Take Profit. ПОЖАЛУЙСТА, СВЯЖИТЕСЬ СО МНОЙ ПОСЛЕ ПОКУПКИ, ЧТОБЫ ПОЛУЧИТЬ ТОРГОВЫЕ ИНСТРУКЦИИ И ОТЛИЧНЫЕ ДОПОЛНИТЕЛЬНЫЕ ИНДИКАТОРЫ БЕСПЛАТНО! Вероятно вы уже не раз слышали о торговли по методам Ганна. Как правило теория Ганна отпугивает от себя не только
SuperScalp Pro
Van Minh Nguyen
4.54 (37)
SuperScalp Pro - Professional Multi-Layer Confluence Scalping System SuperScalp Pro — это продвинутый индикатор для скальпинга, который расширяет возможности классического Supertrend с помощью нескольких интеллектуальных фильтров подтверждения. Он помогает выявлять торговые возможности Buy/Sell с более высокой вероятностью успеха и значительно сокращать количество ложных сигналов. Чёткие стрелки Buy и Sell отображаются непосредственно на графике вместе с автоматически рассчитываемыми в реальном
ULTRA - это технический индикатор, который который работает по принципу “Все включено” - самостоятельно анализирует рынок, дает торговые сигналы, показывает уровни для установки стоп лосс, а также подсказывает когда нужно закрывать сделки, чтобы получить профит или минимизировать убыток. То есть, не важно, что ты не умеешь анализировать рынок, определять уровни - где поставить SL или плохо совладаешь с мани-менеджментом. ULTRA все это сделает вместо тебя! БОНУС ДЛЯ ПОКУПАТЕЛЯ : После покупки ULT
Gold Trend Coach MT5
Cristhian Alexander Gaibor Cuasquer
4.27 (11)
Сигналы на покупку и продажу по золоту (XAUUSD) для MetaTrader 5 без перерисовки. У каждого сигнала есть stop loss и три take profit. Фильтр Smart Money Concepts с BOS и CHoCH, чтобы вы торговали по структуре, а не против неё. Живой Ментор на панели ведёт вас на каждом шаге, от входа до TP3. И алерты прямо на телефон и в ваш собственный Telegram-канал. Это Gold Trend Coach. Больше никакой торговли в одиночку. БЕСПЛАТНЫЙ НАБОР ПОКУПАТЕЛЯ к вашей покупке: 1. Telegram Alert Bridge: ваши сигналы пр
GoldenX Entry MT5
VividMind Digital Solutions
5 (17)
GoldenX Entry — это индикатор для MT5 с адаптивным алгоритмом Smart Entry Trend, системой оценки сигналов, детектором рыночных режимов и фильтром волатильности. Каждый сигнал включает рассчитанный уровень входа, три уровня Take-Profit (TP1, TP2, TP3) и уровень Stop-Loss. Он построен на нескольких аналитических слоях, предназначенных для адаптации к различным рыночным условиям, объединяя многоуровневую аналитическую систему со встроенным оптимизатором и системой статистического отслеживания. Инди
SMC Intraday Formula
VividMind Digital Solutions
5 (26)
Давайте сначала будем честны. Ни один индикатор сам по себе не сделает вас прибыльным. Если кто-то говорит вам обратное — он продаёт вам мечту. Любой индикатор, который показывает идеальные стрелки покупки/продажи, можно сделать безупречным — просто увеличьте нужный участок истории и сделайте скриншот успешных сделок. Мы так делать не будем. SMC Intraday Formula — это инструмент. Он считывает структуру рынка за вас, определяет зоны с наивысшей вероятностью движения цены и точно показывает, как
Boba Analysis Suite
Trade Ready Solutions LLC
5 (2)
Boba Analysis Suite Boba Analysis Suite — аналитический индикатор для MetaTrader 5. Он объединяет структуру рынка, значимые ценовые зоны и общий рыночный контекст в одном представлении на графике. Индикатор разработан на основе практического опыта трейдера и наставника по трейдингу. Он помогает выстроить последовательный процесс анализа: оценивать направление рынка, определять важные уровни и рассматривать несколько таймфреймов в совокупности. Анализ с учётом контекста Значение отдельных сигнало
FX Power: Анализируйте силу валют для более эффективной торговли Обзор FX Power — это ваш незаменимый инструмент для понимания реальной силы валют и золота в любых рыночных условиях. Определяя сильные валюты для покупки и слабые для продажи, FX Power упрощает принятие торговых решений и выявляет высоковероятные возможности. Независимо от того, хотите ли вы следовать за трендами или предсказывать развороты с использованием экстремальных значений дельты, этот инструмент идеально адаптируется под
Gold Entry Sniper – Профессиональная Мульти-Таймфрейм ATR Панель для Скальпинга и Свинг-Трейдинга на Золоте Gold Entry Sniper — это передовой индикатор для MetaTrader 5, разработанный для точных сигналов на покупку/продажу по XAUUSD и другим инструментам. Основан на логике ATR Trailing Stop и мульти-таймфрейм анализе , этот инструмент идеально подходит как для скальперов, так и для среднесрочных трейдеров, обеспечивая чёткие точки входа с высокой вероятностью . Основные возможности и преимуществ
M1 SNIPER   — это простая в использовании торговая система. Это стрелочный индикатор, разработанный для тайм фрейма M1. Индикатор можно использовать как отдельную систему для скальпинга на тайм фрейме M1, а также как часть вашей существующей торговой системы. Хотя эта торговая система была разработана специально для торговли на M1, ее можно использовать и с другими тайм фреймами. Первоначально я разработал этот метод для торговли XAUUSD и BTCUSD. Но я считаю этот метод полезным и для торговли на
FiboSniper Pro – Multi-Filter Fibonacci System with Auto SL/TP and Control Panel FiboSniper Pro — это технический индикатор, который объединяет динамические Fibonacci Envelopes с несколькими фильтрами подтверждения для формирования отборных сигналов Buy и Sell. Уровни Fibonacci рассчитываются на основе Moving Average и ATR, а затем фильтруются с помощью ADX, EMA, RSI, ATR, Volume, Time и структуры свечи. Индикатор отображает на графике автоматические уровни Stop Loss и Take Profit на основе ATR,
Apex Patterns PRO Купите индикатор — получите Expert Advisor на его основе БЕСПЛАТНО. Самооптимизирующаяся система анализа графических паттернов и пробоев Традиционные сканеры паттернов полагаются на фиксированные входные параметры, что часто приводит к снижению их эффективности при изменении рыночной волатильности и структуры. Apex Patterns PRO разработан для адаптации к меняющимся рыночным условиям, объединяя распознавание структурных графических паттернов, фильтрацию по моментуму и статистич
Auto Optimized SpeedAngle — это система векторизации импульса институционального уровня, которая исключает подгонку под исторические данные (curve-fitting) за счет непрерывной форвард-оптимизации (Walk-Forward Optimization, WFO). Вместо того чтобы полагаться на статические входные параметры, которые теряют эффективность при смене рыночных режимов, индикатор динамически перекалибрует свои настройки, используя валидацию на вневыборочных данных (Out-of-Sample, OOS). Это гарантирует, что отображаемы
Sqn Max Indicator Sqn Max is an exclusive indicator to trade the market with high effectiveness. The indicator is based on price action, volatility and trend. This indicator is as simple as possible but not too simple. The indicator can generate alerts to ease the trading process. You don't have to stay all day in front of your screen. The indicator can be used with any class of assets and with any time frame. It is possible to achieve better results trading our list of selected assets. We achi
Следующее обновление — версия 2.52 уже скоро! [НОВОЕ] Приготовьтесь к 4 новым важным функциям, призванным улучшить ваш анализ рынка и торговый процесс. Мы выводим анализ рынка на новый уровень с помощью 4 новых функций, разработанных с учётом ваших потребностей в трейдинге. Представляем: 1. TRADE OVERVIEW DASHBOARD 2. CONFLUENCE AT ZONE 3. STRONG & WEAK HIGH/LOW 4. OTE 1. TRADE OVERVIEW DASHBOARD Панель, которая помогает легче понимать общую картину рынка, предоставляя рекомендации для поддержк
Каждый покупатель этого индикатора получает дополнительно Бесплатно: Авторскую утилиту "Bomber Utility", которая автоматически сопровождает каждю торговую операцию, устанавливает уровни Стоп Лосс и Тейк профит и закрывает сделки согласно правилам этой стратегии, Сет-файлы для настройки этого индикатора на различных активах, Сет-файлы для настройки Bomber Utility в режимы: "Минимум Риска", "Взвешенный Риск" и "Стратегия Выжидания", Пошаговый видео-мануал, который поможет вам быстро установить, н
Power Candles V3 — самооптимизирующийся индикатор силы Power Candles V3 преобразует силу валюты и инструмента в готовый к использованию торговый план на каждом графике, к которому он прикреплен. Вместо того, чтобы просто раскрашивать свечи, он выполняет автоматическую оптимизацию в режиме реального времени в фоновом режиме и предоставляет вам оптимальные значения Stop Loss, Take Profit и порог сигнала для выбранного вами символа. Один клик — и все готово для реальной торговли: на графике появляю
Currency Strength Wizard   — очень мощный индикатор, предоставляющий вам комплексное решение для успешной торговли. Индикатор рассчитывает силу той или иной форекс-пары, используя данные всех валют на нескольких тайм фреймах. Эти данные представлены в виде простых в использовании индексов валют и линий силы валют, которые вы можете использовать, чтобы увидеть силу той или иной валюты. Все, что вам нужно, это прикрепить индикатор к графику, на котором вы хотите торговать, и индикатор покажет вам
Atomic Analyst — MetaTrader 5 После покупки напишите мне на MQL5, чтобы БЕСПЛАТНО получить Smart Universal Expert Advisor, а также доступ к онлайн-курсу, руководство в формате PDF и доступ к закрытой группе. Atomic Analyst объединяет анализ ценового движения, направление тренда, сигналы входа и выхода, уровни Stop Loss и несколько уровней Take Profit прямо на графике. УВИДЬТЕ СИГНАЛ. ОЦЕНИТЕ ТОРГОВУЮ СИТУАЦИЮ. Atomic Analyst представляет результаты анализа в понятном визуальном виде: • Стрелки п
Unix Scalper — MetaTrader 5 После покупки напишите мне на MQL5, чтобы БЕСПЛАТНО получить Smart Universal Expert Advisor, а также доступ к онлайн-курсу, руководство в формате PDF и доступ к закрытой группе. Найдите торговую ситуацию. Оцените план. Выберите способ торговли. UNIX Scalper объединяет анализ рынка, решения BUY/SELL/WAIT и уровни Entry, Stop Loss, TP1 и TP2 в одной удобной панели. УВИДЬТЕ СИГНАЛ И ТОРГОВЫЙ ПЛАН • Понятные решения: BUY, SELL или WAIT. • Определённые уровни: Entry, Stop
Astral Structure Оцените сетап. Посмотрите его первоначальный план. Специальная цена запуска - $99. $149 после запуска. Структурный сетап ставит сразу несколько вопросов: согласуется ли общая картина, где находится ориентир стопа и как определены цели? Astral Structure объединяет эти вопросы в одном рабочем пространстве для трейдеров, самостоятельно принимающих решения на основе структуры рынка. Сосредоточьтесь на актуальном сетапе. Рассматривайте последний подходящий сетап, его направление и кв
Индикатор Tokyo Indicator обеспечивает наглядное представление о направлении тренда, потенциальных торговых сигналах и текущей рыночной ситуации. Его ступенчатая линия тренда с цветовой индикацией позволяет различать «бычьи» фазы (выделены синим цветом) и «медвежьи» фазы (выделены пурпурным цветом). Соответствующие стрелки указывают на возможные точки входа в рынок (покупку или продажу) при смене тренда. Встроенная информационная панель объединяет данные о текущем сигнале, рыночном настроении,
Мультивалютный индикатор силы и импульса MT5 Dynamic Forex28 Navigator — развитие наших давно популярных индикаторов, объединяющее силу пяти в одном: Advanced Currency Strength28 Indicator (700 отзывов) Advanced Currency IMPULSE with ALERT (530 отзывов) Currency Strength EXOTICS GOLD Impulse with Alert CS28 Combo Signals (текущий бонус) Не нужно покупать четыре индикатора и ставить их на графики. Всё объединено в одном мощном индикаторе: сила 28 пар Forex, импульс рынка, который их ведёт, и опов
Scalper Vault — это мощная, полноценная торговая система, созданная для трейдеров, которые стремятся к стабильным результатам в внутридневной торговле. Этот высокоточный индикатор представляет собой комплексное, самостоятельное торговое решение, обеспечивающее аналитику профессионального (институционального) уровня как для торговли на рынке Forex, так и для работы с бинарными опционами. Пожалуйста, свяжитесь со мной после покупки, чтобы получить мои торговые советы, а также отличный бонус! Исклю
Другие продукты этого автора
JK-Top Hedge — Two-Sided Hedged Grid EA for MetaTrader 5 Overview JK-Top Hedge is an Expert Advisor for MetaTrader 5. It places a Buy Stop above the current price and a Sell Stop below it at the same time, building two grid lines on either side of the market. When one pending order is filled, the EA places the next one further away, and the cycle repeats. Because long and short positions exist at the same time, a floating loss on one side can partly be offset by the other. The EA closes or reduc
Automatic Support and Resistance Levels with Breakout Tracking Product name note: the file name and the indicator short name in the source are AutomaitcSR . The correct spelling AutomaticSR is recommended before submission. Use one identical name for the file, the short name and the Market product title. Short description (for the Market product card) Automatic support and resistance levels built from confirmed swing pivots, with ATR-based filtering, optional level zones, breakout marking and a
FREE
High Time Candlestick Chart Visualize the current higher-timeframe candle directly on your lower-timeframe chart. This indicator projects the OHLC data of a selected higher timeframe ​ (M15, H1, H4, D1, or W1) onto your current chart as a graphical candlestick, offset to the right of the live price area. It helps you keep the bigger-picture candle structure in view without switching timeframes. Features Graphical HTF candle : Body, upper wick, and lower wick drawn as chart objects, colored by bu
FREE
SweepReversalMap — Индикатор картирования зон разворота после сбора ликвидности Обзор SweepReversalMap — это пользовательский индикатор на основе Price Action, предназначенный для выявления событий «Liquidity Sweep» (свип/сбор ликвидности) на рынке и картирования потенциальных зон разворота после reclaim цены. Индикатор подходит для любых инструментов и таймфреймов. Основная логика Обнаружение свингов: на основе заданного пользователем Swing Length определяются ближайшие действительные свинг-ха
FREE
Fibonacci Confluence Suite Short description Fibonacci Confluence Suite is a chart-window indicator for MetaTrader 5. It builds a Fibonacci grid from confirmed swing highs and lows, marks the levels where projections from earlier swings overlap, and adds a Golden Pocket zone, Fibonacci time zones, touch statistics and a compact status panel. All levels are calculated from closed bars only. Overview Drawing retracement levels by hand usually means three separate steps: finding the swing, pulling
FREE
RSI Cloud — RSI Dual Moving Average Cloud Indicator This indicator calculates RSI in a separate window, applies fast and slow moving averages to the RSI values, and displays the relative position of the two averages as a filling cloud. It also provides an optional raw RSI line, fixed 70/50/30 reference levels, and arrow markers when the fast and slow RSI averages cross. The indicator is for analysis and signal filtering only; it does not place trades. How it works Wilder RSI is calculated from
FREE
SR Power Channel — Support & Resistance Power Channel Indicator Overview SR Power Channel is a main-chart visual indicator built on price extremes and ATR. It locates the highest high (resistance) and the lowest low (support) within a configurable lookback window, extends those two levels to the right, and wraps them into ATR-based channel bands. The indicator also counts bullish and bearish bars inside the window and marks the moments when price breaks above or below the channel bands with dia
FREE
BBOscillator — Candle Coloring with Andean Oscillator States and ATR Stop Levels Overview BBOscillator is a technical indicator for MetaTrader 5 that is drawn in the main chart window. It combines the Andean Oscillator state logic, candle coloring, dynamic ATR stop levels and state-change marks in a single visual layer, so that four questions can be answered by looking at one chart: whether the direction is defined, which side it leans to, where the direction state started, and where a stop refe
FREE
TrendReferenceLine — Adaptive Trend Line with ATR Channel and Auto Trade Levels Short description: ​ An adaptive trend line indicator that switches color with trend direction, marks confirmed reversals with arrows, and automatically plots entry, stop loss and three R-multiple targets on the chart. Type: ​ Trend-following technical analysis indicator (not an automated trading robot). What it does In trend trading, three questions matter most: has the direction changed, where does the stop go, and
FREE
RSI Support Resistance Signals Platform: MetaTrader 5 RSI Support Resistance Signals adds zone coloring and signal labels to the standard RSI. The indicator does not execute trades. Signals: Sell: RSI is in the overbought zone and turns down, or RSI is in the resistance zone and a bearish candle with an upper wick is detected. Buy: RSI is in the oversold zone and turns up, or RSI is in the support zone and a bullish candle with a lower wick is detected. Each signal can show a user-defined Engli
FREE
HubDynamicTrendLine This indicator identifies strict pivot highs and lows based on N bars to the left and right (default 15), connecting consecutive pivots of the same type to build a dynamic channel with upper and lower boundaries. Key Features Pivot Connections : Consecutive pivot highs and pivot lows are connected with solid trend lines, forming a visible channel structure. Slope Projection : When the price difference between two consecutive pivots of the same type is at least one 200-period
FREE
Dual Period Filter — Adaptive Coppock Curve for MT5 Overview The Coppock Curve is built from the sum of a long and a short rate of change, smoothed afterwards, and is used to observe the direction and strength of medium-term momentum. This indicator extends the classic calculation in two ways. First, the price source passes through an optional adaptive filter before the momentum is calculated. Nine filter types are available: None, SMA, EMA, RMA, Double WMA, Triple VWMA, HMA, LLAMA and Kalman.
FREE
Trend Pressure Oscillator Trend Pressure Oscillator is a separate-window analytical indicator for MetaTrader 5. It evaluates buying and selling pressure across multiple timeframes to help identify potential exhaustion points and market regime shifts. This tool does not generate trading signals automatically and does not execute trades. It is designed to be used as part of a broader technical analysis approach. Functionality Multi-range pressure analysis using Williams %R over three periods (Pul
FREE
EF Percentage Channel A trend-state indicator that combines volatility-adaptive averaging, an Ehlers nonlinear filter, and statistical percentile bands into a single, self-adjusting channel. Overview The indicator builds an adaptive trend baseline on the chart and wraps it with statistical percentile bands. When price moves above the upper band, the market is flagged as bullish; below the lower band, bearish; inside the channel, the previous state is retained. The trend line, channel bands, cand
FREE
RSI Adaptive T3 Short description RSI Adaptive T3 is a trend and momentum indicator for MetaTrader 5. It is drawn directly on the price chart and combines two elements: a T3 moving average whose smoothing length changes automatically with the value of the RSI, and a second copy of the same line delayed by two bars. The gap and the crossing between these two lines show the current direction and short-term changes in momentum. Optional volatility bands and crossover markers complete the picture. W
FREE
Intraday Spark Chart Overview Intraday Spark Chart is an MT5 indicator for intraday analysis. It converts the current price change of a symbol into a percentage of the daily opening price and plots the result in a separate subwindow. Every trading day starts again from the zero line, so each day is drawn as a separate segment and the intraday move of the current day can be observed directly. The indicator is a data visualization tool. It does not generate trading signals and does not provide inv
FREE
MA Valuation Fluctuations measures how far the current price stands from its moving average. The deviation is expressed in units of dispersion and then compressed by a hyperbolic tangent into a fixed range from -1.0 to +1.0. The indicator is drawn in a separate window and can be used as a context filter next to a trend following or a mean reversion approach. What the indicator shows For every bar the indicator compares the selected price with a moving average in logarithmic terms. Because the r
FREE
Trendfollowingline (ATR Based Trend Following Indicator) Overview Trendfollowingline is a trend following indicator drawn in the main chart window. It uses the Average True Range (ATR) as a measure of market volatility and plots a band around the price: while the direction is up, the band is placed below the price and moves upwards; when the direction turns down, the band switches above the price and moves downwards. An arrow marker is drawn on the band each time the direction changes. The indic
FREE
Deviation Trend Profile Overview Deviation Trend Profile is a MetaTrader 5 chart indicator that combines three visual layers in a single chart window: a moving average with momentum-based coloring, deviation bands calculated from volatility, and a horizontal distribution profile drawn to the right of the current price. The indicator is an analytical tool. It does not open, modify or close trades, and it is not a complete trading system. It is designed to help the user observe trend direction, mo
FREE
ZigZag Trader EA - Intelligent ZigZag Trading Assistant Introduction ZigZag Trader EA is a fully automated trading assistant based on the ZigZag indicator. It intelligently identifies previous highs and lows of the ZigZag indicator, combined with an advanced risk management system, to provide you with precise trading signals and automated trade execution. Whether you are a novice or experienced trader, ZigZag Trader EA can help you simplify trading decisions and achieve stable trading performa
FREE
Overview QuantifiedTrends is a MetaTrader 5 indicator that runs in a separate chart sub-window. It describes momentum conditions through three calculation layers: Primary QQE layer: an RSI-based structure that uses smoothing and the smoothed RSI's own variation to build adaptive upper and lower bands and a primary QQE trend line. Statistical envelope layer: Bollinger Bands applied to the deviation of the primary QQE trend line from the 50 midline, used to determine whether primary momentum readi
FREE
Inverse Probability Distribution — Pivot Density and K-Means Clustering Indicator Platform: MetaTrader 5 Overview This indicator is a technical analysis visualization tool for MetaTrader 5. It identifies confirmed pivot highs and lows on historical bars, groups pivot prices with K-Means clustering, and draws an inverse distribution profile on the right side of the chart. The profile shows the density of historical pivot prices at different price levels. The indicator does not generate trading s
FREE
Adaptive MACD - R² Based Adaptive MACD Indicator Overview Adaptive MACD is an innovative MetaTrader 5 indicator that improves upon the traditional MACD. By introducing the Pearson correlation coefficient to calculate the R² value of price trends, this indicator can adapt to market conditions and dynamically adjust its sensitivity. It helps traders capture trends more effectively while filtering out market noise. How It Works Traditional MACD uses a fixed difference between fast and slow EMAs. Ad
FREE
MACandleApprox — Moving-Average Approximate Candle Indicator MACandleApprox is a custom indicator that, on the main price chart, applies a selected type of moving average to the open, high, low, and close price series respectively, and replots them as "approximate candles". It does not modify the original candlesticks; instead, it overlays a smoothed candle view based on moving averages, helping traders observe the smoothed price movement and directional changes more intuitively. The indicator s
FREE
# MASignalPanel — Multi-MA Signal Panel with Trend Filter ## Overview MASignalPanel is an all-in-one moving-average signal indicator designed for MetaTrader 5. It combines up to three moving averages (SMA, EMA, SMMA, LWMA) with four trade signal modes — Cross, Breakout, Pullback and Channel — and adds a higher-timeframe trend filter line (default EMA240) to keep you on the right side of the market. A fully interactive control panel lets you change MA type, MA count, periods, s MA indicator, movi
FREE
MACandleApproxPro — Advanced MA Candle Reconstruction & Multi-Dimensional Market Structure Indicator Overview MACandleApproxPro ​ is a comprehensive technical analysis tool designed for professional traders. It breaks through the limitations of traditional moving averages by reconstructing MA data into "MA Candles" ​ through complex algorithms. This unique visualization filters out market noise, allowing you to examine price trends, momentum shifts, and critical market structures from a more
JK-Taurus Expert Advisor A grid-based scaling EA driven by trend and signal confirmation. Overview JK-Taurus is a fully automated trading system designed specifically for the MT5 platform. It integrates multi-timeframe trend analysis, signal confirmation, and a dynamic grid-based position-building strategy, aiming to capture sustained profit opportunities during trending market conditions. The EA features an intuitive visual dashboard, allowing users to monitor account status in real-time and in
Adaptive filtering trend Overview Adaptive filtering trend is a multi-layer signal filtering indicator for the MetaTrader 5 platform, built on the Coppock curve. The indicator computes a long-period and a short-period Rate of Change (ROC) of the price, sums them, and smooths the sum with a Weighted Moving Average (WMA) to obtain the Coppock curve. A set of independently switchable filters is then applied to screen the signals, and bullish or bearish crossings are marked on the main chart throug
JKEFAdvancedModel — Volatility-Adaptive Trend Breakout Trading System Overview JKEFAdvancedModel is a fully automated Expert Advisor for MetaTrader 5. On the selected timeframe it adapts to market volatility to follow the trend and trade breakouts. The system evaluates the state of closed bars only, so signals are not revised by an unfinished bar. Once a direction is confirmed, the robot can enter with a market order or place a stop order at a defined distance from the current price and wait for
JKEFtrendMartingale — Volatility-Adaptive Trend-Following Martingale Trading System Overview JKEFtrendMartingale is a fully automated Expert Advisor for MetaTrader 5. On the selected timeframe it adapts to market volatility to follow the trend and trade breakouts. After a losing trade it increases the lot size of the next trade according to the configured rule, and returns to the initial lot size once profits have absorbed the accumulated loss. The system evaluates the state of closed bars only,
Фильтр:
Нет отзывов
Ответ на отзыв