TrendReversalProbability

Trend Reversal Probability

Overview

Trend Reversal Probability is an analytical indicator for MetaTrader 5. It does not open, close or manage trades. Its purpose is to describe one specific property of the market in numbers: how long the current directional state of a smoothed momentum oscillator has already lasted, and how unusual that duration is compared with the same measurement on previous occasions.
The indicator runs in a separate window. On every bar it updates the duration of the current state, the average and standard deviation of all completed state durations available on the chart, and an empirical percentile value for the current duration.

What the indicator measures

The calculation chain is based on the median price of each bar, that is the average of the high and the low.
  1. Two simple moving averages of the median price are calculated, a fast one over 5 bars and a slow one over 34 bars. Their difference forms a momentum oscillator.
  2. The bar-to-bar change of that oscillator is separated into its rising and falling parts. Both parts are smoothed with a Wilder style moving average over the period set in the input parameters.
  3. The smoothed values are converted into a single centred value that moves roughly between -50 and +50. The zero line of that centred value is the reference point.
  4. Crossing the zero line upwards or downwards starts a new state. The indicator counts the number of bars elapsed since the last crossing, and calls this the signal duration.
  5. Every time a state ends, its final duration is added to a running statistic. From all completed durations the indicator keeps the mean and the standard deviation, which are plotted as the average duration line and the deviation levels.
  6. The current duration is compared with that distribution. The result is an empirical percentile displayed as a percentage in the upper left corner of the indicator window.
The result is a statistical description of the past and the present. It is not a forecast of price, and it does not state that a reversal will happen. A high percentile only means that the current state has lasted longer than most of the comparable states seen earlier on the same chart and settings.

Chart elements

The indicator draws the following elements in its own subwindow.
  • Average Duration​ - the mean of all completed state durations.
  • Upper 1 SD, Upper 2 SD, Upper 3 SD​ - the average duration plus one, two and three standard deviations.
  • Lower 1 SD​ - the average duration minus one standard deviation.
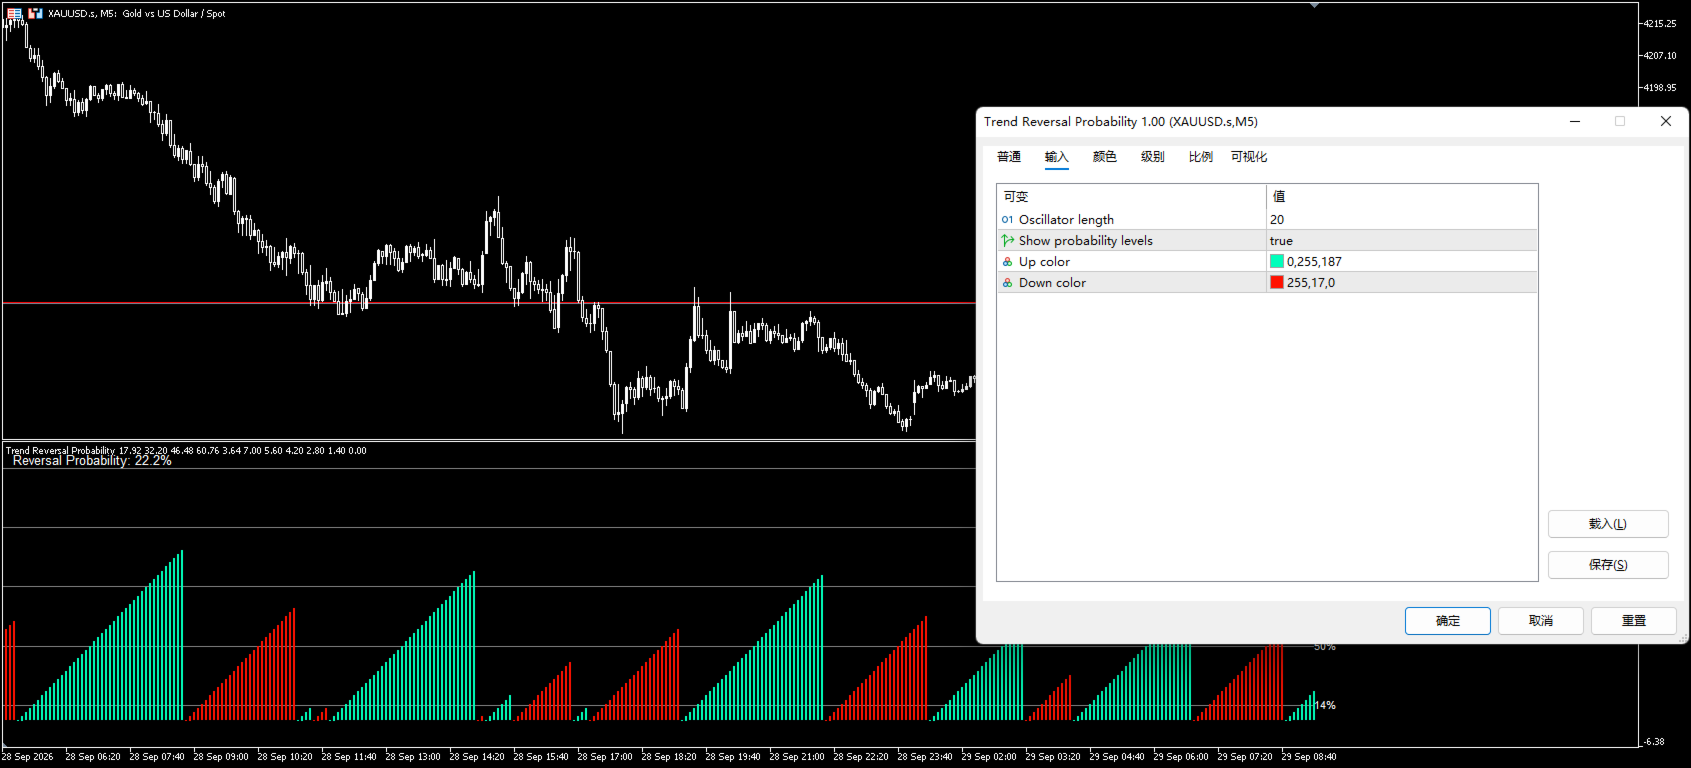
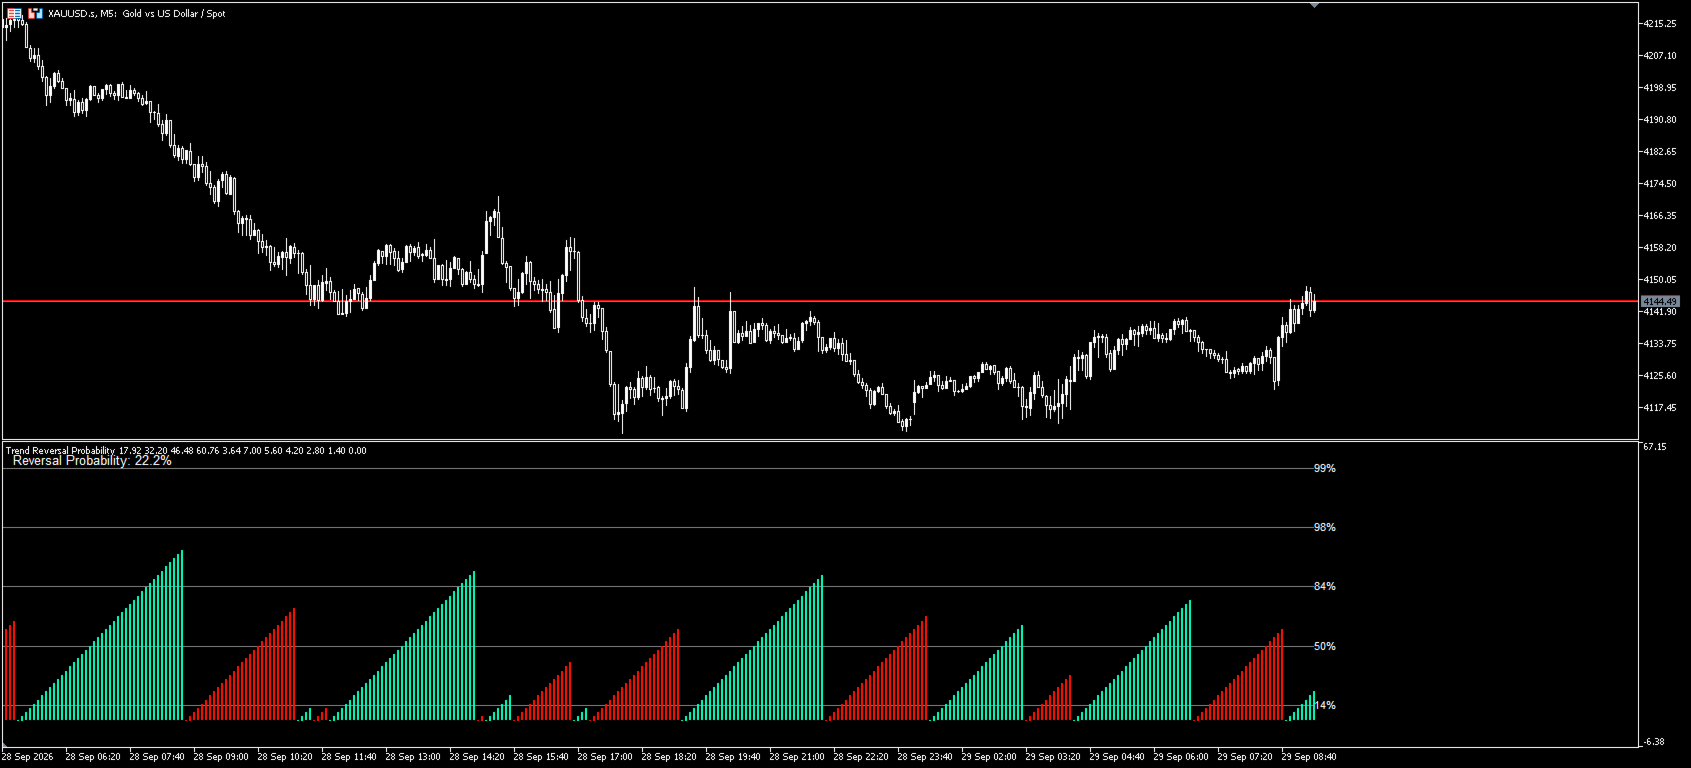
  • Signal Duration​ - a histogram of the number of bars since the last zero line crossing. The bar is painted with the up colour while the centred value is above zero and with the down colour while it is below zero.
  • Signal Duration 80%, 60%, 40%, 20%​ - four additional histograms showing the same duration value scaled to 80, 60, 40 and 20 percent. They are provided for visual presentation and make the height of the current state easier to read against the levels.
  • Extreme Reversal Probability​ - an orange arrow placed above the histogram when the current duration exceeds the average duration plus three standard deviations.
Text labels showing 14%, 50%, 84%, 98% and 99% can be displayed at the average duration and at the deviation levels. These labels mark the positions of the average duration and of one, two and three standard deviations above it, with the 14% label placed one standard deviation below the average.
A label in the upper left corner of the subwindow shows the current percentile value, for example Reversal Probability: 87.4%.

Alerts

The indicator can send standard terminal alerts when the following conditions are met on a closed or closing bar.
  • The percentile value rises above 84%.
  • The percentile value rises above 98%.
  • The percentile value falls below 14%.
  • The duration counter returns to zero, which means a new state has started.
The alerts use the standard terminal alert function. They can be silenced in the terminal options if they are not needed.

Input parameters

Parameter
Default
Description
Oscillator length
20
Period of the Wilder style smoothing applied to the rising and falling parts of the oscillator change. Higher values produce a slower centred value and longer states.
Show probability levels
true
Enables or disables the text labels at the average duration and deviation levels.
Up color
0,255,187
Colour used for the histograms while the centred value is above zero.
Down color
255,17,0
Colour used for the histograms while the centred value is below zero.
The fast and slow moving average periods, 5 and 34, and the window used for the duration volatility, 100 bars, are fixed in this version and are not exposed as inputs.

How to use it

The indicator is intended as a context tool that is read alongside a trading method, not as a standalone source of entries.
  • Loading​ - attach the indicator to any symbol and any timeframe. It appears in a separate window below the price chart.
  • Reading the histogram​ - the height of the Signal Duration histogram shows how many bars the current directional state has lasted. The colour shows the direction of the state according to the centred value.
  • Reading the levels​ - the grey lines show what has been a typical duration on this symbol and timeframe. A histogram that stays below the average duration line is still inside the usual range. A histogram approaching or exceeding the second and third deviation levels is in a range that has been rare in the loaded history.
  • Reading the percentile​ - the value in the subwindow summarises the same information as a single number between 0 and 100.
  • Practical applications​ - the value can be used to review how long a move has already been running, to plan where attention to an open position may be increased, to compare the behaviour of several symbols or timeframes, or to study how state durations behave on a chosen instrument.
  • Reset behaviour​ - when the centred value crosses the zero line, the duration counter starts again from zero. The percentile falls back accordingly and the reset alert can be raised.
Because the statistic is built from completed states found on the loaded history, the number of bars available on the chart matters. A longer history provides more completed states and a more stable average duration.

Requirements and limitations

  • MetaTrader 5 build with support for separate window indicators.
  • At least 56 bars are required before any calculation starts, and noticeably more before the average duration, the deviation levels and the percentile become available. The left part of the chart can therefore stay empty.
  • Values on the forming bar are recalculated on every tick and can change until the bar closes.
  • The indicator does not use DLL calls and does not perform any trading operations.
  • It can be used on any symbol and any timeframe provided by the terminal.
  • The indicator does not place objects on the price chart. All objects are drawn inside its own subwindow and are removed when the indicator is removed.

Notes on risk

Trading financial markets involves substantial risk. This indicator is an analytical tool. It describes statistical properties of past state durations and does not predict future price movement, does not guarantee that any reversal will occur, and does not provide investment advice or trading signals that can be followed mechanically. Any decision based on the values shown by this indicator remains the full responsibility of the user.

Support

Questions, comments and requests are handled through the product comments section and the built-in MQL5.com messaging system.
It will switch to a subscription service after exceeding 100 downloads.
Prodotti consigliati
MACD Enhanced
Nikita Berdnikov
4 (4)
Introducing the MACD  Enhanced – an advanced MACD (Moving Average Convergence Divergence) indicator that provides traders with extended capabilities for trend and momentum analysis in financial markets. The indicator uses the difference between the fast and slow exponential moving averages to determine momentum, direction, and strength of the trend, creating clear visual signals for potential entry and exit points. Attention! To achieve the best results, it is recommended to adapt the indicator
FREE
Donchian Breakout And Rsi
Mattia Impicciatore
4.33 (3)
Descrizione generale Questo indicatore è una versione avanzata del classico Donchian Channel , arricchita con funzioni operative per il trading reale. Oltre alle tre linee tipiche (massimo, minimo e linea centrale), il sistema rileva i breakout e li segnala graficamente con frecce sul grafico, mostrando solo la linea opposta alla direzione del trend per semplificare la lettura. L’indicatore include: Segnali visivi : frecce colorate al breakout Notifiche automatiche : popup, push e email Filtro R
FREE
Follow The Line MT5
Oliver Gideon Amofa Appiah
4.6 (35)
This indicator obeys the popular maxim that: "THE TREND IS YOUR FRIEND" It paints a GREEN line for BUY and also paints a RED line for SELL. (you can change the colors). It gives alarms and alerts of all kinds. IT DOES NOT REPAINT and can be used for all currency pairs and timeframes. Yes, as easy and simple as that. Even a newbie can use it to make great and reliable trades. NB: For best results, get my other premium indicators for more powerful and reliable signals. Get them here: https://www.m
FREE
JT360 DNA Mini PnL Pointer V1.04 Public Compatto. Chiaro. Sempre sott’occhio. JT360 DNA Mini PnL Pointer è un indicatore leggero per MetaTrader 5 che mostra il profitto o la perdita flottante aggregata di tutte le posizioni aperte sul simbolo del grafico corrente. La sua visualizzazione compatta sul grafico combina il PnL basato sul rischio, espresso in R, una sottile mini-barra e una matrice di colori personalizzabile. I colori distintivi JT360, turchese e magenta, evidenziano i valori estremi
FREE
Indicator Description 4 Hull MA Color + Envelopes is a powerful trend-following indicator for MetaTrader 5 that combines four Hull Moving Averages (HMA) with Moving Average Envelopes to clearly identify market direction, trend strength, and potential reversal or pullback zones. This indicator is designed to reduce noise, react quickly to price movement, and provide a clean visual structure for professional trading.   Key Features   4 Hull Moving Averages (20, 50, 100, 200) Automatic color change
FREE
Free automatic Fibonacci is an indicator that automatically plots a Fibonacci retracement based on the number of bars you select on the BarsToScan setting in the indicator. The Fibonacci is automatically updated in real time as new highest and lowest values appears amongst the selected bars. You can select which level values to be displayed in the indicator settings. You can also select the color of the levels thus enabling the trader to be able to attach the indicator several times with differe
FREE
Are you tired of drawing trendlines every time you're analyzing charts? Or perhaps you would like more consistency in your technical analysis. Then this is for you. This indicator will draw trend lines automatically when dropped on a chart. How it works Works similar to standard deviation channel found on mt4 and mt5. It has 2 parameters: 1. Starting Bar 2. Number of bars for calculation The   starting bar   is the bar which drawing of the trend lines will begin, while the   number of bars for c
FREE
Rainbow MT5
Jamal El Alama
4 (1)
Description : Rainbow MT5 is a technical indicator based on Moving Average with period 34 and very easy to use. When price crosses above MA and MA changes color to green, then this is a signal to buy. When price crosses below MA and MA changes color to red, then this is a signal to sell. The Expert advisor ( Rainbow EA MT5 ) based on Rainbow MT5 indicator is now available here . MT4 version is available here .
FREE
PZ Penta O MT5
PZ TRADING SLU
3.8 (5)
The Penta-O is a 6-point retracement harmonacci pattern which usually precedes big market movements. Penta-O patterns can expand and repaint quite a bit. To make things easier this indicator implements a twist: it waits for a donchian breakout in the right direction before signaling the trade. The end result is an otherwise repainting indicator with a very reliable trading signal. The donchian breakout period is entered as an input. [ Installation Guide | Update Guide | Troubleshooting | FAQ | A
FREE
PROMETHEUS TECHNICAN VERSION Free | By THE SONS A gift from The Sons — no strings, no trial, no expiry. Every trader deserves access to professional-grade market intelligence. That belief is why Prometheus Technical Version exists, and why it costs nothing. Consider it our handshake to the trading community. What You're Getting This is not a simplified tool dressed up as a gift. Prometheus Technican Version is a fully built, institutional-quality technical analysis indicator running a dual-model
FREE
RSI abcd
Francisco Gomes Da Silva
3.75 (4)
RSI ABCD Pattern Finder: Strategia Tecnica 1. Come Funziona l'Indicatore Combina il RSI classico con il rilevamento automatico di pattern armonici ABCD . Componenti Principali RSI standard (periodo regolabile) Marcatori di massimi e minimi (frecce) Pattern ABCD (linee verdi/rosse) Filtri ipercomprato (70) e ipervenduto (30) 2. Configurazione su MT5 period = 14 ; // Periodo RSI size = 4 ; // Dimensione massima del pattern OverBought = 70 ; // Livello ipercomprato OverSold = 30 ; // Livello iperve
FREE
LT Donchian Channel
Thiago Duarte
4.86 (7)
Donchian Channel is an indicator created by Richard Donchian. It is formed by taking the highest high and the lowest low of the last specified period in candles. The area between high and low is the channel for the chosen period. Its configuration is simple. It is possible to have the average between the upper and lower lines, plus you have alerts when price hits one side. If you have any questions or find any bugs, please contact me. Enjoy!
FREE
Important Lines
Terence Gronowski
4.88 (24)
This indicator displays Pivot-Lines, preday high and low, preday close and the minimum and maximum of the previous hour. You just have to put this single indicator to the chart to have all these important lines, no need to setup many single indicators. Why certain lines are important Preday high and low : These are watched by traders who trade in a daily chart. Very often, if price climbs over or falls under a preday low/high there is an acceleration in buying/selling. It is a breakout out of a
FREE
Easy Correlations Indicator The Easy Correlations Indicator is designed to help traders analyze the relationship between two correlated instruments. By monitoring the distance between their Relative Strength Index (RSI) values, the indicator highlights situations where one instrument has moved significantly further than the other. This creates potential trading opportunities: Sell the stronger instrument (overstretched RSI) Buy the weaker instrument (lagging RSI) Because the positions are opened
FREE
Multi-timeframe trend indicator based on the ADX / ADXWilder indicator with Fibonacci levels The indicator shows trend areas using ADX or ADXWilder indicator data from multiple timeframes. The impulse mode of the indicator allows you to catch the beginning of a trend, and several "Screens" with different timeframes allow you to filter out market noise. Fibonacci levels are added to the price chart, which have flexible settings. How the indicator works: if PDI is greater than NDI, then   it`s
FREE
Blame The Box
Karim Abdelwahab
Blame The Box is a lightweight session range and breakout analysis indicator engineered specifically for MetaTrader 5. Built to support and enhance your personal trading strategy, it automatically identifies custom intraday consolidation ranges, maps out dynamic breakout levels, and displays real-time position sizing directly on your chart. Important Note: Blame The Box is an analytical and risk-calculation tool designed to assist your own technical analysis and discretionary trading strategy.
FREE
This indicator is especially for the binary trading. Time frame is 1 minutes and exp time 5 or 3 minutes only. You must be use martingale 3 step. So you must put lots size is 10 % at most. You should use Mt2 trading platform to connect with my indicator to get more signal without human working. This indicator wining rate is over 80% but you may get 100% of profit by using martingale 3 step. You should use MT2 Trading Platform to connect meta trader platform and binary platform . You can get mt2
FREE
Daily Support and Resistance Levels è un indicatore professionale che calcola e mostra automaticamente i livelli chiave di prezzo per il trading intraday basato sui Punti Pivot classici. Caratteristiche: Calcolo automatico Pivot (PP) 3 resistenze (R1–R3) 3 supporti (S1–S3) Massimo/Minimo del giorno precedente Pannello informativo in tempo reale Bias di mercato (Rialzista/Ribassista) Distanza ai livelli più vicini Colori e stile personalizzabili Aggiornamento automatico giornaliero Funziona su tu
FREE
Daily Entry M1 – Indicatore MT5 Daily Entry M1 è un indicatore per MetaTrader 5 creato per i trader che si concentrano su opportunità intraday di breve termine sul timeframe M1. L’indicatore analizza le condizioni di mercato e visualizza chiare frecce BUY e SELL direttamente sul grafico quando le sue condizioni interne di ingresso vengono confermate. L’indicatore è progettato per cercare potenziali aree di inversione del mercato e tenta di identificare ingressi vicini a un massimo o minimo intr
FREE
Un MACD che gira mentre il movimento vale ancora la pena. Schaff Trend Cycle MTF passa un MACD per due passate stocastiche, il che lo comprime in un ciclo da zero a cento con inversioni nette e precoci invece della deriva lenta di un MACD, e scatta sull'inversione in uscita da una zona e non su un incrocio. Qualsiasi timeframe superiore su qualsiasi grafico, solo candele superiori chiuse. È gratuito: nessun periodo di prova, nessuna funzione bloccata, nessuna pagina di aggiornamento. Un MACD cos
FREE
Fabii Metro Step RSI
Fabien Georges Andre Guillemaud
Smetti di entrare su oscillazioni di momentum che si invertono una candela dopo. Due linee a gradini, un grafico. No repaint. Qualsiasi coppia, qualsiasi timeframe. Sul tuo grafico in 2 minuti. Test gratuito nello Strategy Tester. Get more indicators here Baselines, volatility filters and oscillators. No repaint. Perché ti serve Vedi girare il Relative Strength Index (RSI) e entri. Poche candele dopo si inverte: il segnale era solo rumore. L'RSI si muove a ogni candela, quindi una piccola osc
FREE
TrendVision AI
Murtadha Majid Jeyad Al-Khuzaie
TrendVision AI – Smart Trend Channels & Price Forecasting for MetaTrader 5 Discover market structure and explore potential future price direction with TrendVision AI, an advanced technical indicator for MetaTrader 5 that combines automatic trendline analysis with a machine-learning-based price forecasting model. How Does TrendVision AI Work? TrendVision AI analyzes historical candlestick data within a configurable lookback window. It automatically draws two trendlines directly on the chart:
FREE
BBMA with EMA50
Teeraporn Satitman
This indicator consist of Standard BBMA Standard signal Sign on chart added EMA50 Behavior Tracking: The chart background changes color based on the EMA50 (default is black) and shifts to white when a breakout of the Bollinger Bands occurs. Three Engulfing Color Change: Automatically adjusts colors to help you easily determine market zones. default yellow/white High-Low Line Sign: Highlights the potential trading range and key price levels for better visual  MHV
FREE
Intraday Spark Chart Overview Intraday Spark Chart is an MT5 indicator for intraday analysis. It converts the current price change of a symbol into a percentage of the daily opening price and plots the result in a separate subwindow. Every trading day starts again from the zero line, so each day is drawn as a separate segment and the intraday move of the current day can be observed directly. The indicator is a data visualization tool. It does not generate trading signals and does not provide inv
FREE
Goldcrest Indicator — Free Gold Trading Signals for MetaTrader 5 Engineered for Gold. Built for Precision. Goldcrest Indicator is a free, powerful, and easy-to-use MetaTrader 5 indicator designed to help traders identify potential trading opportunities in the gold market (XAUUSD). Built using the proprietary Goldcrest signal-detection framework, the indicator monitors market conditions and displays clear BUY and SELL signals with entry prices and initial SL references directly on your chart , he
FREE
Coral Indi
Dinh Duong Luong
Coral trend is   a trend-following indicator that is widely popular among FOREX traders . It is usually used as a confluence with other indicators. It uses combinations of moving averages with complex smoothing formulas! It has two configurable parameters: Coefficient   - smoothing ratio (*) Applied price Calculation: Coral = (-0.064) * B6 + 0.672 * B5 - 2.352 * B4 + 2.744 * B3
FREE
Girassol Sunflower MT5 Indicator
Saullo De Oliveira Pacheco
3.86 (7)
This is the famous Sunflower indicator for Metatrader5. This indicator marks possible tops and bottoms on price charts. The indicator identifies tops and bottoms in the asset's price history, keep in mind that the current sunflower of the last candle repaints, as it is not possible to identify a top until the market reverses and it is also not possible to identify a bottom without the market stop falling and start rising. If you are looking for a professional programmer for Metatrader5, please
FREE
Northstar Flow Candles MT5 is a free chart indicator for traders who use Heikin Ashi candles to review trend context. Its purpose is visual analysis, with candle states and optional markers on the MetaTrader 5 chart. This is a visual tool. It does not place trades or provide popup, push or email notifications. Chart context Five candle states: strong bullish, bullish, balanced, bearish and strong bearish. Context settings based on fast and slow exponential moving averages, ADX and ATR-normalize
FREE
Blahtech VWAP MT5
Blahtech Limited
5 (1)
Blahtech VWAP - Volume Weighted Average Price (VWAP) is the ratio of price to total volume. It provides an average price over a specified time interval.  Links [  Install  |  Update  |  Documentation   ] Feature Highlights Configurable VWAP Line Sessions, intervals, anchored or continuous Previous day settlement line Standard Deviation bands Alerts at bar close or real time Automatic Broker or Tick volumes Significantly reduced CPU usage Input Parameters Expert Advisor Mode  - Reserved for iCu
FREE
CosmiCLab SMC FIBO CosmiCLab SMC FIBO is a professional trading indicator designed for traders who use Smart Money Concepts (SMC), market structure analysis and Fibonacci retracement levels. The indicator automatically detects market swings and builds Fibonacci levels based on the latest impulse movement. It also identifies market structure changes such as BOS (Break of Structure) and CHOCH (Change of Character), helping traders understand the current market direction. CosmiCLab SMC FIBO also pr
Gli utenti di questo prodotto hanno anche acquistato
Trend Sniper X
Sarvarbek Abduvoxobov
4.86 (44)
Trend Sniper X è un indicatore trend-following multi-timeframe per MetaTrader 5 che aiuta i trader a identificare la direzione del trend e i potenziali punti di inversione con chiarezza e precisione. per MT4: https://www.mql5.com/en/market/product/193245 Informazioni sul prezzo: Il prezzo attuale è promozionale ed è soggetto a modifiche con il rilascio di futuri aggiornamenti e nuove funzionalità. Offerta Bonus: Per ricevere GRATIS l'Auto-Trade Assistant EA per questo indicatore, invia un messa
Un nuovo Re in città - Indicatore + Gestione ordini (TP1 + TP2 + TP3) + Invio opzionale di segnali Telegram INCLUSO (GRATIS) (SISTEMA COMPLETO DI TRADING e SEGNALI) Il nostro miglior EA per l’Oro: Gold Slayer Questo indicatore include una strategia avanzata, un sistema di trading con gestione ordini personalizzabile e un sistema mean reversion che combina estensioni di envelope, supportato da molteplici filtri intelligenti di conferma come RSI per individuare ingressi di inversione ad alta proba
Smart Trend Trading System — MetaTrader 5 Dopo l'acquisto, inviami un messaggio su MQL5 per ricevere GRATUITAMENTE Smart Universal Expert Advisor, insieme al corso online, al manuale PDF e all'accesso al gruppo privato. STTS riunisce la direzione del trend, i segnali di entrata e uscita, le zone di inversione e i livelli di prezzo importanti direttamente sul grafico. Segui il sistema manualmente oppure collega un EA compatibile separato per eseguire le operazioni automaticamente con le impostazi
Entry Points Pro vi mostra dove entrare, dove mettere lo stop e con quale lotto operare — prima di piazzare l'ordine. PREZZO Ora 199 USD: 8 copie a questo prezzo, poi 249 USD. Il prezzo finale è di 349 USD. Guadagno facendo trading sui mercati e lo dimostro, quindi non ho bisogno di vendere questo indicatore a tutti. È uno strumento per trader che ragionano con la propria testa, non un pulsante magico. Nessuna rottura, nessun trade. Una freccia grigia è un segnale annullato: il prezzo non ha ro
Zoryk Gold
Reda El Koutbane
4.79 (19)
ZORYK — Sistema avanzato di segnali XAUUSD per MetaTrader 5 Conosci sicuramente questa sensazione. Passi molto tempo ad analizzare l’oro. Aspetti il punto d’ingresso corretto. Finalmente apri l’operazione e il prezzo inizia immediatamente a muoversi contro di te. Chiudi troppo presto, sposti lo Stop Loss o esiti per alcuni secondi. Successivamente il mercato raggiunge esattamente l’obiettivo che avevi previsto inizialmente, ma senza di te nella posizione. Il problema non era sempre la direzione.
M5 Sniper
MeanFX
5 (4)
Porta il tuo vantaggio nel trading sotto i riflettori! M5 Sniper è un nuovo indicatore di MeanFX. Combina segnali di trading precisi con livelli TP/SL adattivi , creando così le migliori operazioni statistiche possibili! Il prezzo aumenta ogni 5 acquisti, il prossimo prezzo è di 69$ Scrivimi dopo l'acquisto per ricevere consigli/guida e un EA bonus Cosa lo rende diverso? Performance statistica comprovata su Gold XAUUSD ( funziona su quasi ogni asset , concentrandosi sulla padronanza di un singol
Gann Made Easy è un sistema di trading Forex professionale e facile da usare che si basa sui migliori principi del trading utilizzando la teoria di mr. WD Gann. L'indicatore fornisce segnali ACQUISTA e VENDI accurati, inclusi i livelli di Stop Loss e Take Profit. Puoi fare trading anche in movimento utilizzando le notifiche PUSH. CONTATTAMI DOPO L'ACQUISTO PER RICEVERE GRATUITAMENTE LE ISTRUZIONI DI TRADING E OTTIMI INDICATORI EXTRA! Probabilmente hai già sentito parlare molte volte dei metodi d
SuperScalp Pro
Van Minh Nguyen
4.54 (37)
SuperScalp Pro - Professional Multi-Layer Confluence Scalping System SuperScalp Pro è un indicatore di scalping avanzato che potenzia il Supertrend classico con diversi filtri intelligenti di conferma. Aiuta a individuare opportunità di trading Buy/Sell con una maggiore probabilità di successo, riducendo significativamente i falsi segnali. Le frecce Buy e Sell vengono visualizzate chiaramente direttamente sul grafico, insieme ai livelli di Stop Loss e Take Profit basati sull’ATR, calcolati autom
Ultra Indicator
Ihor Otkydach
5 (1)
ULTRA è un indicatore tecnico che funziona secondo un approccio “tutto in uno”: analizza autonomamente il mercato, genera segnali di trading, visualizza i livelli per l’impostazione degli ordini stop-loss e suggerisce quando chiudere le operazioni per realizzare profitti o ridurre al minimo le perdite. In altre parole, non importa se non sai come analizzare il mercato, determinare i livelli — dove impostare lo stop-loss — o se hai difficoltà con la gestione del capitale. ULTRA farà tutto questo
Gold Trend Coach MT5
Cristhian Alexander Gaibor Cuasquer
4.27 (11)
Segnali di acquisto e vendita senza repaint sull'oro (XAUUSD) per MetaTrader 5. Ogni segnale arriva con stop loss e tre take profit. Un filtro Smart Money Concepts con BOS e CHoCH, così operi a favore della struttura, non contro. Un Mentor live sul pannello che ti guida passo dopo passo dall'ingresso fino al TP3. E alert direttamente sul tuo telefono e sul tuo canale Telegram. Questo è Gold Trend Coach. Mai più da solo davanti al grafico. KIT ACQUIRENTE GRATIS con il tuo acquisto: 1. Telegram A
GoldenX Entry MT5
VividMind Digital Solutions
5 (17)
GoldenX Entry è un indicatore per MT5 con un algoritmo adattivo Smart Entry Trend, un sistema di scoring dei segnali, un rilevatore del regime di mercato e un filtro di volatilità. Ogni segnale include un livello di ingresso calcolato, tre livelli di Take-Profit (TP1, TP2, TP3) e un livello di Stop-Loss. È costruito su più livelli analitici progettati per adattarsi a diverse condizioni di mercato, combinando un sistema analitico multilivello con un ottimizzatore integrato e un sistema di traccia
SMC Intraday Formula
VividMind Digital Solutions
5 (26)
Cominciamo con la verità. Nessun indicatore da solo ti renderà profittevole. Se qualcuno ti dice il contrario, ti sta vendendo un sogno. Qualsiasi indicatore che mostra frecce perfette di acquisto/vendita può essere reso impeccabile — basta ingrandire la giusta sezione della storia e catturare solo i trade vincenti. Noi non lo facciamo.  SMC Intraday Formula è uno strumento. Legge la struttura del mercato per te, identifica le zone a più alta probabilità e ti mostra esattamente come appare la t
Boba Analysis Suite
Trade Ready Solutions LLC
5 (2)
Boba Analysis Suite Boba Analysis Suite è un indicatore di analisi per MetaTrader 5. Riunisce la struttura del mercato, le zone di prezzo rilevanti e il contesto generale del mercato in un’unica visualizzazione del grafico. Sviluppato sulla base dell’esperienza pratica come trader e formatore di trading, supporta un processo di analisi strutturato: valutare la direzione del mercato, individuare livelli importanti e analizzare congiuntamente più intervalli temporali. Analisi nel contesto del merc
FX Power MT5 NG
Daniel Stein
5 (33)
FX Power: Analizza la Forza delle Valute per Decisioni di Trading Più Intelligenti Panoramica FX Power è lo strumento essenziale per comprendere la reale forza delle principali valute e dell'oro in qualsiasi condizione di mercato. Identificando le valute forti da comprare e quelle deboli da vendere, FX Power semplifica le decisioni di trading e rivela opportunità ad alta probabilità. Che tu segua le tendenze o anticipi inversioni utilizzando valori estremi di Delta, questo strumento si adatta
Gold Entry Sniper
Tahir Mehmood
5 (23)
Gold Entry Sniper – Dashboard ATR Multi-Timeframe per Scalping e Swing Trading sull’Oro Gold Entry Sniper è un indicatore avanzato per MetaTrader 5 che offre segnali di acquisto/vendita precisi per XAUUSD e altri strumenti, basato sulla logica ATR Trailing Stop e l' analisi multi-timeframe . Caratteristiche e Vantaggi Analisi Multi-Timeframe – Visualizza trend su M1, M5, M15 in un'unica dashboard. Trailing Stop Basato su ATR – Stop dinamici che si adattano alla volatilità. Dashboard Professional
M1 Sniper MT5
Oleg Rodin
5 (7)
M1 SNIPER   è un sistema di indicatori di trading facile da usare. Si tratta di un indicatore a freccia progettato per l'intervallo temporale M1. L'indicatore può essere utilizzato come sistema autonomo per lo scalping sull'intervallo temporale M1 e come parte del tuo sistema di trading esistente. Sebbene questo sistema di trading sia stato progettato specificamente per il trading sull'intervallo temporale M1, può comunque essere utilizzato anche con altri intervalli temporali. Inizialmente ho p
FiboSniper Pro
Van Minh Nguyen
5 (4)
FiboSniper Pro – Multi-Filter Fibonacci System with Auto SL/TP and Control Panel FiboSniper Pro è un indicatore tecnico che combina Fibonacci Envelopes dinamici con diversi filtri di conferma per generare segnali Buy e Sell selezionati. I livelli di Fibonacci vengono calcolati sulla base di Moving Average e ATR e successivamente filtrati tramite ADX, EMA, RSI, ATR, Volume, Time e struttura delle candele. L’indicatore visualizza direttamente sul grafico i livelli automatici di Stop Loss e Take Pr
Apex Patterns PRO Acquista l'indicatore - Ottieni GRATUITAMENTE l'Expert Advisor basato su di esso. Intelligenza auto-ottimizzante per pattern grafici e breakout Gli scanner di pattern tradizionali si basano su input fissi, registrando spesso prestazioni inferiori quando la volatilità e le strutture del mercato cambiano. Apex Patterns PRO è progettato per adattarsi alle mutevoli condizioni di mercato combinando il riconoscimento dei pattern grafici strutturali, il filtraggio del momentum e l'au
Auto Optimized SpeedAngle è un sistema di vettorizzazione del momento di livello istituzionale che elimina l'overfitting ( curve-fitting ) attraverso l'ottimizzazione continua Walk-Forward (WFO). Invece di affidarsi a input statici che si degradano quando i regimi di mercato cambiano, l'indicatore recalibra dinamicamente i suoi parametri utilizzando la validazione Out-of-Sample (OOS), assicurando che i segnali visualizzati rappresentino reali vantaggi statistici anziché anomalie storiche. Quadro
SQN Max indicator for MT5 by ITC
Renaud Herve Francois Candel
Sqn Max Indicator Sqn Max is an exclusive indicator to trade the market with high effectiveness. The indicator is based on price action, volatility and trend. This indicator is as simple as possible but not too simple. The indicator can generate alerts to ease the trading process. You don't have to stay all day in front of your screen. The indicator can be used with any class of assets and with any time frame. It is possible to achieve better results trading our list of selected assets. We achi
Prossimo aggiornamento — Versione 2.52 in arrivo! [NOVITÀ] Preparati a 4 nuove funzionalità principali progettate per migliorare la tua analisi di mercato e il tuo flusso di lavoro nel trading Portiamo l’analisi di mercato a un livello superiore con 4 nuove funzionalità progettate per soddisfare le tue esigenze di trading. Ecco le novità: 1. TRADE OVERVIEW DASHBOARD 2. CONFLUENCE AT ZONE 3. STRONG & WEAK HIGH/LOW 4. OTE 1. TRADE OVERVIEW DASHBOARD Una dashboard che ti aiuta a comprendere più fa
Divergence Bomber
Ihor Otkydach
4.89 (94)
Ogni acquirente dell’indicatore riceverà inoltre gratuitamente: L’utilità esclusiva “Bomber Utility”, che gestisce automaticamente ogni operazione, imposta i livelli di Stop Loss e Take Profit e chiude le posizioni secondo le regole della strategia I file di configurazione (set file) per adattare l’indicatore a diversi asset I set file per configurare il Bomber Utility in tre modalità: “Rischio Minimo”, “Rischio Bilanciato” e “Strategia di Attesa” Una guida video passo-passo per installare, con
Power Candles MT5
Daniel Stein
4.58 (12)
Power Candles V3 - Indicatore di forza ad ottimizzazione automatica Power Candles V3 trasforma la forza delle valute e degli strumenti in un piano di trading attuabile su ogni grafico a cui è collegato. Invece di limitarsi a colorare le candele, esegue un'auto-ottimizzazione in tempo reale in background e ti fornisce i migliori valori di Stop Loss, Take Profit e soglia di segnale per il simbolo che hai davanti. Basta un clic per adottarlo nel trading live: i raggi di ingresso, Stop Loss e Take P
Currency Strength Wizard   è un indicatore molto potente che ti fornisce una soluzione all-in-one per un trading di successo. L'indicatore calcola la potenza di questa o quella coppia forex utilizzando i dati di tutte le valute su più intervalli di tempo. Questi dati sono rappresentati in una forma di indice di valuta facile da usare e linee elettriche di valuta che puoi utilizzare per vedere il potere di questa o quella valuta. Tutto ciò di cui hai bisogno è collegare l'indicatore al grafico ch
Atomic Analyst MT5
Issam Kassas
4.51 (65)
Atomic Analyst — MetaTrader 5 Dopo l'acquisto, inviami un messaggio su MQL5 per ricevere GRATUITAMENTE Smart Universal Expert Advisor, insieme al corso online, al manuale PDF e all'accesso al gruppo privato. Atomic Analyst riunisce l’azione del prezzo, la direzione del trend, i segnali di entrata e uscita, lo Stop Loss e diversi livelli di Take Profit direttamente sul grafico. INDIVIDUA IL SEGNALE. COMPRENDI IL CONTESTO OPERATIVO. Atomic Analyst organizza la sua analisi in informazioni visive ch
Unix Scalper
Issam Kassas
4 (4)
Unix Scalper — MetaTrader 5 Dopo l'acquisto, inviami un messaggio su MQL5 per ricevere GRATUITAMENTE Smart Universal Expert Advisor, insieme al corso online, al manuale PDF e all'accesso al gruppo privato. Individua il setup. Esamina il piano. Scegli come operare. UNIX Scalper riunisce analisi di mercato, indicazioni BUY/SELL/WAIT e livelli Entry, Stop Loss, TP1 e TP2 in un unico pannello organizzato. VISUALIZZA IL SEGNALE E IL PIANO • Indicazioni chiare: BUY, SELL o WAIT. • Livelli definiti: E
Astral Structure
Ottaviano De Cicco
Astral Structure Valuta il setup. Osserva il piano iniziale. Offerta di lancio - $99. $149 dopo il lancio. Un setup di struttura pone più domande insieme: il quadro più ampio concorda, dove si trova il riferimento di stop e come sono definiti i target? Astral Structure riunisce queste domande in un unico spazio per i trader discrezionali che basano le proprie decisioni sulla struttura del mercato. Concentrati sul setup rilevante. Esamina insieme l'ultimo setup idoneo, la sua direzione e la sua q
Tokyo mt5 Indicator
Vasiliy Strukov
5 (15)
Il Tokyo Indicator offre una chiara panoramica visiva della direzione del trend, dei potenziali segnali di trading e delle condizioni di mercato. La sua linea di trend a gradini, codificata a colori, distingue le fasi rialziste (in blu) da quelle ribassiste (in magenta). Frecce direzionali dedicate evidenziano potenziali opportunità di acquisto e vendita al variare del trend visualizzato. Una dashboard integrata riunisce in un'unica visualizzazione pratica il segnale corrente, il bias di mercato
Indicatore multi-valuta di forza e momentum MT5 Dynamic Forex28 Navigator è l'evoluzione dei nostri indicatori popolari da lunga data, che riunisce la potenza di cinque in uno: Advanced Currency Strength28 Indicator (700 recensioni) Advanced Currency IMPULSE with ALERT (530 recensioni) Currency Strength EXOTICS GOLD Impulse with Alert CS28 Combo Signals (bonus attuale) Non serve acquistare quattro indicatori e impilarli sui grafici. Tutto è riunito in un solo indicatore potente: la forza delle 2
Scalper Vault è un sistema di trading potente e completo, progettato per i trader che desiderano ottenere risultati costanti nel trading intraday. Questo indicatore ad alta precisione funge da sistema di trading autonomo, offrendo analisi di livello istituzionale sia per il mercato Forex che per le Opzioni Binarie. CONTATTAMI DOPO L'ACQUISTO PER RICEVERE I MIEI CONSIGLI DI TRADING E UN FANTASTICO BONUS! Eliminando le congetture e le complesse analisi manuali, Scalper Vault ti permette di concen
Altri dall’autore
JKTopHedge
Shi Yuan Wang
JK-Top Hedge — Two-Sided Hedged Grid EA for MetaTrader 5 Overview JK-Top Hedge is an Expert Advisor for MetaTrader 5. It places a Buy Stop above the current price and a Sell Stop below it at the same time, building two grid lines on either side of the market. When one pending order is filled, the EA places the next one further away, and the cycle repeats. Because long and short positions exist at the same time, a floating loss on one side can partly be offset by the other. The EA closes or reduc
Automatic Support and Resistance Levels with Breakout Tracking Product name note: the file name and the indicator short name in the source are AutomaitcSR . The correct spelling AutomaticSR is recommended before submission. Use one identical name for the file, the short name and the Market product title. Short description (for the Market product card) Automatic support and resistance levels built from confirmed swing pivots, with ATR-based filtering, optional level zones, breakout marking and a
FREE
High Time Candlestick Chart Visualize the current higher-timeframe candle directly on your lower-timeframe chart. This indicator projects the OHLC data of a selected higher timeframe ​ (M15, H1, H4, D1, or W1) onto your current chart as a graphical candlestick, offset to the right of the live price area. It helps you keep the bigger-picture candle structure in view without switching timeframes. Features Graphical HTF candle : Body, upper wick, and lower wick drawn as chart objects, colored by bu
FREE
SweepReversalMap — Indicatore di mappatura delle zone di inversione dopo sweep di liquidità Panoramica SweepReversalMap è un indicatore personalizzato basato sul Price Action, progettato per identificare eventi di «Liquidity Sweep» (sweep di liquidità) nel mercato e mappare potenziali zone di inversione dopo il reclaim del prezzo. L’indicatore è adatto a qualsiasi strumento e timeframe. Logica principale Rilevamento dei punti swing: in base allo Swing Length impostato dall’utente, vengono ident
FREE
FibonacciSuite
Shi Yuan Wang
5 (1)
Fibonacci Confluence Suite Short description Fibonacci Confluence Suite is a chart-window indicator for MetaTrader 5. It builds a Fibonacci grid from confirmed swing highs and lows, marks the levels where projections from earlier swings overlap, and adds a Golden Pocket zone, Fibonacci time zones, touch statistics and a compact status panel. All levels are calculated from closed bars only. Overview Drawing retracement levels by hand usually means three separate steps: finding the swing, pulling
FREE
RSICloud
Shi Yuan Wang
RSI Cloud — RSI Dual Moving Average Cloud Indicator This indicator calculates RSI in a separate window, applies fast and slow moving averages to the RSI values, and displays the relative position of the two averages as a filling cloud. It also provides an optional raw RSI line, fixed 70/50/30 reference levels, and arrow markers when the fast and slow RSI averages cross. The indicator is for analysis and signal filtering only; it does not place trades. How it works Wilder RSI is calculated from
FREE
SR Power Channel — Support & Resistance Power Channel Indicator Overview SR Power Channel is a main-chart visual indicator built on price extremes and ATR. It locates the highest high (resistance) and the lowest low (support) within a configurable lookback window, extends those two levels to the right, and wraps them into ATR-based channel bands. The indicator also counts bullish and bearish bars inside the window and marks the moments when price breaks above or below the channel bands with dia
FREE
BBOscillator — Candle Coloring with Andean Oscillator States and ATR Stop Levels Overview BBOscillator is a technical indicator for MetaTrader 5 that is drawn in the main chart window. It combines the Andean Oscillator state logic, candle coloring, dynamic ATR stop levels and state-change marks in a single visual layer, so that four questions can be answered by looking at one chart: whether the direction is defined, which side it leans to, where the direction state started, and where a stop refe
FREE
TrendReferenceLine — Adaptive Trend Line with ATR Channel and Auto Trade Levels Short description: ​ An adaptive trend line indicator that switches color with trend direction, marks confirmed reversals with arrows, and automatically plots entry, stop loss and three R-multiple targets on the chart. Type: ​ Trend-following technical analysis indicator (not an automated trading robot). What it does In trend trading, three questions matter most: has the direction changed, where does the stop go, and
FREE
RSI Support Resistance Signals Platform: MetaTrader 5 RSI Support Resistance Signals adds zone coloring and signal labels to the standard RSI. The indicator does not execute trades. Signals: Sell: RSI is in the overbought zone and turns down, or RSI is in the resistance zone and a bearish candle with an upper wick is detected. Buy: RSI is in the oversold zone and turns up, or RSI is in the support zone and a bullish candle with a lower wick is detected. Each signal can show a user-defined Engli
FREE
HubDynamicTrendLine This indicator identifies strict pivot highs and lows based on N bars to the left and right (default 15), connecting consecutive pivots of the same type to build a dynamic channel with upper and lower boundaries. Key Features Pivot Connections : Consecutive pivot highs and pivot lows are connected with solid trend lines, forming a visible channel structure. Slope Projection : When the price difference between two consecutive pivots of the same type is at least one 200-period
FREE
Dual Period Filter — Adaptive Coppock Curve for MT5 Overview The Coppock Curve is built from the sum of a long and a short rate of change, smoothed afterwards, and is used to observe the direction and strength of medium-term momentum. This indicator extends the classic calculation in two ways. First, the price source passes through an optional adaptive filter before the momentum is calculated. Nine filter types are available: None, SMA, EMA, RMA, Double WMA, Triple VWMA, HMA, LLAMA and Kalman.
FREE
Trend Pressure Oscillator Trend Pressure Oscillator is a separate-window analytical indicator for MetaTrader 5. It evaluates buying and selling pressure across multiple timeframes to help identify potential exhaustion points and market regime shifts. This tool does not generate trading signals automatically and does not execute trades. It is designed to be used as part of a broader technical analysis approach. Functionality Multi-range pressure analysis using Williams %R over three periods (Pul
FREE
EF Percentage Channel A trend-state indicator that combines volatility-adaptive averaging, an Ehlers nonlinear filter, and statistical percentile bands into a single, self-adjusting channel. Overview The indicator builds an adaptive trend baseline on the chart and wraps it with statistical percentile bands. When price moves above the upper band, the market is flagged as bullish; below the lower band, bearish; inside the channel, the previous state is retained. The trend line, channel bands, cand
FREE
RSI Adaptive T3 Short description RSI Adaptive T3 is a trend and momentum indicator for MetaTrader 5. It is drawn directly on the price chart and combines two elements: a T3 moving average whose smoothing length changes automatically with the value of the RSI, and a second copy of the same line delayed by two bars. The gap and the crossing between these two lines show the current direction and short-term changes in momentum. Optional volatility bands and crossover markers complete the picture. W
FREE
Intraday Spark Chart Overview Intraday Spark Chart is an MT5 indicator for intraday analysis. It converts the current price change of a symbol into a percentage of the daily opening price and plots the result in a separate subwindow. Every trading day starts again from the zero line, so each day is drawn as a separate segment and the intraday move of the current day can be observed directly. The indicator is a data visualization tool. It does not generate trading signals and does not provide inv
FREE
MA Valuation Fluctuations measures how far the current price stands from its moving average. The deviation is expressed in units of dispersion and then compressed by a hyperbolic tangent into a fixed range from -1.0 to +1.0. The indicator is drawn in a separate window and can be used as a context filter next to a trend following or a mean reversion approach. What the indicator shows For every bar the indicator compares the selected price with a moving average in logarithmic terms. Because the r
FREE
Trendfollowingline (ATR Based Trend Following Indicator) Overview Trendfollowingline is a trend following indicator drawn in the main chart window. It uses the Average True Range (ATR) as a measure of market volatility and plots a band around the price: while the direction is up, the band is placed below the price and moves upwards; when the direction turns down, the band switches above the price and moves downwards. An arrow marker is drawn on the band each time the direction changes. The indic
FREE
Deviation Trend Profile Overview Deviation Trend Profile is a MetaTrader 5 chart indicator that combines three visual layers in a single chart window: a moving average with momentum-based coloring, deviation bands calculated from volatility, and a horizontal distribution profile drawn to the right of the current price. The indicator is an analytical tool. It does not open, modify or close trades, and it is not a complete trading system. It is designed to help the user observe trend direction, mo
FREE
ZigZag Trader EA - Intelligent ZigZag Trading Assistant Introduction ZigZag Trader EA is a fully automated trading assistant based on the ZigZag indicator. It intelligently identifies previous highs and lows of the ZigZag indicator, combined with an advanced risk management system, to provide you with precise trading signals and automated trade execution. Whether you are a novice or experienced trader, ZigZag Trader EA can help you simplify trading decisions and achieve stable trading performa
FREE
Overview QuantifiedTrends is a MetaTrader 5 indicator that runs in a separate chart sub-window. It describes momentum conditions through three calculation layers: Primary QQE layer: an RSI-based structure that uses smoothing and the smoothed RSI's own variation to build adaptive upper and lower bands and a primary QQE trend line. Statistical envelope layer: Bollinger Bands applied to the deviation of the primary QQE trend line from the 50 midline, used to determine whether primary momentum readi
FREE
Inverse Probability Distribution — Pivot Density and K-Means Clustering Indicator Platform: MetaTrader 5 Overview This indicator is a technical analysis visualization tool for MetaTrader 5. It identifies confirmed pivot highs and lows on historical bars, groups pivot prices with K-Means clustering, and draws an inverse distribution profile on the right side of the chart. The profile shows the density of historical pivot prices at different price levels. The indicator does not generate trading s
FREE
Adaptive MACD - R² Based Adaptive MACD Indicator Overview Adaptive MACD is an innovative MetaTrader 5 indicator that improves upon the traditional MACD. By introducing the Pearson correlation coefficient to calculate the R² value of price trends, this indicator can adapt to market conditions and dynamically adjust its sensitivity. It helps traders capture trends more effectively while filtering out market noise. How It Works Traditional MACD uses a fixed difference between fast and slow EMAs. Ad
FREE
MACandleApprox — Moving-Average Approximate Candle Indicator MACandleApprox is a custom indicator that, on the main price chart, applies a selected type of moving average to the open, high, low, and close price series respectively, and replots them as "approximate candles". It does not modify the original candlesticks; instead, it overlays a smoothed candle view based on moving averages, helping traders observe the smoothed price movement and directional changes more intuitively. The indicator s
FREE
# MASignalPanel — Multi-MA Signal Panel with Trend Filter ## Overview MASignalPanel is an all-in-one moving-average signal indicator designed for MetaTrader 5. It combines up to three moving averages (SMA, EMA, SMMA, LWMA) with four trade signal modes — Cross, Breakout, Pullback and Channel — and adds a higher-timeframe trend filter line (default EMA240) to keep you on the right side of the market. A fully interactive control panel lets you change MA type, MA count, periods, s MA indicator, movi
FREE
MACandleApproxPro — Advanced MA Candle Reconstruction & Multi-Dimensional Market Structure Indicator Overview MACandleApproxPro ​ is a comprehensive technical analysis tool designed for professional traders. It breaks through the limitations of traditional moving averages by reconstructing MA data into "MA Candles" ​ through complex algorithms. This unique visualization filters out market noise, allowing you to examine price trends, momentum shifts, and critical market structures from a more
JKTaurus
Shi Yuan Wang
JK-Taurus Expert Advisor A grid-based scaling EA driven by trend and signal confirmation. Overview JK-Taurus is a fully automated trading system designed specifically for the MT5 platform. It integrates multi-timeframe trend analysis, signal confirmation, and a dynamic grid-based position-building strategy, aiming to capture sustained profit opportunities during trending market conditions. The EA features an intuitive visual dashboard, allowing users to monitor account status in real-time and in
Adaptive filtering trend Overview Adaptive filtering trend is a multi-layer signal filtering indicator for the MetaTrader 5 platform, built on the Coppock curve. The indicator computes a long-period and a short-period Rate of Change (ROC) of the price, sums them, and smooths the sum with a Weighted Moving Average (WMA) to obtain the Coppock curve. A set of independently switchable filters is then applied to screen the signals, and bullish or bearish crossings are marked on the main chart throug
JKEFAdvancedModel — Volatility-Adaptive Trend Breakout Trading System Overview JKEFAdvancedModel is a fully automated Expert Advisor for MetaTrader 5. On the selected timeframe it adapts to market volatility to follow the trend and trade breakouts. The system evaluates the state of closed bars only, so signals are not revised by an unfinished bar. Once a direction is confirmed, the robot can enter with a market order or place a stop order at a defined distance from the current price and wait for
JKEFtrendMartingale — Volatility-Adaptive Trend-Following Martingale Trading System Overview JKEFtrendMartingale is a fully automated Expert Advisor for MetaTrader 5. On the selected timeframe it adapts to market volatility to follow the trend and trade breakouts. After a losing trade it increases the lot size of the next trade according to the configured rule, and returns to the initial lot size once profits have absorbed the accumulated loss. The system evaluates the state of closed bars only,
Filtro:
Nessuna recensione
Rispondi alla recensione