DeviationTrendProfile
- Индикаторы
-
Shi Yuan Wang
 Я разрабатываю собственные индикаторы, советники (Expert Advisors, EA), скрипты и торговые инструменты для MetaTrader 4 и MetaTrader 5, а также индикаторы для TradingView (Pine Script).
Что я могу для вас сделать: - Версия: 1.4
Deviation Trend Profile
Overview
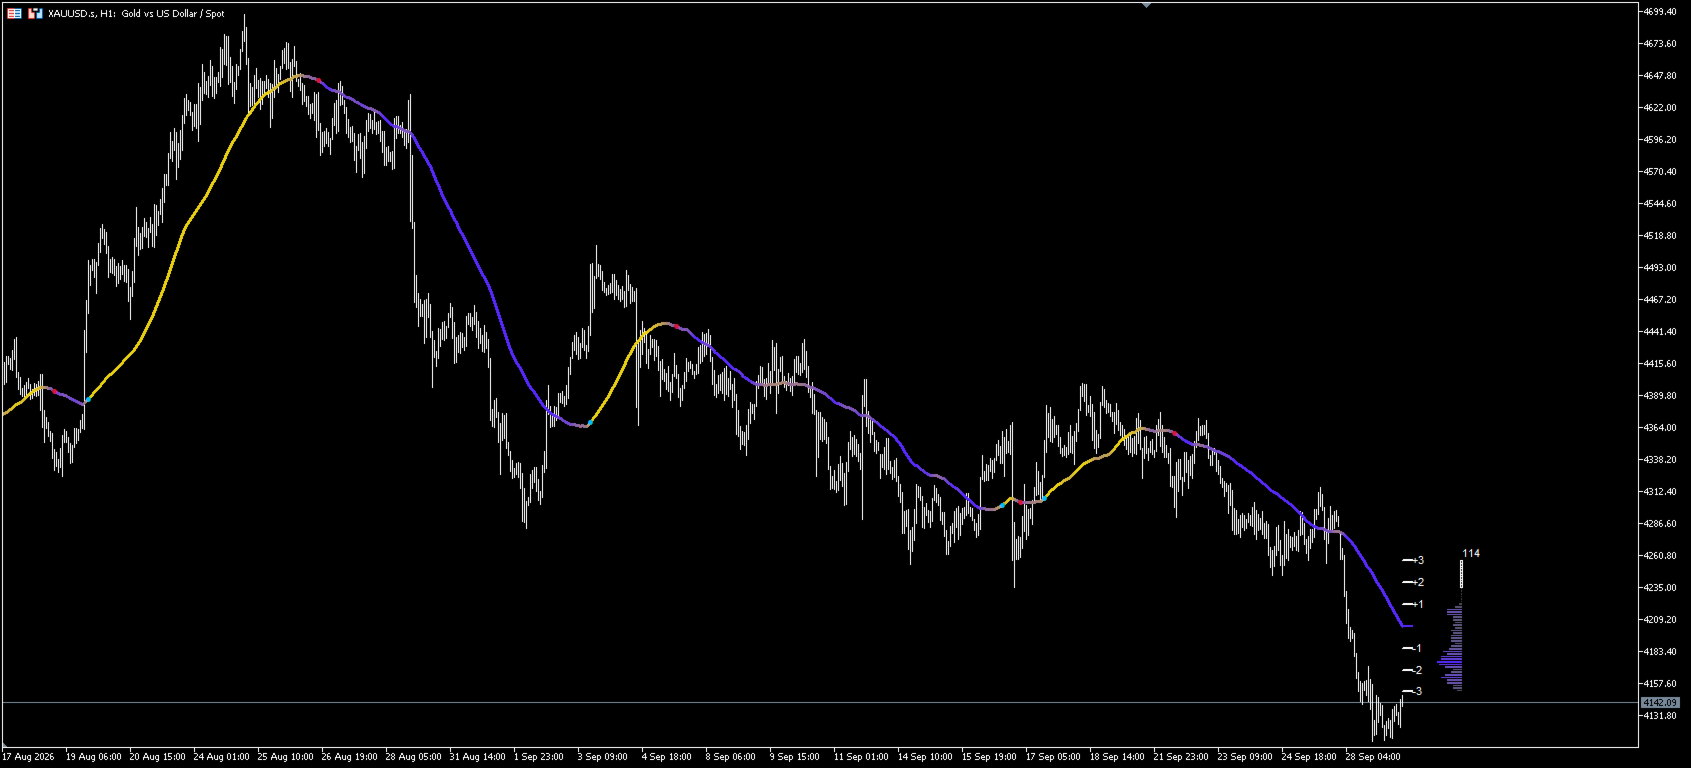
Deviation Trend Profile is a MetaTrader 5 chart indicator that combines three visual layers in a single chart window: a moving average with momentum-based coloring, deviation bands calculated from volatility, and a horizontal distribution profile drawn to the right of the current price.
The indicator is an analytical tool. It does not open, modify or close trades, and it is not a complete trading system. It is designed to help the user observe trend direction, momentum strength and price distribution inside a volatility range.
What the indicator shows
1. Colored moving average
A simple moving average is drawn in the main chart window. Its color changes continuously between the two user-defined colors according to the normalized momentum of the average. When the average accelerates upward, the line moves toward the positive color; when it accelerates downward, it moves toward the negative color. The transition is smooth, so the user can see the strength of the current move without reading numerical values.
2. Deviation bands
Six short horizontal lines are drawn to the right of the last bar at the levels of the moving average plus and minus one, two and three volatility units. A seventh line marks the moving average itself and takes the current momentum color. Each band is labeled, so the distance between price and the average can be read directly in volatility units. The bands are extended a few bars to the right for readability.
3. Direction change markers
When the normalized momentum crosses the internal positive threshold from below, an upward marker is placed on the moving average. When it crosses the internal negative threshold from above, a downward marker is placed. Markers appear only at the moment of change, not on every bar, and they are drawn at the moving average value, not at the candle extreme.
4. Distribution profile
Starting from the bar of the most recent direction change marker, the indicator counts how closing prices were positioned inside their own deviation range and draws the result as a horizontal histogram on the right side of the chart, using the price scale of the current deviation range. Longer bars mean more closing prices were observed at that level. Bar color changes gradually with the count, so the busiest levels stand out. A small label above the profile shows the number of bars included in the calculation.
The profile can be turned off. It is updated only when its content actually changes, which keeps the chart responsive.
How to use it
Attach the indicator to any symbol and timeframe. It works in the main chart window together with other indicators.
A typical reading sequence:
- Look at the moving average color to judge the direction and strength of the current move.
- Look at the direction change markers to find where the current directional phase started.
- Use the deviation bands to see how far price is from the average, expressed in volatility units.
- Read the distribution profile to see where price spent most of its time since the last direction change.
The indicator is suitable for users who follow trends and want a compact view of direction, momentum and distribution, as well as for users who watch mean-reversion behavior and want to see how far price has stretched away from the average.
It is not intended for users who are looking for automated entries and exits, position management or trade execution. All trading decisions remain with the user.
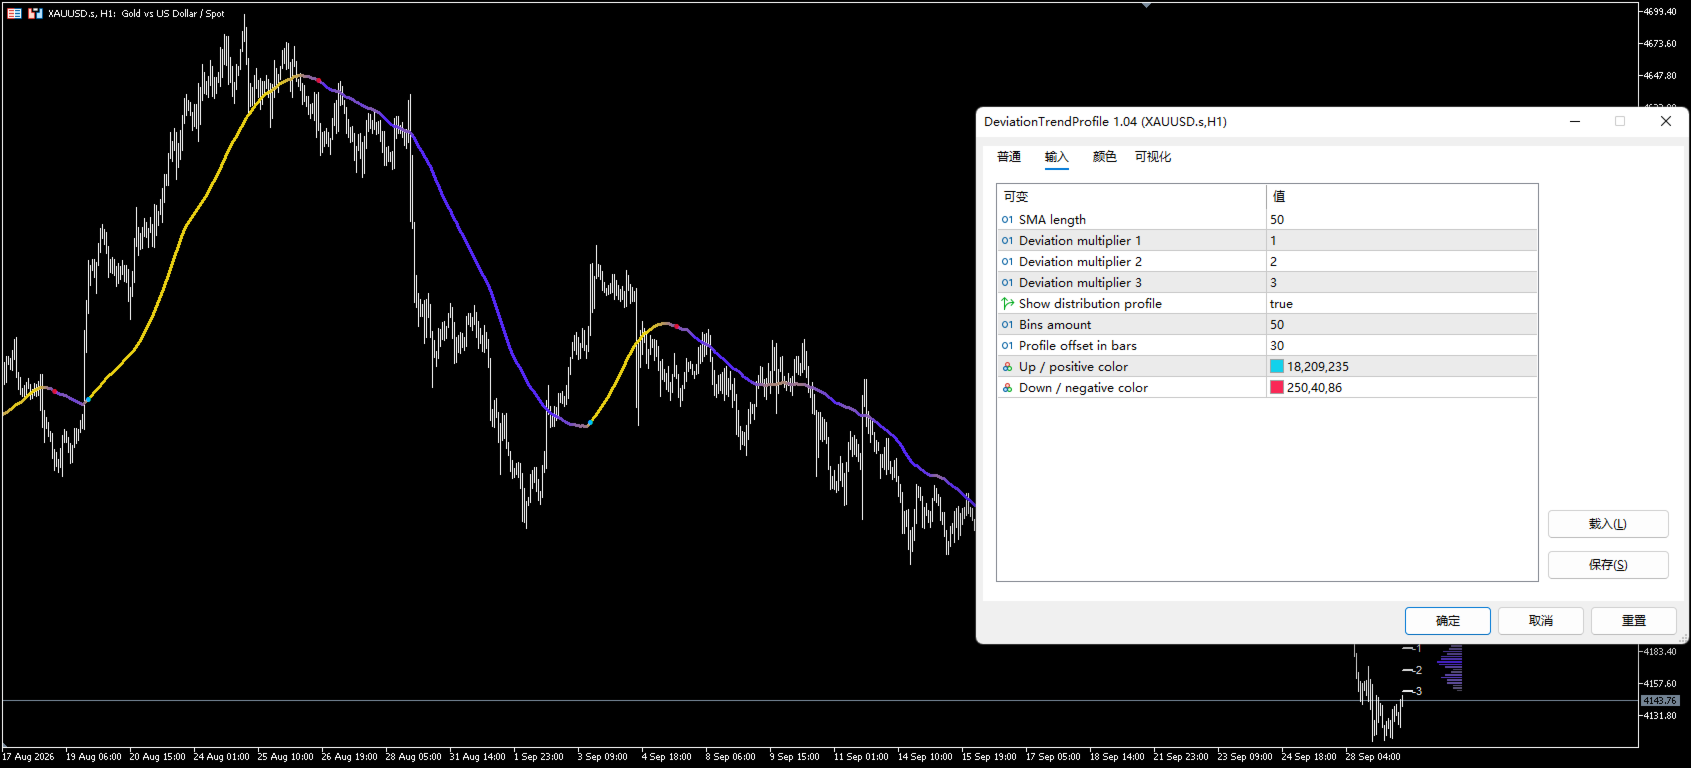
Input parameters
Core calculation
Parameter | Default | Description |
|---|---|---|
SMA length | 50 | Period of the simple moving average used as the base line. |
Deviation multiplier 1 | 1 | Multiplier for the first deviation band on both sides. |
Deviation multiplier 2 | 2 | Multiplier for the second deviation band on both sides. |
Deviation multiplier 3 | 3 | Multiplier for the third deviation band on both sides. |
Distribution profile
Parameter | Default | Description |
|---|---|---|
Show distribution profile | true | Enables or disables the horizontal distribution profile. |
Bins amount | 50 | Number of horizontal bars used to build the profile. Higher values give finer resolution. |
Profile offset in bars | 30 | Distance between the last bar and the profile, measured in bars. |
Colors
Parameter | Default | Description |
|---|---|---|
Up / positive color | C'18,209,235' | Color used for positive momentum, the upward marker and the top of the profile gradient. |
Down / negative color | C'250,40,86' | Color used for negative momentum, the downward marker and the bottom of the profile gradient. |
Notes on behavior
The width of the deviation bands is based on the Average True Range with a fixed internal period of 200 bars. This period is not exposed as an input parameter.
The indicator reads the chart foreground and background colors at startup and on every tick, so the drawing adapts to light and dark chart themes without manual adjustment.
Chart shift is enabled automatically when the indicator is loaded, with a right margin of 30 percent, so the profile and the bands remain visible.
The profile uses graphical objects. The number of objects depends on the Bins amount value. Lower values reduce the number of objects on the chart.
The indicator requires at least 210 bars of history on the chart. If less history is available, nothing is drawn until enough data is loaded.
Availability
This product is currently distributed free of charge. It will switch to a subscription service after exceeding 100 downloads. Copies obtained before the change remain downloadable and usable within the available number of activations under the standard Market rules.
Support
Support is provided through the product comments section and through the built-in mql5.com messaging system. Please describe the symbol, timeframe and parameter set you are using when reporting an issue.
Risk disclaimer
This indicator is a visual analysis tool. It does not provide trading signals in the sense of a ready-to-use trading system, and it does not guarantee or promise any trading result. The values shown are calculated from historical price data and redrawn as new data arrives. Past behavior of any instrument is not an indication of future behavior. Trading in financial markets involves risk, and the user is solely responsible for any decision made with the help of this indicator.