TrendReversalProbability
- 지표
- 버전: 1.0

Trend Reversal Probability
Overview
Trend Reversal Probability is an analytical indicator for MetaTrader 5. It does not open, close or manage trades. Its purpose is to describe one specific property of the market in numbers: how long the current directional state of a smoothed momentum oscillator has already lasted, and how unusual that duration is compared with the same measurement on previous occasions.
The indicator runs in a separate window. On every bar it updates the duration of the current state, the average and standard deviation of all completed state durations available on the chart, and an empirical percentile value for the current duration.
What the indicator measures
The calculation chain is based on the median price of each bar, that is the average of the high and the low.
- Two simple moving averages of the median price are calculated, a fast one over 5 bars and a slow one over 34 bars. Their difference forms a momentum oscillator.
- The bar-to-bar change of that oscillator is separated into its rising and falling parts. Both parts are smoothed with a Wilder style moving average over the period set in the input parameters.
- The smoothed values are converted into a single centred value that moves roughly between -50 and +50. The zero line of that centred value is the reference point.
- Crossing the zero line upwards or downwards starts a new state. The indicator counts the number of bars elapsed since the last crossing, and calls this the signal duration.
- Every time a state ends, its final duration is added to a running statistic. From all completed durations the indicator keeps the mean and the standard deviation, which are plotted as the average duration line and the deviation levels.
- The current duration is compared with that distribution. The result is an empirical percentile displayed as a percentage in the upper left corner of the indicator window.
The result is a statistical description of the past and the present. It is not a forecast of price, and it does not state that a reversal will happen. A high percentile only means that the current state has lasted longer than most of the comparable states seen earlier on the same chart and settings.
Chart elements
The indicator draws the following elements in its own subwindow.
- Average Duration - the mean of all completed state durations.
- Upper 1 SD, Upper 2 SD, Upper 3 SD - the average duration plus one, two and three standard deviations.
- Lower 1 SD - the average duration minus one standard deviation.
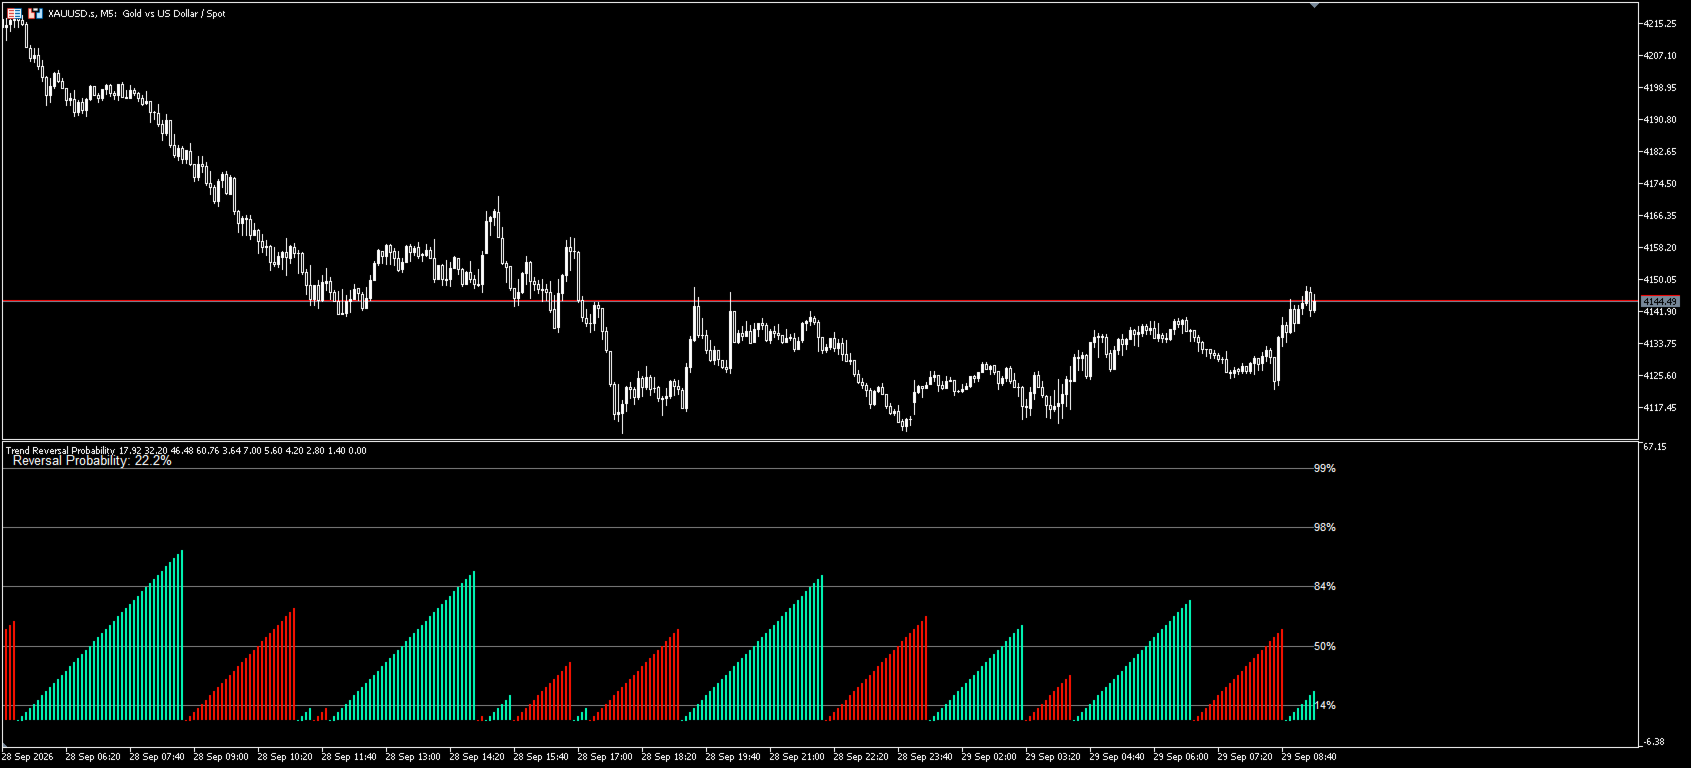
- Signal Duration - a histogram of the number of bars since the last zero line crossing. The bar is painted with the up colour while the centred value is above zero and with the down colour while it is below zero.
- Signal Duration 80%, 60%, 40%, 20% - four additional histograms showing the same duration value scaled to 80, 60, 40 and 20 percent. They are provided for visual presentation and make the height of the current state easier to read against the levels.
- Extreme Reversal Probability - an orange arrow placed above the histogram when the current duration exceeds the average duration plus three standard deviations.
Text labels showing 14%, 50%, 84%, 98% and 99% can be displayed at the average duration and at the deviation levels. These labels mark the positions of the average duration and of one, two and three standard deviations above it, with the 14% label placed one standard deviation below the average.
A label in the upper left corner of the subwindow shows the current percentile value, for example Reversal Probability: 87.4%.
Alerts
The indicator can send standard terminal alerts when the following conditions are met on a closed or closing bar.
- The percentile value rises above 84%.
- The percentile value rises above 98%.
- The percentile value falls below 14%.
- The duration counter returns to zero, which means a new state has started.
The alerts use the standard terminal alert function. They can be silenced in the terminal options if they are not needed.
Input parameters
Parameter | Default | Description |
|---|---|---|
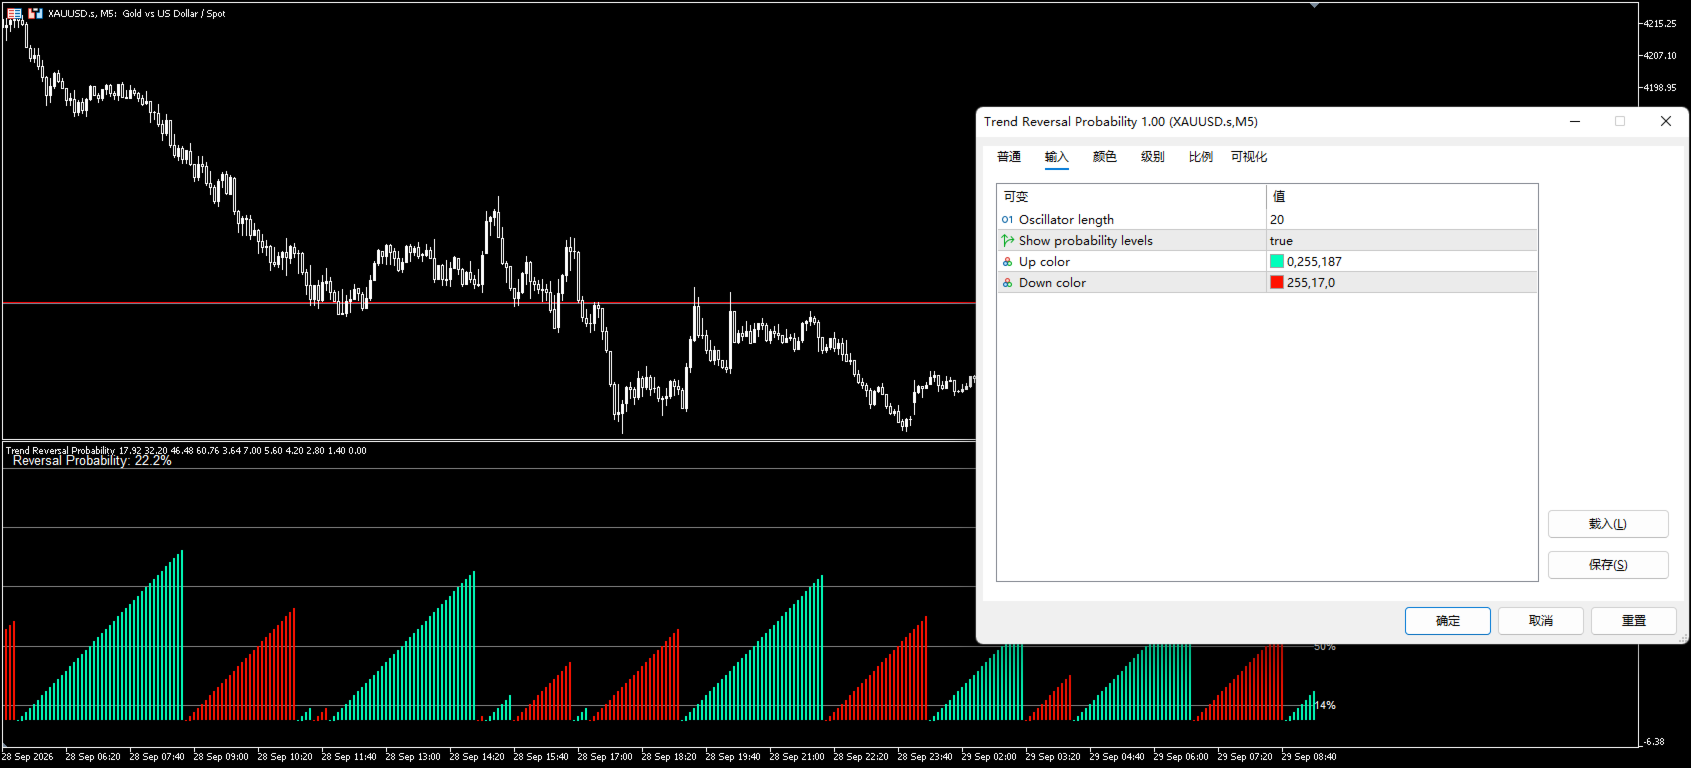
Oscillator length | 20 | Period of the Wilder style smoothing applied to the rising and falling parts of the oscillator change. Higher values produce a slower centred value and longer states. |
Show probability levels | true | Enables or disables the text labels at the average duration and deviation levels. |
Up color | 0,255,187 | Colour used for the histograms while the centred value is above zero. |
Down color | 255,17,0 | Colour used for the histograms while the centred value is below zero. |
The fast and slow moving average periods, 5 and 34, and the window used for the duration volatility, 100 bars, are fixed in this version and are not exposed as inputs.
How to use it
The indicator is intended as a context tool that is read alongside a trading method, not as a standalone source of entries.
- Loading - attach the indicator to any symbol and any timeframe. It appears in a separate window below the price chart.
- Reading the histogram - the height of the Signal Duration histogram shows how many bars the current directional state has lasted. The colour shows the direction of the state according to the centred value.
- Reading the levels - the grey lines show what has been a typical duration on this symbol and timeframe. A histogram that stays below the average duration line is still inside the usual range. A histogram approaching or exceeding the second and third deviation levels is in a range that has been rare in the loaded history.
- Reading the percentile - the value in the subwindow summarises the same information as a single number between 0 and 100.
- Practical applications - the value can be used to review how long a move has already been running, to plan where attention to an open position may be increased, to compare the behaviour of several symbols or timeframes, or to study how state durations behave on a chosen instrument.
- Reset behaviour - when the centred value crosses the zero line, the duration counter starts again from zero. The percentile falls back accordingly and the reset alert can be raised.
Because the statistic is built from completed states found on the loaded history, the number of bars available on the chart matters. A longer history provides more completed states and a more stable average duration.
Requirements and limitations
- MetaTrader 5 build with support for separate window indicators.
- At least 56 bars are required before any calculation starts, and noticeably more before the average duration, the deviation levels and the percentile become available. The left part of the chart can therefore stay empty.
- Values on the forming bar are recalculated on every tick and can change until the bar closes.
- The indicator does not use DLL calls and does not perform any trading operations.
- It can be used on any symbol and any timeframe provided by the terminal.
- The indicator does not place objects on the price chart. All objects are drawn inside its own subwindow and are removed when the indicator is removed.
Notes on risk
Trading financial markets involves substantial risk. This indicator is an analytical tool. It describes statistical properties of past state durations and does not predict future price movement, does not guarantee that any reversal will occur, and does not provide investment advice or trading signals that can be followed mechanically. Any decision based on the values shown by this indicator remains the full responsibility of the user.
Support
Questions, comments and requests are handled through the product comments section and the built-in MQL5.com messaging system.
It will switch to a subscription service after exceeding 100 downloads.