Two B Reversal
- Индикаторы
-
Ich Khiem Nguyen
 👋 Добро пожаловать в Alpha On Chart
Я развиваю Alpha On Chart как экосистему поддержки трейдеров XAUUSD и пользователей MT5.
Вот что вы можете найти:
🔥 VIP MEMBER - Версия: 1.0
- Активации: 10
Section 1: Context and Core Value
Identify False Breakout Traps and Confirmed 2B Structural Reversals
A persistent challenge for active traders is getting caught on the wrong side of false breakouts. Price frequently breaches an established support boundary, inviting breakout selling, only to immediately reverse upward. Similarly, price often spikes above resistance, drawing in late buyers, before rotating sharply back downward. These market dynamics represent classic liquidity sweeps designed to trigger stop orders and accumulate counter-trend volume before directional repricing occurs.
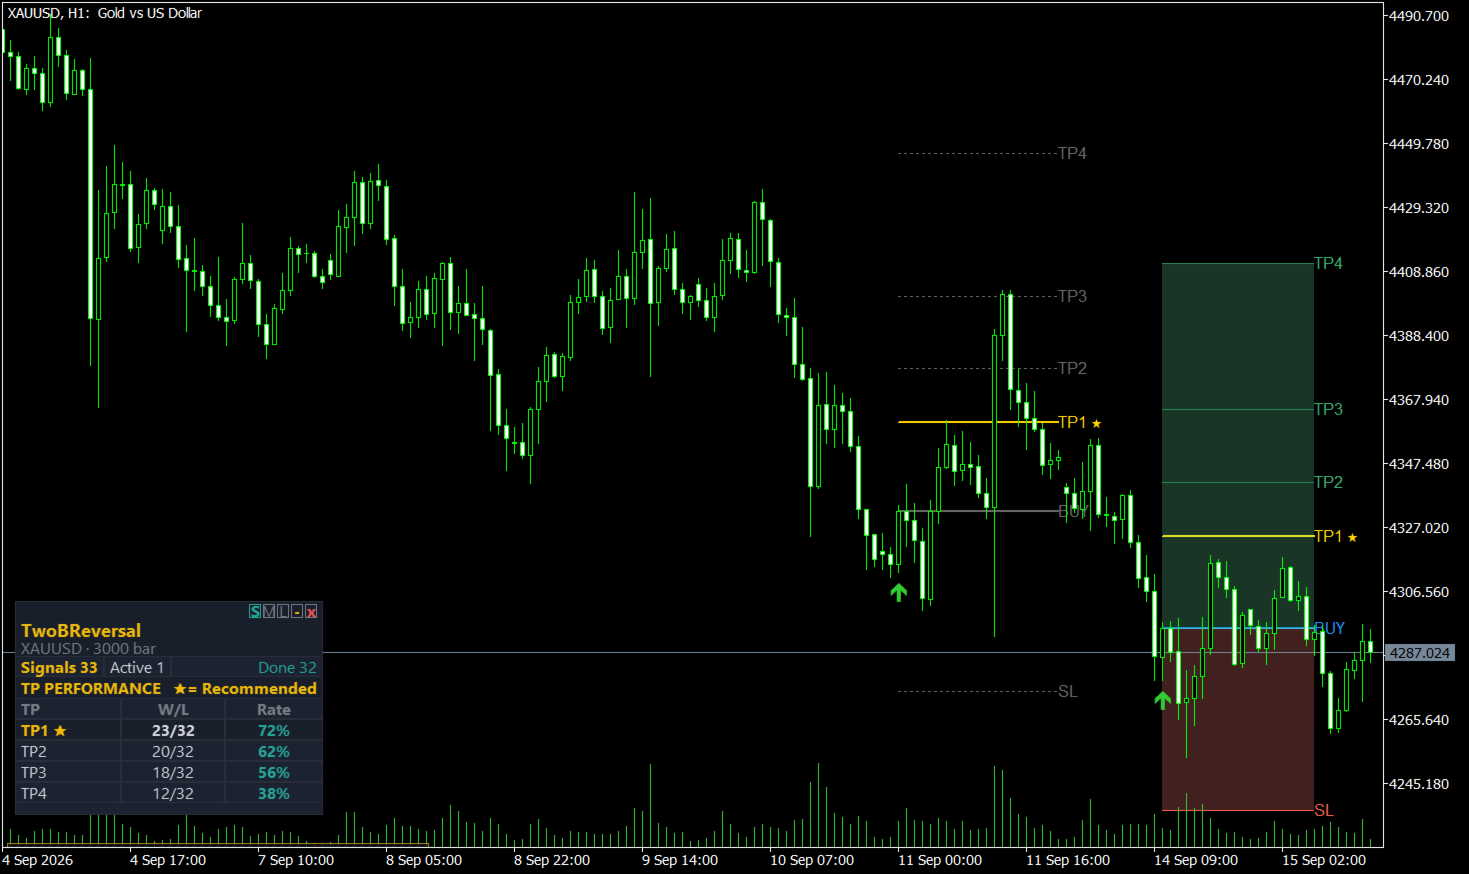
TwoBReversal systematically detects these structural inflection points directly on the chart. It identifies the classic 2B reversal pattern, where price temporarily breaches a confirmed swing high or low but fails to maintain acceptance, closing back within the prior structural boundary. When this failure completes, the indicator generates a clear visual marker: a directional arrow confirming that the breakout attempt has failed and that momentum has shifted toward the opposite side. This objective filter eliminates guesswork, keeping attention focused on high-probability reversal structures rather than low-liquidity market noise.
The framework operates during active trading sessions when participation and volume expand across liquid instruments and active symbols, performing consistently on M15, H1, H4, and D1 timeframes where swing extremes remain well defined.
Section 2: Entry Logic and Trade Management
Objective Execution and Structured Risk Management
Visual BUY Confirmation:
- The market tests below a prior confirmed swing low, creating an initial breakdown attempt.
- On the same setup bar, price reclaims and closes back above that swing level, validating the false breakdown.
- A dominant bullish expansion candle confirms buying momentum and structural absorption.
- The signal confirms strictly upon the close of the setup candle, using the open of the subsequent bar as the execution reference.
Visual SELL Confirmation:
- The market tests above a prior confirmed swing high, creating an initial breakout attempt.
- On the same setup bar, price reclaims and closes back below that swing level, validating the false breakout.
- A dominant bearish expansion candle confirms selling momentum and structural absorption.
- The signal confirms strictly upon the close of the setup candle, using the open of the subsequent bar as the execution reference.
Structural Stop Loss Placement:
- The indicator automatically projects a protective Stop Loss reference positioned outside the extreme wick of the failed breakout bar.
- A configurable volatility buffer provides additional distance beyond key pivots to accommodate normal spread variations and short-term market noise.
4 Configurable Profit Targets:
The indicator projects four structured risk-to-reward (R-multiple) levels:
- TP1 (0.5R): Initial objective configured for early partial scale-outs on immediate momentum continuation.
- TP2 (0.8R): Intermediate milestone capturing standard continuation swings.
- TP3 (1.2R): Extended target capturing broader trending impulse waves.
- TP4 (2.0R): Full expansion runner target designed to capture extended directional trend moves.
Closed-Bar Calculation Logic:
- Signals and target levels calculate strictly upon candle close.
- Confirmed markers remain anchored to their original bars without recalculating, shifting, or disappearing on subsequent price action.
All-in-One Trading Toolkit on MT5
More than a simple Buy/Sell arrow indicator.
Built to support your trading workflow: multi-symbol screening, multi-timeframe confirmation, transparent Entry-SL-TP visual structures, and on-chart historical backtesting.
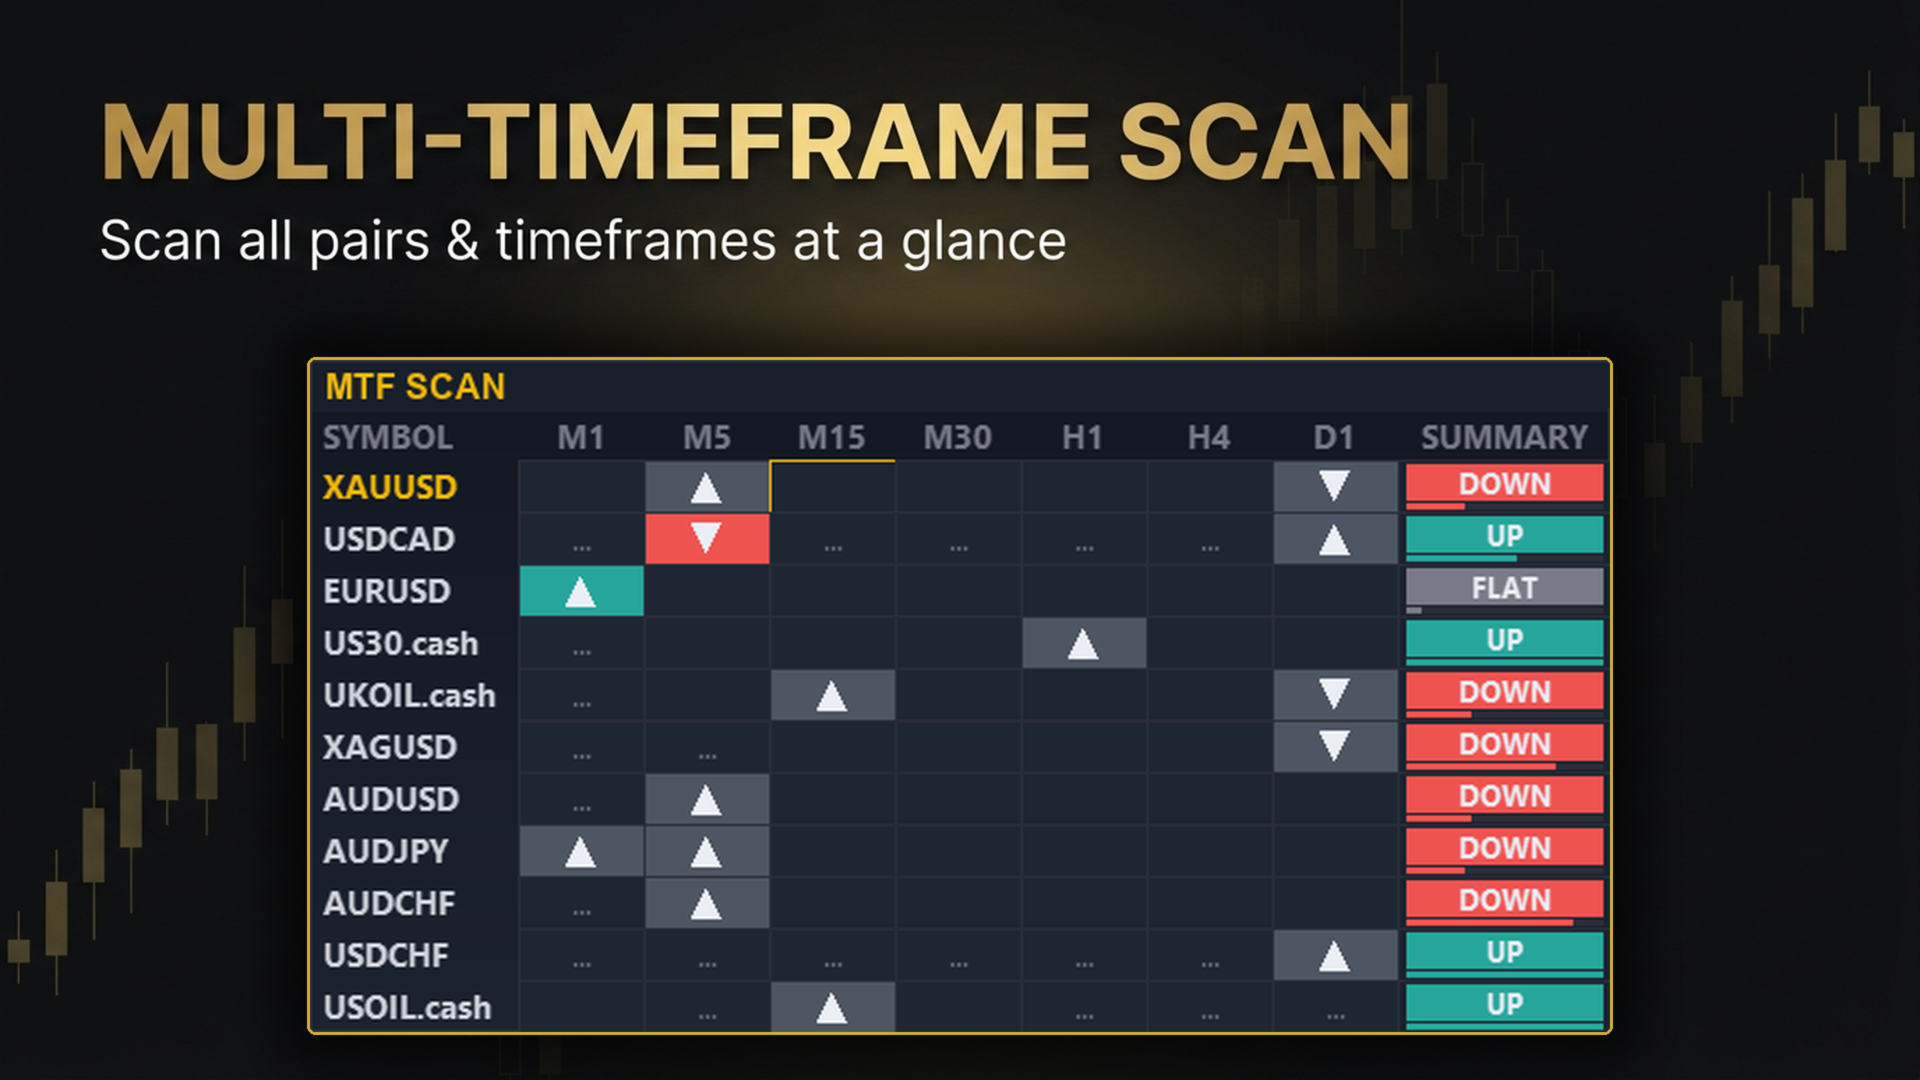
Multi-Symbol and Multi-Timeframe Scanner
Avoid opening dozens of separate charts.
The integrated MTF SCAN dashboard monitors multiple assets simultaneously across:
M15, M30, H1, H4, D1
Dashboard overview:
- Active Signal Discovery: Shows currently active BUY/SELL setups.
- Signal Status Tracking: Displays basic status of tracked signals (active, near TP, near SL).
- Higher Timeframe Confluence: Highlights when a higher-timeframe trend aligns with a lower-timeframe trigger.
- Market Bias Summary: UP, DOWN, or FLAT reading based on the indicator's own trend filter.
- One-Click Navigation: Click any dashboard cell to switch your active chart to that symbol and timeframe.
Trade Plan Visualization: Entry, Stop Loss and 4-Tier TP Ladder
A full plan displayed on the chart rather than a single alert:
Entry -> Stop Loss -> TP1 -> TP2 -> TP3 -> TP4
- Visual risk/reward zones projected directly onto your candles.
- Basic lifecycle status tracking (Active, TP Hit, SL Hit).
- Non-Repaint Design: Signals lock once the bar closes and do not recalculate, shift, or disappear afterward. This describes the calculation logic only and does not imply any particular outcome.
Signal Filtering (Signal Brake)
Sideways consolidation and two-sided liquidity wicks can generate repeated false signals. The Signal Brake logic is intended to reduce this:
- Limits rapid BUY/SELL flip-flopping in tight consolidation ranges.
- Restricts new same-direction signals while a prior setup is still active.
- Requires a minimum R-distance before the next signal can trigger.
On-Chart Historical Backtest Panel
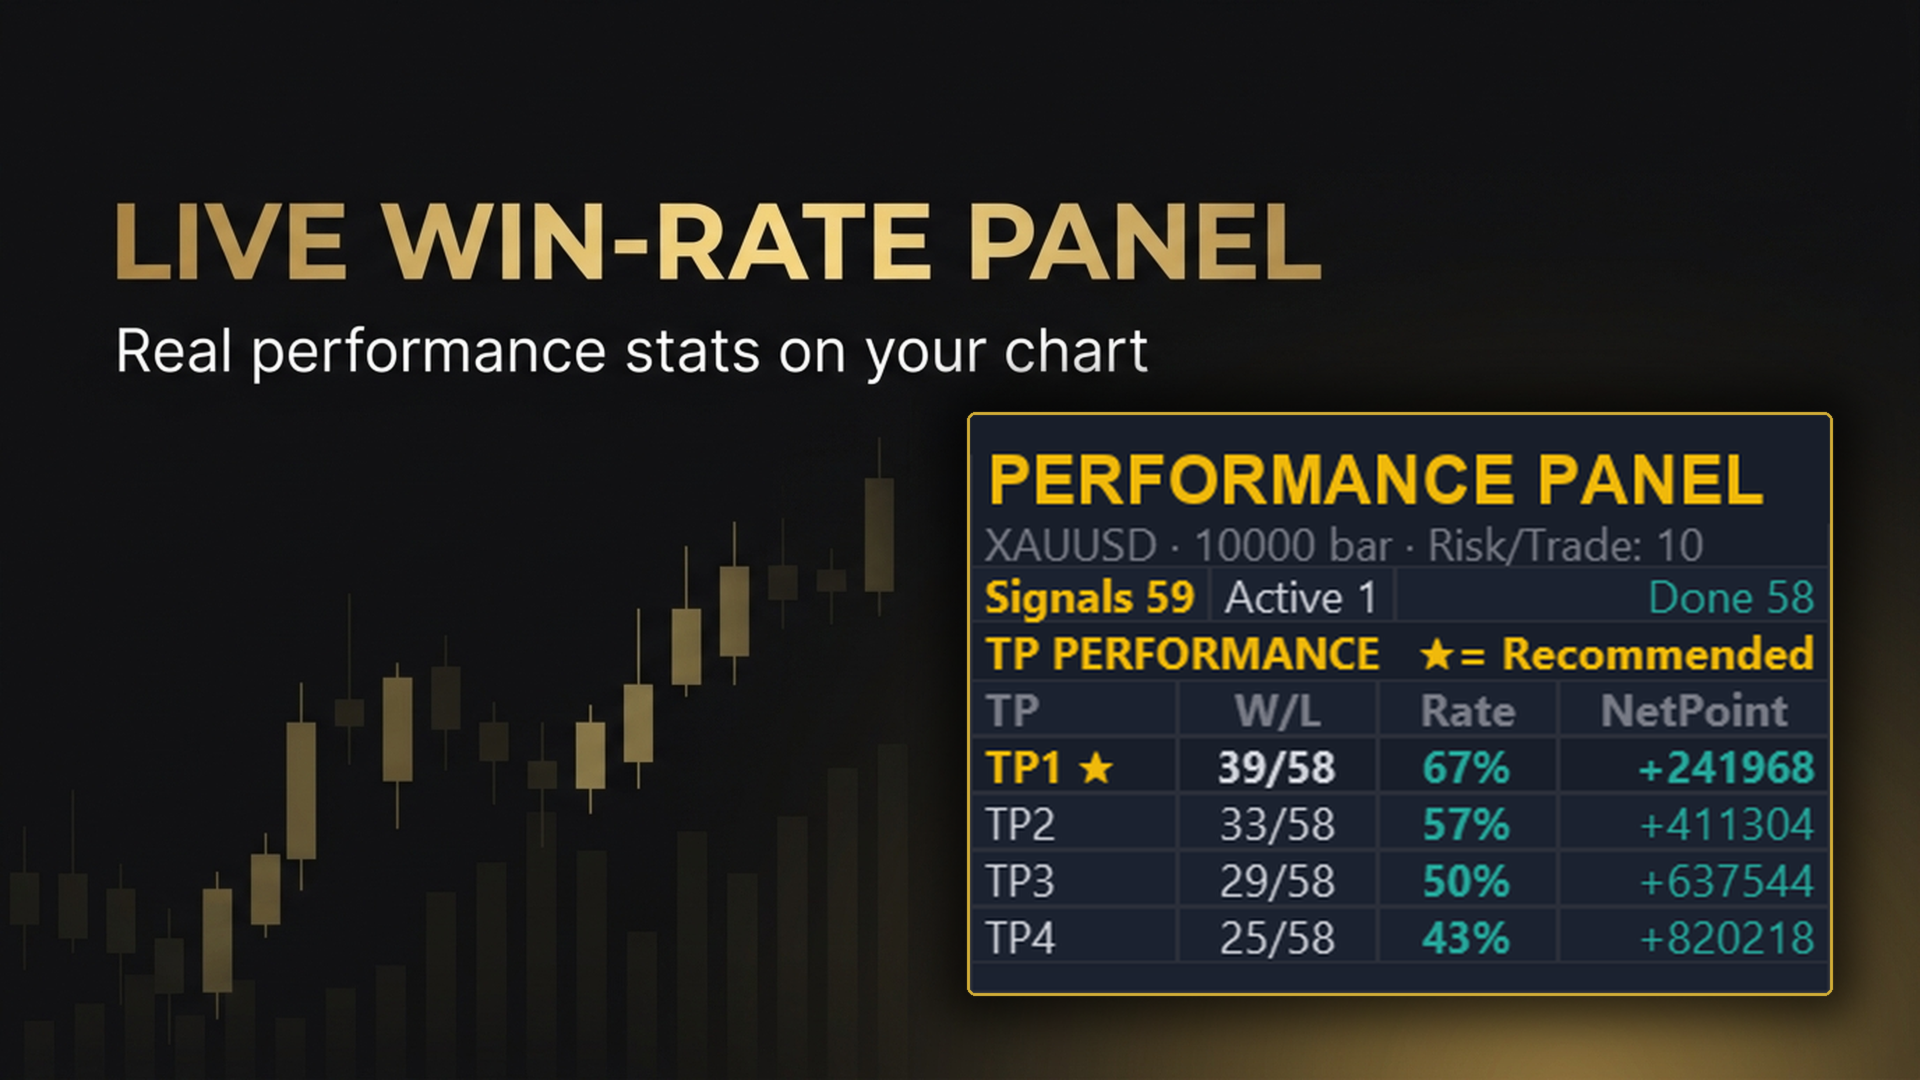
A built-in panel summarizes how signals performed on historical data for the current settings:
- Historical hit-rate breakdown across TP1, TP2, TP3, and TP4.
- Sample size shown for the configured lookback period.
- Highlights which TP level had the best historical hit-rate for that sample.
- A simple sample-size indicator to help judge statistical relevance.Note: these figures reflect past price data for the tested symbol, timeframe, and settings only. Past results do not guarantee future performance.
Multi-Channel Alerts
Stay informed while away from the chart:
- MT5 Desktop pop-up notifications.
- Audio alerts (.wav).
- Push notifications to the MT5 mobile app via MetaQuotes ID.
Interface
Designed to stay out of the way of your chart:
- 3 size presets: Small (S) / Medium (M) / Large (L).
- One-click minimize and expand toggle.
- Draggable panel that remembers its position across timeframe changes.
Suited For Traders Who Want To:
- Spot 2B false breakout patterns and trade confirmed structural reclaim events.
- Avoid chasing unconfirmed breakout wicks at key swing highs and lows.
- Monitor 2B reversal setups across multiple symbols and timeframes from a unified scanner.
- Confirm multi-timeframe directional agreement before executing lower-timeframe counter-trend triggers.
- Apply systematic structural Stop Loss placement and a predefined 4-tier Take Profit ladder.
- Review historical setup hit-rate metrics and sample distributions directly on the live chart.
- Receive instant push notifications on MT5 mobile when valid reversal bars close.
Support and Free Trial
A free demo version can be tested in the Strategy Tester and on a demo chart before purchase, through the standard MQL5 Market demo feature.
Want to try the full version before buying? Message me and I'll set you up with a short-term full-feature trial license — just send a message with your account details.
For setup questions or technical support, feel free to send a message through my MQL5 profile.