BrioQuant Session Volume Profile

  • Индикаторы
  • Mitchell Dean Ede
    Mitchell Dean Ede
    5 (5)
    Трейдер, создатель инструментов и рыночный ниндзя
    Я трейдер и разработчик торговых инструментов, работаю с рынками с 2010 года. Создаю понятные индикаторы и советники для MetaTrader 5 — для трейдеров, которым нужен полезный контекст без лишнего визуального шума.
  • Версия: 1.40
  • Обновлено: 22 августа 2026
  • Активации: 5

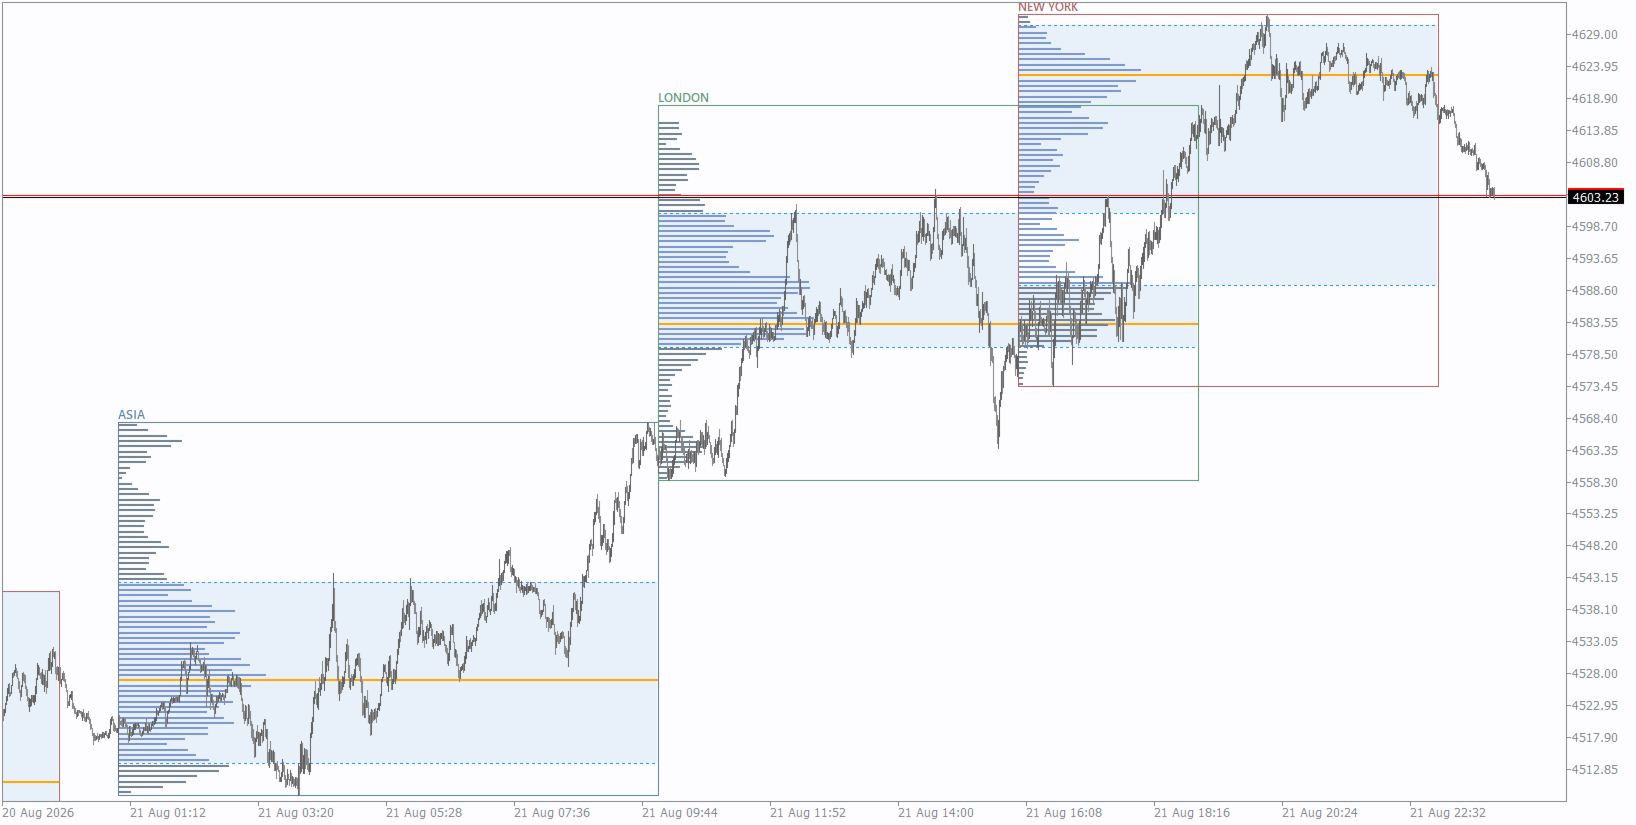
Compare POC and value-area placement across Asia, London and New York sessions.

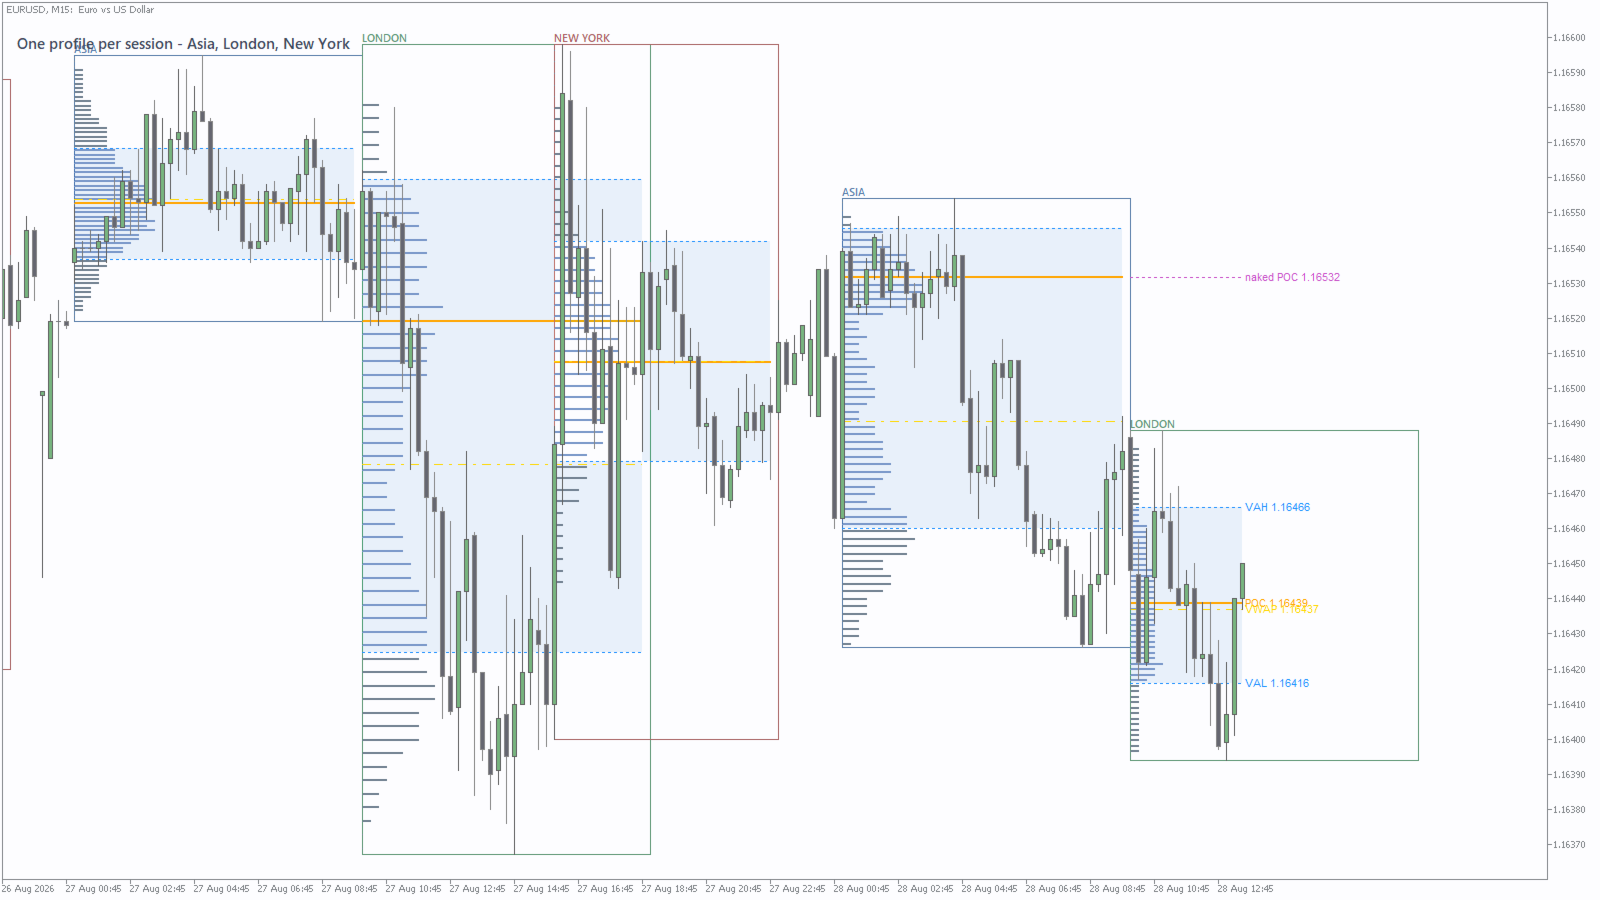
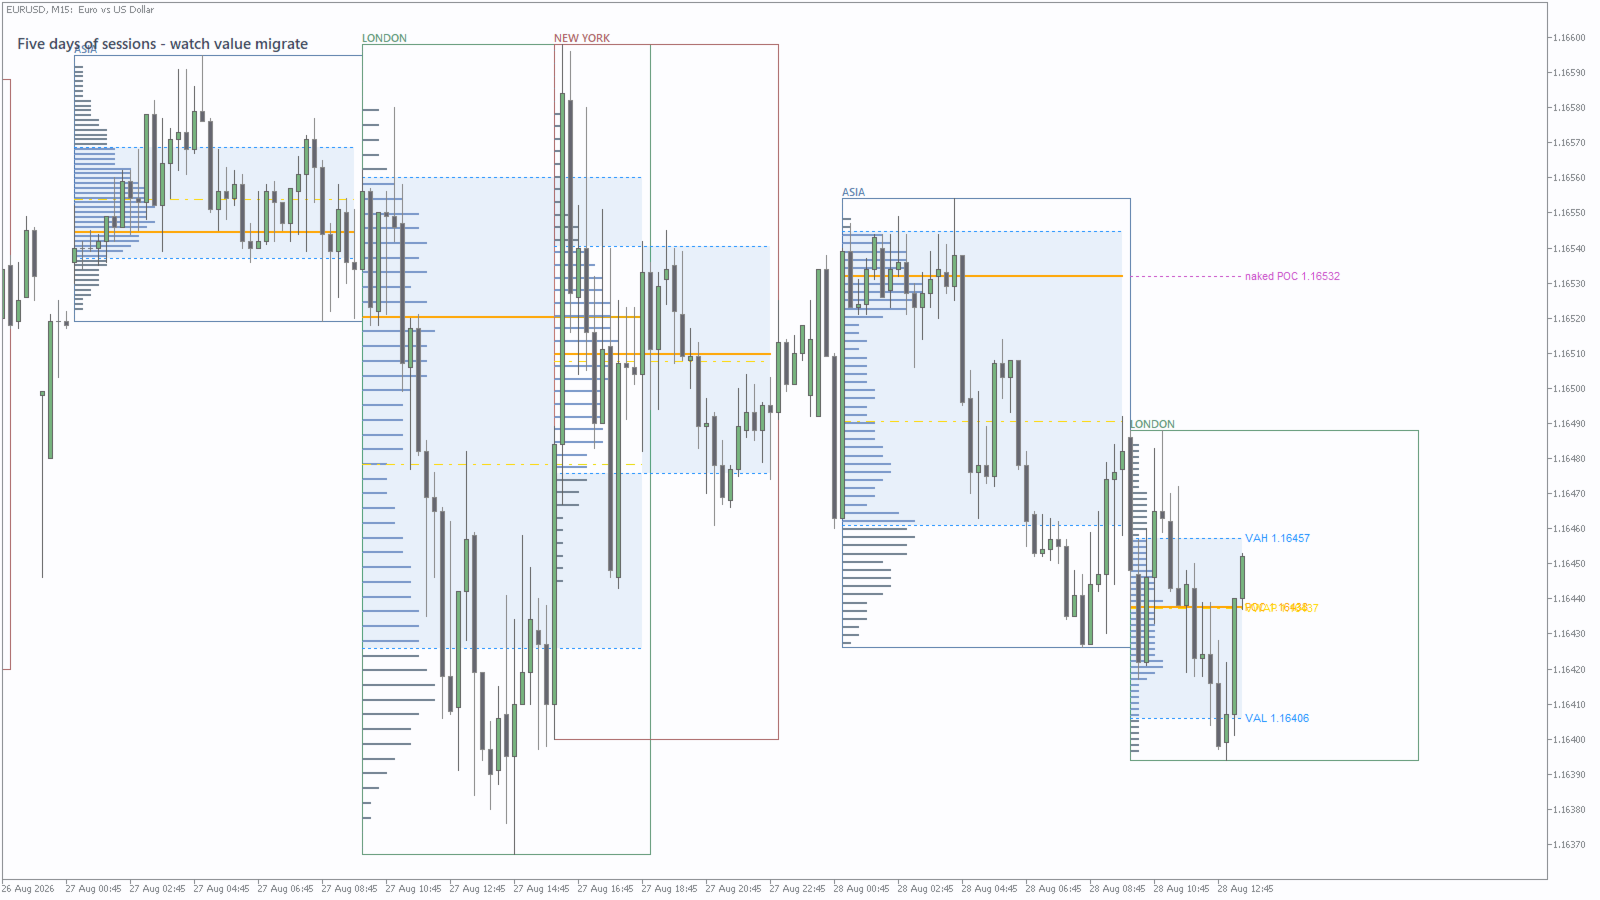
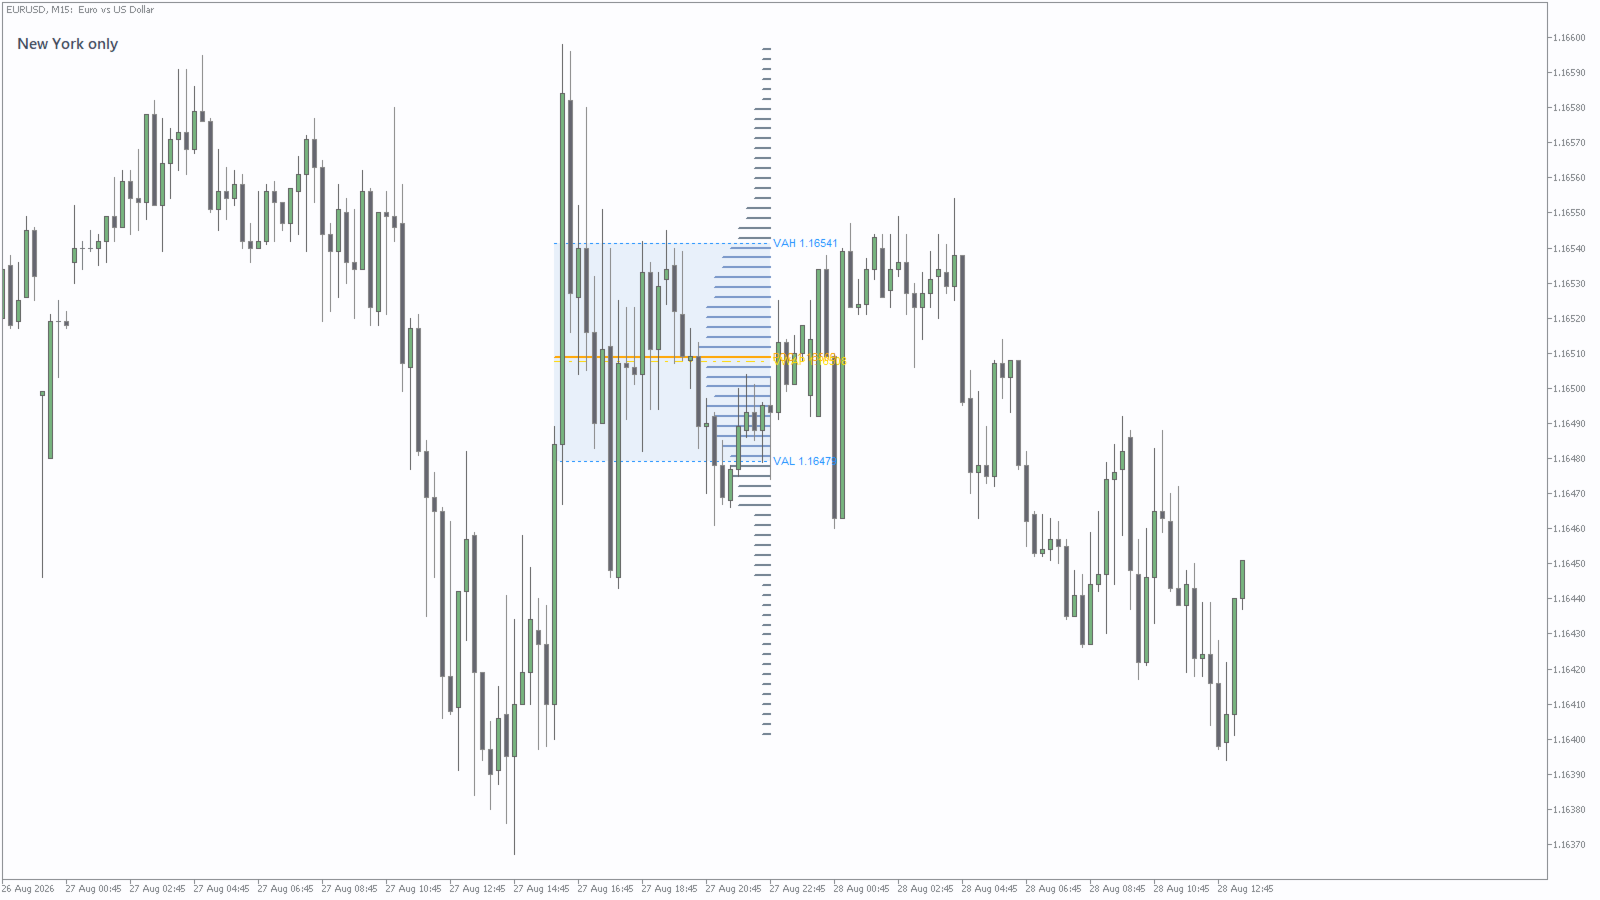
BrioQuant Session Volume Profile builds a profile for the selected Asia, London or New York session, or place one profile inside every recent session window. Compare how POC and value area move, overlap or remain stable from session to session while retaining the range modes for individual chart studies.

Two session workflows in addition to the range modes:

  • Session mode: Asia, London or New York. Auto follows the active session, or the most recently completed session between windows. Hours in broker time or GMT with automatic broker-offset.
  • Multi-session mode: one profile inside every session window for the last N days. See whether POCs are moving higher, moving lower or overlapping, and where value carried over.

Features:

  • POC, VAH and VAL per profile, configurable value-area percent, VA shading
  • Labels on the live session only - history stays clean
  • Range modes included: Visible Range, Fixed Range, Today, Last N Bars
  • Instance tag lets two copies share one chart
  • Tick or real volume
  • All chart objects removed cleanly with the indicator

Note: on Forex and many CFD symbols, tick volume measures quote activity rather than centralized traded volume. Real volume is available only where the broker supplies it.

Chart context: it draws the profiles and leaves the trading decisions to you.

Try it before you decide

Press Free Demo above to run the full indicator in the MetaTrader Strategy Tester at no cost, on your own broker's data.

Background: POC, VAH and VAL: how to read a volume profile in MetaTrader 5 covers how the levels are calculated, and Broker server time, GMT, and why your MT5 sessions are an hour out covers the clock the session boundaries depend on.

Inputs

Range and session

  • Profile range - Visible chart range, Fixed range (two draggable handles), Last N bars, Today, Trading session, or Multi-session.
  • Bars - how many bars the Last N mode uses. Default 200.
  • Session - Auto, Asia, London or New York. Auto follows the live session and falls back to the most recently closed one between windows.
  • Session hours are in - Server or GMT. On GMT the broker offset is measured and applied for you, so the sessions stay put across the clock changes.
  • Asia / London / New York start and end hour - defaults 1-10, 10-19 and 16-23, matching BrioQuant Trading Sessions so the two tools agree on the chart.
  • Days of sessions - how many days Multi-session mode reaches back. Default 4.

The profile itself

  • Price rows - histogram resolution. Default 70.
  • Applied volume - Tick or Real. Leave it on Tick for forex; switch to Real only where the feed genuinely carries volume for that symbol.
  • Value area % - the share of volume enclosed, expanded outward from the POC one row at a time. Default 70.
  • Max bar width - how far the histogram reaches across, as a fraction of the range. Default 0.30.
  • Draw bars from right edge and bar thickness in pixels.
  • Histogram colour, in-value-area colour, POC colour and VAH/VAL line colour.
  • Shade value area and its fill colour.
  • Price labels on POC/VAH/VAL, and the Fixed-range handle colour.
  • Show VWAP and VWAP colour - the volume-weighted average price across the profiled range.

Multi-session mode

  • Draw session boxes, with an Asia, London and New York box colour.
  • Session name labels.
  • Mark untested (naked) POCs from closed sessions, with its own marker colour - the levels price has not traded back through yet.

Instance tag - set a different tag on each copy when running two or more on one chart.

Tell me what would make this more useful. Post the change you want in the comments - I read every one and build what I can.
Рекомендуем также
Представляем RSIScalperPro - революционный индикатор на основе RSI для MetaTrader 5, специально разработанный для скальпинга на графике одной минуты. С RSIScalperPro у вас будет мощный инструментарий для точных сигналов входа и выхода, чтобы повысить вашу торговую эффективность. RSIScalperPro использует два различных индикатора RSI, которые предоставляют четкие сигналы для уровней перекупленности и перепроданности. Вы можете настроить временные периоды и ограничительные значения двух RSI в соот
Value Chart Candlesticks
Flavio Javier Jarabeck
4.57 (14)
The idea of a Value Chart indicator was presented in the very good book I read back in 2020 , " Dynamic Trading Indicators: Winning with Value Charts and Price Action Profile ", from the authors Mark Helweg and David Stendahl. The idea is simple and the result is pure genius: Present candlestick Price analysis in a detrended way! HOW TO READ THIS INDICATOR Look for Overbought and Oversold levels. Of course, you will need to test the settings a lot to find the "correct" one for your approach. It
FREE
SMC LIQUIDITY Advanced Institutional-Grade Smart Money and Liquidity Analysis Suite for MT5 SMC LIQUIDITY is a comprehensive institutional toolkit engineered for traders who require precise liquidity mapping, market structure intelligence, smart money concepts, and order flow awareness in a single integrated interface. It is designed for professional workflow, multi-timeframe clarity, and seamless execution in fast-moving conditions. This indicator combines several institutional methodologies in
FREE
White Weis Volume Ticks
Ricardo Almeida Branco
5 (4)
White Weis Volume This indicator shows the sum of the volume in each wave, bulish or bearish, as idealized by David Weis , but it brings an important addition , which is the marking of the bar with the highest volume of the wave (White Bar)! In coding the indicator, it was sought to optimize the code to require minimal processing during use and not to overload mt5. The indicator can be used for pre-trading analysis and study, where the trader analyzes possible points of support and resistance
Footprint Volume Profile Delta Indicator MT5 Suggested indicators used with Footprint Volume Profile Delta Indicator: Tma Bands scalping (Free) -  https://www.mql5.com/en/market/product/184262?source=Site +Profile Smart Structure Zones ict (30$ per month) -  https://www.mql5.com/en/market/product/184928?source=Site +Profile Short Description Footprint Volume Profile Delta Indicator MT5 is a clean order-flow style indicator for MetaTrader 5. It displays footprint volume, buy/sell pressure, candl
VWAP_PC_MQL5 — простой самодельный индикатор VWAP для отображения объёмно-взвешенной средней цены в MT5. TF: Работает на всех тайм фреймах. Пары: Подходит для Forex, индексов, сырьевых товаров и акций. Параметры: AppliedPrice – тип цены для расчёта LineColor / Width / Style – стиль линии VWAP SessionReset – сброс по сессии или непрерывный режим Как работает (принцип VWAP): VWAP — это объёмно-взвешенная средняя цена , рассчитываемая как: VWAP = (∑ Цена × Объём) / (∑ Объём) Она показывает средн
FREE
Weis Waves — это технический индикатор, разработанный Дэвидом Вайсом и основанный на принципах Ричарда Вайкоффа. В отличие от традиционного объема, который отображается бар за баром, Weis Waves накапливает объем в «волнах» роста или падения, начиная новый отсчёт при изменении направления цены. Этот метод позволяет трейдеру ясно увидеть реальную силу движения рынка , поскольку каждая волна отражает интенсивность объема, стоящего за серией свечей. Основные особенности: Группировка объема в волн
FREE
Индикатор подчёркивает те моменты, которые профессиональный трейдер видит в обычных индикаторах. VisualVol визуально отображает разные показатели волатильности в единой шкале и общем масштабе. Подчёркивает цветом превышение показателей объёма. Одновременно могут быть отображены Тиковый и Реальный Объем, Действительный диапазон, ATR, размер свечи и ретурнс (разница open-close). Благодаря VisualVol вы увидите рыночные периоды и подходящее время для разных торговых операций. Эта версия предназначен
FREE
VP hidden
Emr Aljnaby
4.33 (12)
The indicator works to convert normal volume into levels and determine financial liquidity control points. It is very similar in function to Fixed Volume Profile. But it is considered more accurate and easier to use than the one found on Trading View because it calculates the full trading volumes in each candle and in all the brokers present in MetaTrade, unlike what is found in Trading View, as it only measures the broker’s displayed prices. To follow us on social media platforms: telegram
FREE
Stackable VWAP
Flavio Javier Jarabeck
3.5 (4)
Volume Weighted Average Price (VWAP) is a trading benchmark commonly used by Big Players that gives the average price a Symbol has traded throughout the day. It is based on both Volume and price. Additionally we put in this indicator the MVWAP (Moving Volume Weighted Average Price). For those who do not know the usage and the importance od this indicator I recommend a great article about this subject at Investopedia ( https://www.investopedia.com/articles/trading/11/trading-with-vwap-mvwap.asp
FREE
If you like this product, please give it a  5 star rating as a token of appreciation. This indicator projects Higher-Timeframe (HTF) candles onto the current chart and optionally shows their OHLC lines and Fair Value Gaps (FVGs) using ICT 3-candle logic. Projects multiple higher timeframe candles. Accurately preserves HTF OHLC on any lower timeframe. Allows spacing adjustment between projected candles. Optionally displays OHLC horizontal reference lines. Automatically detects and draws HTF Fair
FREE
High Low Open Close
Alexandre Borela
4.98 (45)
Если вам нравится этот проект, оставьте 5-звездочный обзор. Данный показатель рисует открытые, высокие, низкие и закрывающие цены на указанные период и его можно отрегулировать для специфического часового пояса. Это важные уровни, которые выглядят многие институциональные и профессиональные трейдеры и могут быть полезны для вас, чтобы знать места, где они могут быть больше активный. Доступные периоды: Предыдущий день. Предыдущая неделя. Предыдущий месяц. Предыдущий квартал. Предыдущий год. Или
FREE
Volume Above Average Indicator - MQL5 Introduction The Volume Above Average Indicator is a custom indicator for the MetaTrader 5 (MQL5) platform that helps traders identify the current trading volume compared to the historical average. The indicator uses three different sensitivity levels to classify volume into weak, medium, and strong, providing a clear visualization of market momentum. Key Features Displays trading volume in a separate window. Compares the current volume with the historical a
FREE
Обзор Профессиональный анализ объемов с индикатором Anchored Volume Profile — сверхлегким и высокопроизводительным инструментом распределения объема, разработанным специально для MetaTrader 5. Созданный с нуля на базе работы с графическим контекстом в оперативной памяти (Canvas), этот индикатор полностью устраняет задержки процессора (CPU lag), мерцание интерфейса и зависание графиков, характерные для стандартных профилей на графических объектах. Обрабатывая нативные тиковые объемы терминала в
FREE
Was: $69  Now: $49   Blahtech VWAP - Volume Weighted Average Price (VWAP) is the ratio of price to total volume. It provides an average price over a specified time interval.  Links [  Install  |  Update  |  Documentation   ] Feature Highlights Configurable VWAP Line Sessions, intervals, anchored or continuous Previous day settlement line Standard Deviation bands Alerts at bar close or real time Automatic Broker or Tick volumes Significantly reduced CPU usage Input Parameters Expert Advisor Mo
FREE
Weis Waves
Flavio Javier Jarabeck
2.83 (18)
The original author is David Weis, an expert in the Wyckoff Method. The Weis Wave is a modern adaptation of the 1930's Wyckoff Method, another expert in Tape Reading techniques and Chart Analysis. Weis Waves takes market volume and stacks it into waves according to price conditions giving the trader valuable insights about the market conditions. If you want to learn more about this subject you can find tons of videos in YouTube. Just look for "The Wickoff Method", "Weis Wave" and "Volume Spread
FREE
Aggression Volume
Flavio Javier Jarabeck
4.29 (17)
Aggression Volume Indicator is the kind of indicator that is rarely found in the MQL5 community because it is not based on the standard Volume data provided by the Metatrader 5 platform. It requires the scrutiny of all traffic Ticks requested on the platform... That said, Aggression Volume indicator requests all Tick Data from your Broker and processes it to build a very special version of a Volume Indicator, where Buyers and Sellers aggressions are plotted in a form of Histogram. Additionally,
FREE
Mae Pla Green Pen Analysis Framework The Mae Pla Green Pen Analysis Framework is a multi-timeframe price action scanner for XAUUSD (Gold Spot) . It monitors all 9 timeframes simultaneously — M1, M5, M15, M30, H1, H4, D1, W1, and MN — and displays pattern detection results on a real-time dashboard drawn directly on the chart. The indicator is based on the Mae Pla Green Pen trading methodology, which uses structured price action patterns to identify potential trade setups. Pattern Detection Three
FREE
Easy SMC Trading
Israr Hussain Shah
3.8 (5)
Structure Trend с Auto RR и сканером BOS Версия: 1.0 Обзор Structure Trend с Auto RR — это комплексная торговая система, разработанная для трейдеров, использующих Price Action и Структуру Рынка . Индикатор объединяет сглаженный трендовый фильтр с определением поворотных точек (Swing Points) и сигналами Слома Структуры (Break of Structure — BOS) для генерации торговых сетапов с высокой вероятностью успеха. Отличительной особенностью этого инструмента является Автоматическое управление рисками .
FREE
Volume & Move Strength (VMS) Indicator for MT5 The VMS Indicator displays the relationship between trading volume and price movement strength, helping traders assess how well market activity supports price action. How It Works: Measures tick volume as trading activity. Calculates move strength using a normalized True Range (%). Both values can be smoothed (default: 5) and optionally normalized (0–100) for consistency across markets. Plots two lines in a separate window: Blue (Volume) – trading a
FREE
BoxProfile MT5
Evgeny Shevtsov
4.6 (10)
Индикатор отображает профили объёма по принципу вложенности. Периоды профилей предустановлены так, что каждый последующий профиль имеет протяжённость вдвое большую, чем протяжённость предыдущего профиля. Помимо профилей индикатор отображает кластеры объёма, отсортированные по цвету, в зависимости от содержащегося в них объёма. Особенности работы индикатора Индикатор работает на типовых таймфреймах от M5 до MN, но для вычислений использует исторические данные меньших таймфреймов: M1 - для таймф
FREE
Percentage Range Consolidation O Percentage Range Consolidation é um indicador poderoso projetado para identificar zonas de consolidação de preço com base em variações percentuais ao longo do tempo. Ideal para traders que buscam detectar áreas de compressão de volatilidade e possíveis pontos de ruptura (breakout). Principais características: Identifica até 3 zonas de consolidação simultâneas, cada uma configurável de forma independente. Cálculo baseado na variação percentual entre a máxima e mín
A volume-at-price heatmap with POC, value area, estimated buy/sell pressure, confirmed signals and alerts. POC Volume Profile Heatmap is a MetaTrader 5 indicator that organizes historical volume across price levels. It identifies the Point of Control, displays the selected value area, and estimates buying and selling pressure at the POC. The indicator is intended for traders who use volume-at-price structure to study acceptance, rejection and interaction around high-activity price levels. It c
FREE
The  Market Sessions Indicator for MT5 helps you  predict market turnarounds  by detecting major supply and demand areas. These pivot points tend to occur after a new session has started and the previous one is still open. It is also used to gauge how many points or pips the market moves on average during a session. This helps us to place better our take profits and stop losses. The indicator works on all forex pairs, gold, silver, commodities, stocks, indices and any other instrument that your
FREE
(Специальная акция к Новому Году - беЗплатное распространение!) Индикатор показывает реальный 'Масштаб по пунктам на бар' (идентично как при ручном выставлении в Терминале, см.скрин) в правом верхнем углу Графика. Изменение отображаемого значения происходит МГНОВЕННО при любом изменении масштаба высоты/ширины графика! (что очень удобно при планировании скриншотов). в Настройках: смена языка (Русский / Английский), размер шрифта отображаемого текста, коэфициент смещения текстовой метки от угла г
FREE
Sierra Capital Session Sweep Scanner maps out the Asian, London, and New York trading sessions directly on your chart, then watches for a specific price-action pattern: a candle that spikes through the Asian session's high or low and closes back inside it — a classic liquidity sweep. What it shows: Colour-coded boxes marking the Asian, London, and NY session ranges, with the Asian high/low projected forward as reference lines Arrows marking each qualifying sweep-and-reject candle, with projected
FREE
Liquidity Pressure Index
Murtadha Majid Jeyad Al-Khuzaie
Liquidity Pressure Index (LPI) is an advanced technical indicator designed to uncover the hidden battle between buyers and sellers in the market. Unlike conventional oscillators that only rely on price movements, LPI integrates market depth (order book data), ATR-based volatility compression, and adaptive smoothing to give traders a deeper view of true liquidity dynamics. By combining price action with volume absorption and order flow pressure, the LPI helps traders anticipate shifts in market
FREE
Here   our more valuable tools SMC Trend Trading   ,  Easy SMC Trading  ,  Institutional SMC Architect Volume Analysis Tools  ,  Volume flow Profile  ,  Market volume profile  , FVG with Volume  , Liquidity Heatmap Profile  ,  Volume Spread Analysis A professional spike pattern indicator built for synthetic traders who scalp and swing Crash 500/300/1000 with precision.  This indicator: Detects powerful 3-candle spike formations (Spike → Pullback → Spike) Automatically draws a clean box a
FREE
This indicator will show a vertical representation of the volume distribution within a selected user range. This is a free version of the full product. It is limited to use on a week old data or older. Find the full product at  https://www.mql5.com/en/market/product/42234 . Main features: This Indicator will create an image that will allow viewing the tick volume per price level in a graphical form. The indicator will work on any range size in any time-frame, limited only by your computer mem
FREE
Haven Volume Profile - это многофункциональный индикатор для анализа объемного профиля, который помогает определять ключевые ценовые уровни на основе распределения объема торгов. Он предназначен для профессиональных трейдеров, желающих более точно понимать рынок и выявлять важные точки для входа и выхода из сделок. Другие продукты ->  ЗДЕСЬ Основные возможности: Расчет Point of Control (POC) - уровня максимальной торговой активности, который позволяет выявить наиболее ликвидные уровни Определени
FREE
С этим продуктом покупают
Trend Sniper X
Sarvarbek Abduvoxobov
4.9 (40)
Trend Sniper X — это трендовый индикатор для MetaTrader 5, работающий на нескольких таймфреймах, который помогает трейдерам точно и ясно определять направление тренда и потенциальные точки разворота. для MT4: https://www.mql5.com/en/market/product/193245 Информация о цене: Текущая цена является промо-ценой и может измениться по мере выхода предстоящих обновлений и новых функций. Бонусное предложение: Чтобы получить БЕСПЛАТНЫЙ авто-трейд советник Assistant EA для этого индикатора, пожалуйста, на
SMART TREND TRADING SYSTEM — СПЕЦИАЛЬНОЕ ПРЕДЛОЖЕНИЕ Ваша торговая система. Ваш советник для автоматизации. Ваше обучение и поддержка. Купите Smart Trend Trading System для MT5 за 99 долларов США и получите Smart Universal Expert Advisor БЕСПЛАТНО для автоматизации сигналов системы. STTS объединяет направление тренда, сигналы входа и выхода, зоны разворота и важные ценовые уровни прямо на графике. Торгуйте по системе вручную или подключите входящий в комплект советник для автоматического исполне
ARIPoint
Temirlan Kdyrkhan
1 (4)
ARIBot is a powerful trading companion designed to generate high-probability entry signals with dynamic TP/SL/DP levels based on volatility. Built-in performance tracking shows win/loss stats, PP1/PP2 hits, and success rates — all updated live. Key Features: Buy/Sell signals with adaptive volatility bands Real-time TP/SL/DP levels based on ATR Built-in MA Filter with optional ATR/StdDev volatility Performance stats panel (Success, Profit/Loss, PP1/PP2) Alerts via popup, sound, push, or email Cus
Zoryk Gold
Reda El Koutbane
5 (15)
Скидка заканчивается через 24 часа — следующая цена $ 69 ZORYK — продвинутая сигнальная система для XAUUSD в MetaTrader 5 Вам знакомо это чувство. Вы долго анализируете золото. Ждёте подходящего момента для входа. Наконец открываете сделку — и цена сразу начинает двигаться против вас. Вы закрываете позицию слишком рано, передвигаете Stop Loss или сомневаетесь всего несколько секунд. После этого рынок достигает именно той цели, которую вы ожидали изначально, но уже без вас. Проблема не всегда за
SuperScalp Pro
Van Minh Nguyen
4.66 (35)
SuperScalp Pro - Professional Multi-Layer Confluence Scalping System SuperScalp Pro — это продвинутый индикатор для скальпинга, который улучшает классический Supertrend с помощью нескольких интеллектуальных фильтров подтверждения. Он помогает определять торговые возможности Buy/Sell с более высокой вероятностью, значительно сокращая количество ложных сигналов. Чёткие стрелки Buy и Sell отображаются непосредственно на графике, а уровни Stop Loss и Take Profit на основе ATR автоматически рассчитыв
Gann Made Easy   - это профессиональная, но при этом очень простая в применении Форекс система, основанная на лучших принципах торговли по методам господина У.Д. Ганна. Индикатор дает точные BUY/SELL сигналы, включающие в себя уровни Stop Loss и Take Profit. ПОЖАЛУЙСТА, СВЯЖИТЕСЬ СО МНОЙ ПОСЛЕ ПОКУПКИ, ЧТОБЫ ПОЛУЧИТЬ ТОРГОВЫЕ ИНСТРУКЦИИ И ОТЛИЧНЫЕ ДОПОЛНИТЕЛЬНЫЕ ИНДИКАТОРЫ БЕСПЛАТНО! Вероятно вы уже не раз слышали о торговли по методам Ганна. Как правило теория Ганна отпугивает от себя не только
SMC Intraday Formula
VividMind Digital Solutions
5 (26)
Давайте сначала будем честны. Ни один индикатор сам по себе не сделает вас прибыльным. Если кто-то говорит вам обратное — он продаёт вам мечту. Любой индикатор, который показывает идеальные стрелки покупки/продажи, можно сделать безупречным — просто увеличьте нужный участок истории и сделайте скриншот успешных сделок. Мы так делать не будем. SMC Intraday Formula — это инструмент. Он считывает структуру рынка за вас, определяет зоны с наивысшей вероятностью движения цены и точно показывает, как
GoldenX Entry MT5
VividMind Digital Solutions
5 (16)
GoldenX Entry — это индикатор для MT5 с адаптивным алгоритмом Smart Entry Trend, системой оценки сигналов, детектором рыночных режимов и фильтром волатильности. Каждый сигнал включает рассчитанный уровень входа, три уровня Take-Profit (TP1, TP2, TP3) и уровень Stop-Loss. Он построен на нескольких аналитических слоях, предназначенных для адаптации к различным рыночным условиям, объединяя многоуровневую аналитическую систему со встроенным оптимизатором и системой статистического отслеживания. Инди
Новый король в городе — Индикатор + управление ордерами (TP1 + TP2 + TP3) + опциональный Telegram-сигнал-сендер ВКЛЮЧЁН (БЕСПЛАТНО) (ПОЛНОЦЕННАЯ ТОРГОВАЯ И СИГНАЛЬНАЯ СИСТЕМА) Gold Slayer EA Этот индикатор включает в себя продвинутую стратегию, торговую систему с настраиваемым управлением ордерами и систему mean reversion, которая сочетает расширения Envelope и поддерживается несколькими интеллектуальными фильтрами подтверждения, такими как RSI, для поиска высоковероятных точек разворота с сигн
Neuro Poseidon - новый индикатор от Дарьи Резуевой. Он сочетает точные торговые сигналы с адаптивными уровнями TP/SL , в результате создавая максимально выгодные сделки! TO SWITCH TO   ENG   PLEASE CHOOSE IT IN THE UPPER-RIGHT CORNER OF THE WEBSITE Напишите мне и получите  Neuro Poseidon Assistant  в подарок для автоматизации вашей торговли! Что отличает его от других индикаторов? 1. Доказанная прибыльность на всех активах и таймфреймах 2. На графике присутствуют только подтвержденные сигналы н
Auto Optimized SpeedAngle — это система векторизации импульса институционального уровня, которая исключает подгонку под исторические данные (curve-fitting) за счет непрерывной форвард-оптимизации (Walk-Forward Optimization, WFO). Вместо того чтобы полагаться на статические входные параметры, которые теряют эффективность при смене рыночных режимов, индикатор динамически перекалибрует свои настройки, используя валидацию на вневыборочных данных (Out-of-Sample, OOS). Это гарантирует, что отображаемы
Entry Points Pro — топ-1 индикатор по количеству отзывов (600 отзывов и 31 000 скачиваний обеих версий). Индикатор даёт самые перспективные точки входа в сделки без перерисовки на любых инструментах. Индикатор покажет заранее стрелкой точку входа в сделку, укажет цену входа и нарисует на графике уровень входа и стопа, а так же рассчитает рабочий лот под твой депозит и риск, а панель статистики поможет выбрать самый перспективный инструмент и таймфрейм .  Тебе остаётся поставить отложенный ордер
FiboSniper Pro – Multi-Filter Fibonacci System with Auto SL/TP and Control Panel FiboSniper Pro — это технический индикатор, который объединяет динамические Fibonacci Envelopes с несколькими фильтрами подтверждения для формирования отборных сигналов Buy и Sell. Уровни Fibonacci рассчитываются на основе Moving Average и ATR, а затем фильтруются с помощью ADX, EMA, RSI, ATR, Volume, Time и структуры свечи. Индикатор отображает на графике автоматические уровни Stop Loss и Take Profit на основе ATR,
Welcome to ENTRY IN THE ZONE AND SMC MULTI TIMEFRAME SPECIAL BENEFIT / FOR OUR MQL5 CUSTOMERS FREE ACCESS TO THE NEW TOOL  — COMING SOON — Learn more on our official website  : https://www.fableedge.net Entry In The Zone and SMC Multi Timeframe is a real-time market analysis tool based on Smart Money Concepts (SMC), designed to analyze market structure, price direction, and key trading zones. It supports both Single-Timeframe Analysis and Multi-Timeframe Analysis, providing a clearer view of the
UNIX SCALPER — СПЕЦИАЛЬНОЕ ПРЕДЛОЖЕНИЕ Найдите торговую ситуацию. Оцените план. Выберите способ торговли. Купите UNIX Scalper для MT5 за 99 долларов США и получите Smart Universal Expert Advisor БЕСПЛАТНО для автоматизации сигналов индикатора. UNIX Scalper объединяет анализ рынка, решения BUY/SELL/WAIT и уровни Entry, Stop Loss, TP1 и TP2 в одной удобной панели. Следуйте торговому плану вручную или подключите входящий в комплект советник для автоматического исполнения с выбранными вами настройка
M1 SNIPER   — это простая в использовании торговая система. Это стрелочный индикатор, разработанный для тайм фрейма M1. Индикатор можно использовать как отдельную систему для скальпинга на тайм фрейме M1, а также как часть вашей существующей торговой системы. Хотя эта торговая система была разработана специально для торговли на M1, ее можно использовать и с другими тайм фреймами. Первоначально я разработал этот метод для торговли XAUUSD и BTCUSD. Но я считаю этот метод полезным и для торговли на
Adaptive Price Action Engine Купи индикатор — получи советник (EA) к нему бесплатно Самооптимизирующийся мульти-таймфреймовый анализ тренда и свечных моделей Рынок постоянно меняется — и не каждая модель Price Action имеет одинаковую ценность в разных рыночных режимах. Adaptive Price Action Engine создан для адаптации к изменяющимся рыночным условиям, объединяя трендовую структуру, мульти-таймфреймовый анализ, свечные модели и статистическую оптимизацию в единой аналитической системе. Два адапти
Индикатор Tokyo Indicator обеспечивает наглядное представление о направлении тренда, потенциальных торговых сигналах и текущей рыночной ситуации. Его ступенчатая линия тренда с цветовой индикацией позволяет различать «бычьи» фазы (выделены синим цветом) и «медвежьи» фазы (выделены пурпурным цветом). Соответствующие стрелки указывают на возможные точки входа в рынок (покупку или продажу) при смене тренда. Встроенная информационная панель объединяет данные о текущем сигнале, рыночном настроении,
Scalper Vault   — это профессиональная торговая система, которая дает вам все необходимое для успешного скальпинга. Этот индикатор представляет собой полную торговую систему, которую могут использовать трейдеры форекс и бинарных опционов. Рекомендуемый тайм фрейм М5. Система дает точные стрелочные сигналы в направлении тренда. Она также предоставляет вам сигналы выхода и рассчитывает рыночные уровни Ганна. Индикатор дает все типы оповещений, включая PUSH-уведомления. Пожалуйста, напишите мне пос
FX Trend NG: Следующее поколение интеллектуального анализа трендов на разных рынках Обзор FX Trend NG — это профессиональный инструмент анализа трендов и мониторинга рынка с поддержкой нескольких таймфреймов. Он позволяет за секунды получить полное структурное понимание текущего состояния рынка. Вместо переключения между десятками графиков вы мгновенно видите, какие инструменты находятся в тренде, где импульс ослабевает и где наблюдается сильная синхронизация между таймфреймами. Специальное пр
FX Power: Анализируйте силу валют для более эффективной торговли Обзор FX Power — это ваш незаменимый инструмент для понимания реальной силы валют и золота в любых рыночных условиях. Определяя сильные валюты для покупки и слабые для продажи, FX Power упрощает принятие торговых решений и выявляет высоковероятные возможности. Независимо от того, хотите ли вы следовать за трендами или предсказывать развороты с использованием экстремальных значений дельты, этот инструмент идеально адаптируется под
SMART PRICE ACTION CONCEPTS — СПЕЦИАЛЬНОЕ ПРЕДЛОЖЕНИЕ Изучайте структуру. Определяйте зоны. Создавайте торговый план. Приобретите Smart Price Action Concepts для MT5 за 49 USD и получите Smart Universal Expert Advisor БЕСПЛАТНО. Объедините Smart Money Concepts (SMC), анализ в стиле ICT и Price Action на одном упорядоченном графике. Определяйте структуру рынка, ордер-блоки, ориентиры ликвидности и дисбалансы, а затем выбирайте отображаемые элементы с помощью Smart Panel. Текущая цена 49 USD дейс
Power Candles V3 — самооптимизирующийся индикатор силы Power Candles V3 преобразует силу валюты и инструмента в готовый к использованию торговый план на каждом графике, к которому он прикреплен. Вместо того, чтобы просто раскрашивать свечи, он выполняет автоматическую оптимизацию в режиме реального времени в фоновом режиме и предоставляет вам оптимальные значения Stop Loss, Take Profit и порог сигнала для выбранного вами символа. Один клик — и все готово для реальной торговли: на графике появляю
M1 Quantum MT5
Hamed Dehgani
4.2 (10)
Торговые сигналы в реальном времени с использованием M1 Quantum: Сигнал  (Сделка выполнена автоматически с помощью Quantum Trade Assistant , бесплатно включённого в этот продукт.) Последние новости : Выпущена версия 1.64. Теперь для всех сделок Stop Loss размещается за соответствующими зонами поддержки/сопротивления. Функция Smart Close также была улучшена для повышения производительности EA в этой версии. С 9 августа live-сигнал работает на версии 1.64. План цен: Текущая цена: $169 (Предложени
Market Structure Order Block Dashboard MT5 — это индикатор MT5, разработанный для трейдеров, которые хотят читать рыночную структуру и основные зоны реакции цены прямо на графике. Он объединяет BOS, ChoCH, Order Blocks, Fair Value Gaps (FVG), Ликвидность, Kill Zones, Volume Profile и компактную панель для быстрого анализа. Индикатор предназначен для трейдеров, использующих рыночную структуру, концепции ICT и Smart Money как основу для принятия решений. Он помогает выявлять продолжения тренда, во
ATOMIC ANALYST — СПЕЦИАЛЬНОЕ ПРЕДЛОЖЕНИЕ Ваш анализ рынка. Ваш советник для автоматизации. Ваше обучение и поддержка. Купите Atomic Analyst для MT5 за 99 долларов США и получите Smart Universal Expert Advisor БЕСПЛАТНО для автоматизации сигналов индикатора. Atomic Analyst объединяет анализ ценового движения, направление тренда, сигналы входа и выхода, уровни Stop Loss и несколько уровней Take Profit прямо на графике. Торгуйте вручную, используя его анализ, или подключите входящий в комплект
Crystal Heikin Ashi Signals—Professional Trend & Signal Detection Indicator Advanced Heikin Ashi Visualization with Intelligent Signal System for Manual & Automated Trading Final Price: $149 ---------> Price goes up $10 after every 10 sales . Limited slots available — act fast . Overview User Guide PDF Crystal Heikin Ashi Signals is a professional-grade MetaTrader 5 indicator that combines pure Heikin Ashi candle visualization with an advanced momentum-shift detection system. Designed for both m
Каждый покупатель этого индикатора получает дополнительно Бесплатно: Авторскую утилиту "Bomber Utility", которая автоматически сопровождает каждю торговую операцию, устанавливает уровни Стоп Лосс и Тейк профит и закрывает сделки согласно правилам этой стратегии, Сет-файлы для настройки этого индикатора на различных активах, Сет-файлы для настройки Bomber Utility в режимы: "Минимум Риска", "Взвешенный Риск" и "Стратегия Выжидания", Пошаговый видео-мануал, который поможет вам быстро установить, н
Quant Direction — это инструмент трехмерного анализа рынка. Он обеспечивает полностью объективный, основанный на алгоритмах анализ рынка, одновременно вычисляя точные процентные отклонения по нескольким параметрам. Разработанный с использованием передовых инструментов моделирования на основе искусственного интеллекта и тщательно протестированный, алгоритм предназначен для интерпретации рынка с уникальной точностью. Он может анализировать любую валютную пару или финансовый инструмент на вашей пла
Smc Pro ToolKit
Talal N Z Aljarusha
5 (13)
SMC PRO TOOLKIT — SMART MONEY ANALYSIS & STRUCTURED TRADE PLANNING SMC Pro ToolKit is a professional Smart Money Concepts analysis workspace for MetaTrader 5. It combines market structure, multi-timeframe analysis, institutional price zones, setup evaluation, confirmation tools, volume context, alerts, and risk planning inside one organized chart environment. One workspace. Multiple layers of confirmation. One structured trading plan. OPEN COMPLETE USER GUIDE MULTI-CONDITION SETUP ENGINE At
Другие продукты этого автора
See Asia, London and New York as real high-low boxes, with optional fills and opening-window overlays. BrioQuant Trading Sessions draws Asia, London and New York as boxes fitted to each session's actual high and low. Choose broker time or GMT with automatic broker-offset handling, then add optional fills, labels and opening-window boxes. Features: - Boxes hug each session's real range, not arbitrary full-height bands - Optional background fills, auto-tinted from your session colours - Optional
FREE
BrioQuant Day and Week Separators draws clean daily separators with weekday labels, emphasises the first trading day of each week, and marks bank holidays from the MT5 economic calendar - filtered to your symbol's currencies by default, so the chart shows the holidays that matter to what you trade. Features: - Daily separators with weekday name labels; weekends skipped automatically - Week-start line in its own colour and weight, so Mondays stand out at a glance - Bank-holiday markers from the b
FREE
The US Dollar Index on your chart, built live from your own broker's six currency pairs. The dollar index is the cleanest read there is on whether the dollar itself is moving, or whether it is the other side of your pair doing the work. When EURUSD falls you cannot tell from EURUSD alone whether the euro is weak or the dollar is strong. The index tells you. Put it under any chart and you are looking at the dollar on its own terms. It replicates the ICE US Dollar Index, widely quoted as DXY. Same
FREE
One line showing where every open trade on this symbol, taken together, comes out flat. Scale into a position five times and the line tells you the price you need back, with the live P&L beside it. It is the break-even, not the average entry Averaging the entry prices is not the price that makes you flat. Swap accrues nightly and commission is charged on every lot, so the real break-even sits above the average entry on a long book and below it on a short one, and it drifts as swap builds. This s
FREE
Four pivot methods, three reference periods and labels that stay where you place them. BrioQuant Pivot Points plots Classic, Fibonacci, Camarilla or Woodie levels from the previous completed period. Choose Daily, Weekly or Monthly pivots, then place labels at the period start, after the newest candle, in the margin or at the chart edge. Features: Methods: Classic / Fibonacci / Camarilla / Woodie; periods: Daily / Weekly / Monthly Label placement: line start, after the newest candle, centred in t
FREE
BrioQuant Anchored VWAP plots the volume weighted average price from a chosen anchor point, with optional standard deviation bands. Alongside the usual calendar anchors it can re-anchor at the start of each trading session. Asia, London and New York each get their own developing VWAP, which resets when that session opens and stops when it closes. The hour inputs match the BrioQuant Trading Sessions indicator, so the two line up on the same chart. Anchor modes Session - Asia, London or New York,

FREE
Renko bricks drawn as time-anchored boxes on your ordinary chart, so brick structure and real time stay visible together. A renko brick prints when price moves a set distance, ignoring how long that takes. That strips out the sideways noise a time chart is full of. The usual way to see them is a separate offline chart, which loses the clock. This draws the same bricks over your normal candles instead, so you keep the time axis, your other indicators, and your orders. How the bricks are built Onl
FREE
Heiken Ashi candles drawn in the main chart window, with the option to hide the chart's own candles so only the Heiken Ashi bodies remain. Heiken Ashi averages each bar with the one before it. Direction changes less often than on standard candles, which makes a trend easier to hold and a stall easier to see. It is a different way of drawing the same price, not a signal. What it does Plots Heiken Ashi open, high, low and close as coloured candles Separate colours for rising and falling candles Op
FREE
Keep figures, halves and quarters visible without letting the grid take over the chart. BrioQuant Round Price Levels draws figures, halves and quarters as three clearly weighted tiers. The spacing adapts to the instrument, while separate line and label controls keep important prices readable on both light and dark charts. Features: Three tiers - figures (strongest), halves, quarters - each with its own colour, width and style Spacing adapts per instrument: gold, FX majors, JPY pairs, indices, cr
FREE
BrioQuant Position Monitor keeps your floating result where your eyes already are: beside the newest candle at the current price. Show this symbol's positions or the whole account, in cash and as a percentage of balance or equity, with optional entry lines and a per-position label for every open trade on the chart symbol. Features: - Floating readout rides the newest candle at current price height - no corner panel to glance away at - Scope: this symbol or the whole account; swap included or exc
FREE
Your risk, sized before the trade. Set risk once - percent of balance, percent of equity, or a fixed amount - and the panel computes the lot for every trade from your stop distance. Drag the ENTRY, SL and TP lines on the chart; each carries a live label with price, money at risk and R multiple, with shaded risk and reward zones. An entry line placed away from price becomes a pending order. Orders you can account for. Every order, market or pending, is written to a durable journal before it is se
FREE
The euro index on your chart, built live from your own broker's five euro pairs. When EURUSD falls you cannot tell from EURUSD alone whether the euro is weak or the dollar is strong. An index answers it. Put this under any chart and you are looking at the euro on its own terms, measured against the pound, the yen, the franc and the krona as well as the dollar. It uses the New York Board of Trade Euro Currency Index formula. EUR/USD 31.55% EUR/GBP 30.56% EUR/JPY 18.91% EUR/CHF 11.13% EUR/SEK 7.85
FREE
Build a clear POC and value area from the chart range you choose. BrioQuant Range Volume Profile maps the selected MT5 volume feed across price and marks the POC, VAH and VAL. Profile the visible chart, a draggable fixed range, today or the latest number of bars, with configurable value-area shading and labels. Features: Modes: Visible Range, Fixed Range (drag two handles on the chart), Today, Last N Bars POC, configurable value-area percent, VA shading, price labels Instance tag lets two copies
Фильтр:
CodeFaceCrunch
561
CodeFaceCrunch 2026.09.09 03:57 
 

Пользователь не оставил комментарий к оценке

Ответ на отзыв