BrioQuant Pivot Points
- Индикаторы
-
Mitchell Dean Ede
 Трейдер, создатель инструментов и рыночный ниндзя
Я трейдер и разработчик торговых инструментов, работаю с рынками с 2010 года. Создаю понятные индикаторы и советники для MetaTrader 5 — для трейдеров, которым нужен полезный контекст без лишнего визуального шума. - Версия: 1.21
- Обновлено: 30 августа 2026
Four pivot methods, three reference periods and labels that stay where you place them.
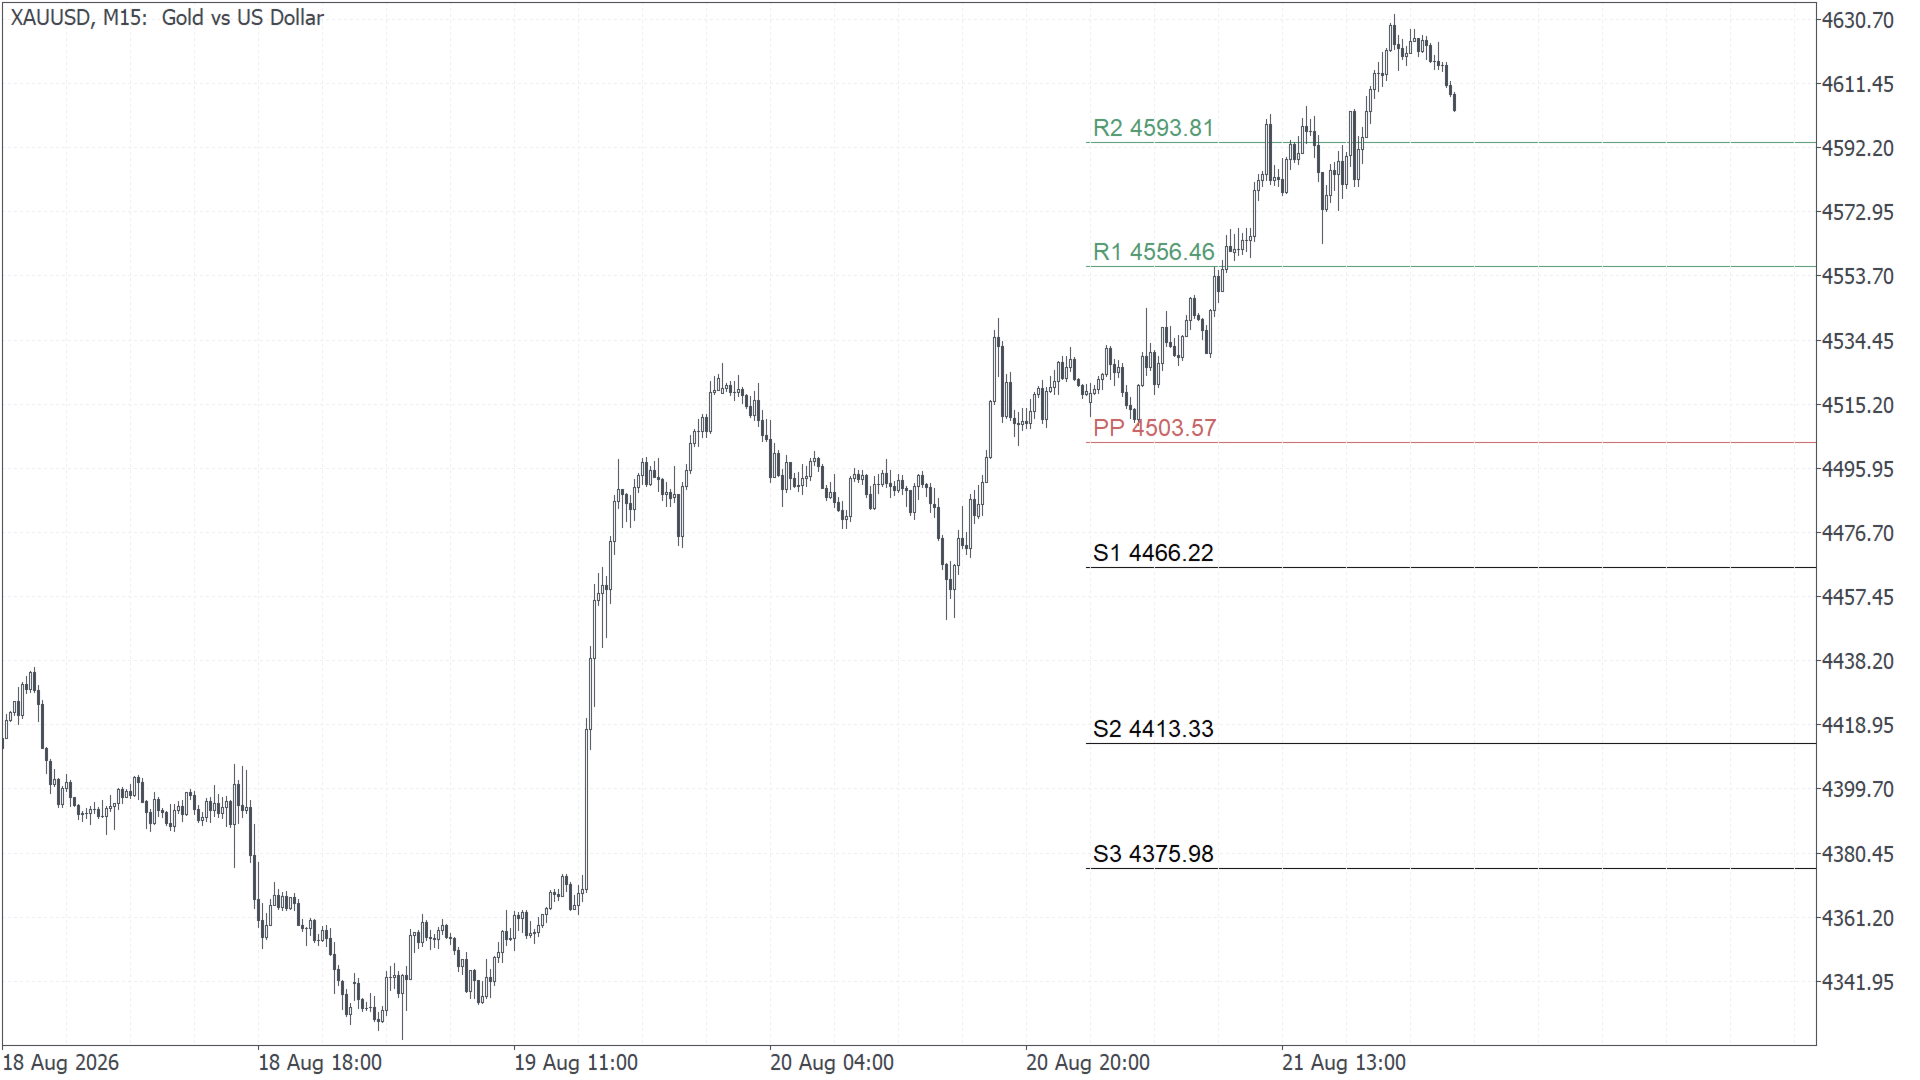
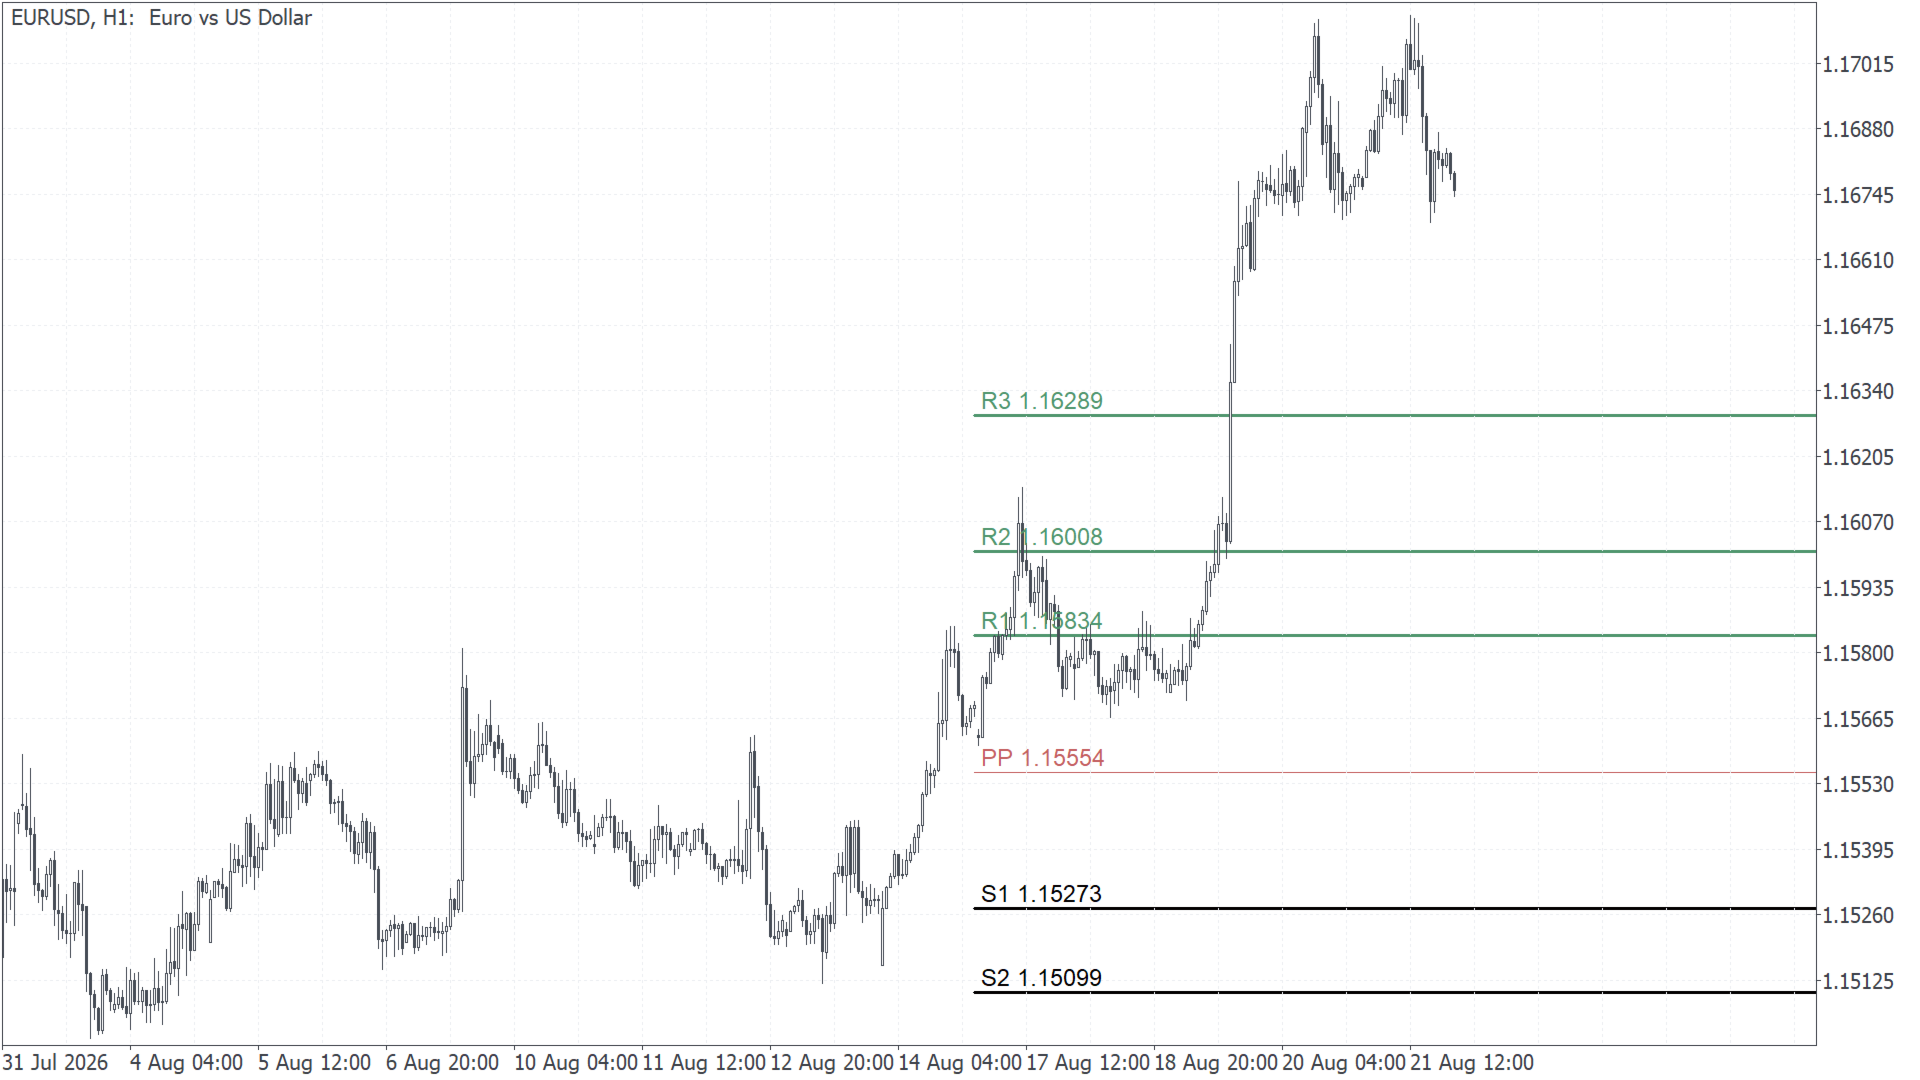
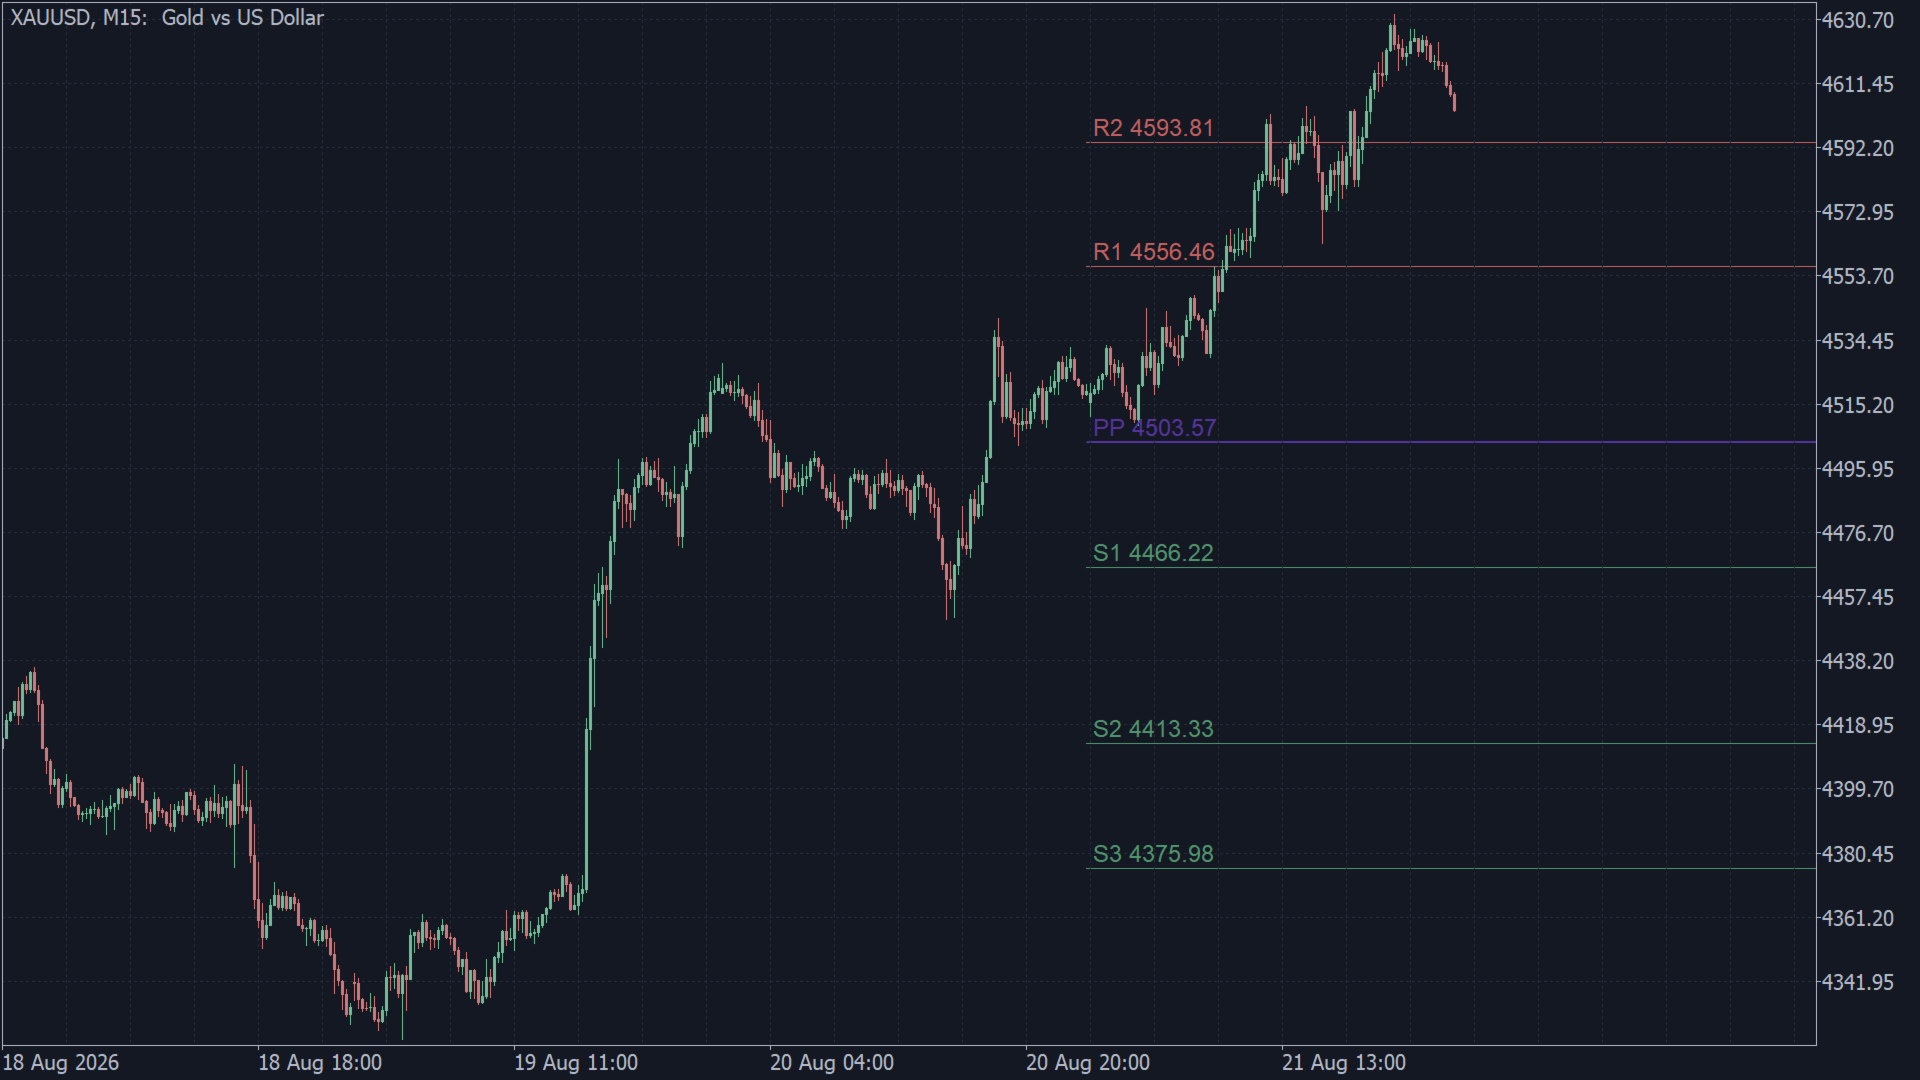
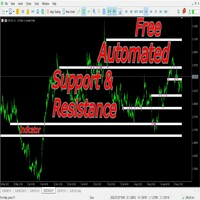
BrioQuant Pivot Points plots Classic, Fibonacci, Camarilla or Woodie levels from the previous completed period. Choose Daily, Weekly or Monthly pivots, then place labels at the period start, after the newest candle, in the margin or at the chart edge.
Features:
- Methods: Classic / Fibonacci / Camarilla / Woodie; periods: Daily / Weekly / Monthly
- Label placement: line start, after the newest candle, centred in the margin, or pinned to the chart edge (re-pins on scroll and zoom)
- Replaces the previous set when a new period begins
- Lines period-bounded or extended right
- All chart objects removed cleanly with the indicator
Chart context: it draws the levels and leaves the trading decisions to you.
Related
Daily pivots are built from the previous server day, so if the levels look like they change at the wrong hour the cause is usually the broker's clock. Broker server time, GMT, and why your MT5 sessions are an hour out explains it and gives a two-minute check.
Inputs
- Pivot period - Daily, Weekly or Monthly. Levels are calculated from the high, low and close of the last completed period, so today's daily set comes from yesterday and does not move during the session.
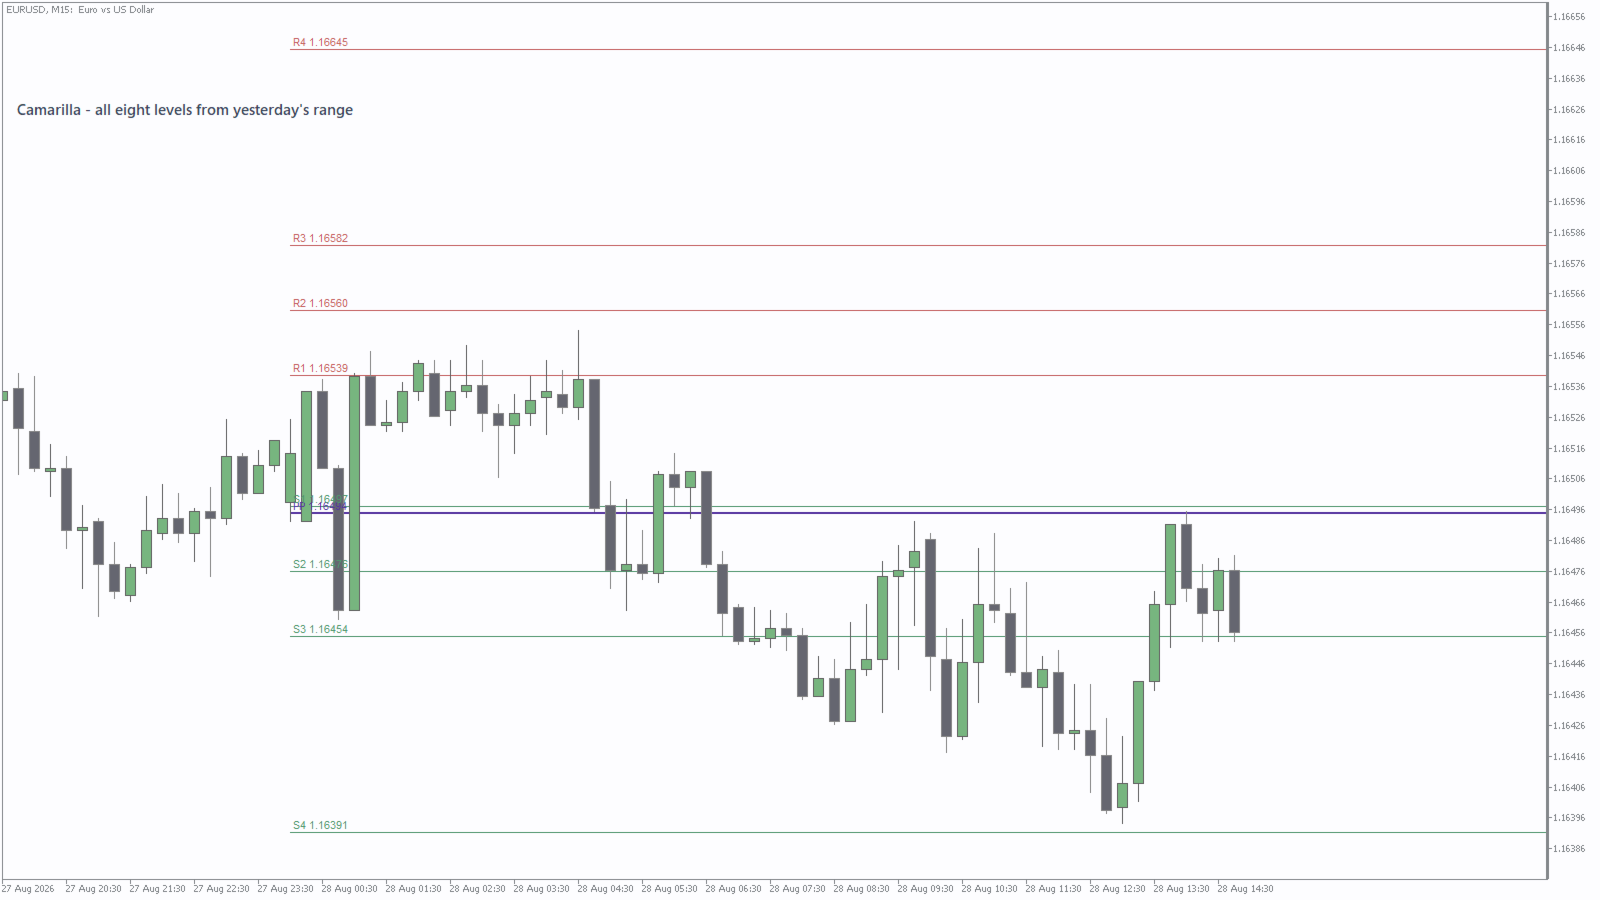
- Method - Classic, Fibonacci, Camarilla or Woodie. Classic and Woodie give the familiar wide R1-R3 and S1-S3 spread; Fibonacci places the levels at retracement ratios of the prior range; Camarilla produces eight levels clustered tightly around the close, with R1/S1 close enough to the pivot that they often sit within a few pips of it.
- Extend lines to the right - carry each level forward past the last candle instead of stopping it at the period boundary.
- Price and name labels - the R2 1.16560 style text on each line.
- Label position - line start, after the last bar, mid margin, or the chart edge. Line start is the default and is the one to keep when levels sit close together, because the other positions can run the text under the price scale.
- Pivot (PP) colour, Resistance colour and Support colour - three colours so the pivot itself stands apart from the bands either side of it.
- PP width and R/S width - the pivot is drawn heavier than the levels by default, 2 against 1.
Tell me what would make this more useful. Post the change you want in the comments - I read every one and build what I can.