QM FlowVision X1

  • Индикаторы
  • Rafael Barreto Haddad
    Rafael Barreto Haddad
    • Rafael Haddad → QuantMatrix → quantitative trading research в  Quantitative Trading Systems Researcher
    • Бразилия
    • 1884
    Исследователь количественных торговых систем | Создатель QuantMatrix Research Series | MetaTrader 5
    Создатель исследовательской серии QuantMatrix для MetaTrader 5.
  • Версия: 1.10
QM FlowVision X1

Visual Multi-Factor Trading Indicator with Historical Probability, Market Flow, Momentum, Divergence and Multi-Timeframe Context

QM FlowVision X1 is a visual decision-support indicator for MetaTrader 5 designed to transform multiple market conditions into a simple and readable trading state.

Instead of displaying isolated oscillators without interpretation, FlowVision combines momentum, money flow, RSI, Stochastic RSI, divergence and higher-timeframe context into a unified 0–100 directional score.

The indicator then classifies the current market condition as:

  • STRONG BUY

  • BUY

  • WAIT / NO TRADE

  • SELL

  • STRONG SELL

In addition to the directional score, FlowVision includes a Historical Probability Engine that analyzes how similar signals behaved in the past.

This allows the trader to distinguish between two completely different concepts:

Score = how strongly the current indicators agree.

Probability = how similar historical signals actually performed.

Main Features

1. Visual Wave Momentum Engine

FlowVision displays two momentum waves designed to identify changes in market direction and momentum.

The relationship between Wave 1 and Wave 2 is used as one of the main components of the directional score.

Bullish and bearish crossings can also participate in signal generation, particularly when they occur in relevant momentum zones.

2. Money Flow

A visual Money Flow histogram helps identify current buying or selling pressure.

  • Green = positive flow

  • Red = negative flow

Money Flow is included directly in the FlowVision scoring model.

This helps distinguish a momentum signal supported by market pressure from one occurring against the current flow.

3. RSI

FlowVision includes an RSI component as part of its multi-factor analysis.

RSI is not used as a standalone BUY or SELL system.

Instead, it contributes to the total directional score and helps identify whether momentum is strengthening, weakening or remaining neutral.

4. Stochastic RSI

Stochastic RSI is used as an additional momentum confirmation layer.

The relationship between its K and D components contributes to the FlowVision score.

This provides a faster momentum component alongside the slower Wave and RSI structures.

5. Divergence Detection

FlowVision automatically detects regular bullish and bearish divergences between price and the internal Wave structure.

Bullish divergence:

Price forms a lower low while the oscillator forms a higher low.

Bearish divergence:

Price forms a higher high while the oscillator forms a lower high.

Divergences are confirmed only after the required pivot structure exists.

They are therefore treated as confirmed events rather than being projected into the past before confirmation.

6. Multi-Timeframe Context

FlowVision includes two higher-timeframe context filters.

With Auto HTF enabled, the higher timeframes automatically adapt when the chart timeframe changes.

Default automatic structure:

M1–M5

  • Context 1: M15

  • Context 2: H1

M6–M30

  • Context 1: H1

  • Context 2: H4

H1–H3

  • Context 1: H4

  • Context 2: D1

H4–H12

  • Context 1: D1

  • Context 2: W1

D1

  • Context 1: W1

  • Context 2: MN1

The user can disable Auto HTF and manually select both higher timeframes.

Higher-timeframe context is determined using fast and slow EMA relationships.

7. FlowVision Score — 0 to 100

The indicator combines six analysis groups into one directional score:

  • Wave momentum

  • Money Flow

  • RSI

  • Stochastic RSI

  • Divergence

  • Higher-timeframe context

The final value ranges from 0 to 100.

Default interpretation:

75–100
STRONG BUY

60–74
BUY

41–59
WAIT / NO TRADE

26–40
SELL

0–25
STRONG SELL

These thresholds can be changed in the indicator inputs.

The score represents market confluence, not historical win probability.

8. Historical Probability Engine

One of the main features of QM FlowVision X1 is its internal Historical Probability Engine.

When the current state reaches BUY or SELL territory, FlowVision searches the historical data of the current symbol and timeframe for previous signals in the same direction with a similar FlowVision score.

By default, signals are considered similar when their scores are within ±10 points of the current score.

The indicator then evaluates what happened after each historical signal.

Default benchmark:

Target: +1.20 ATR

Stop reference: -1.00 ATR

Maximum evaluation horizon: 20 candles

For a BUY signal, the historical event is considered successful when price reaches +1.20 ATR before falling -1.00 ATR.

For a SELL signal, the logic is reversed.

If both target and stop are reached inside the same candle, FlowVision applies the conservative assumption and records the event as a loss.

9. Probability Is Different from Score

This distinction is important.

An example:

BUY
Score: 82/100
Historical Probability: 64%

This means the current technical conditions have strong bullish confluence, while approximately 64% of the resolved similar historical BUY signals reached the configured target before the configured stop.

Another example:

STRONG BUY
Score: 87/100
Historical Probability: 46%

The technical picture may currently be strongly bullish, but historically similar signals did not produce a strong success rate.

FlowVision allows the trader to see both pieces of information instead of assuming that a high indicator score automatically represents a high statistical probability.

10. Sample Size

Historical probability is displayed together with the number of historical observations.

The panel uses the following sample-quality classification:

INSUFFICIENT
Less than the configured minimum sample size. Default: 30 resolved samples.

LOW
30–99 resolved samples.

MODERATE
100–299 resolved samples.

HIGH
300 or more resolved samples.

This is important because a probability calculated from a very small sample should not be interpreted in the same way as a probability calculated from hundreds of historical occurrences.

FlowVision also displays:

N = resolved historical samples

U = unresolved historical samples

11. Probability Smoothing

Historical probability uses Laplace smoothing.

This reduces extreme probability readings caused by small samples.

For example, a very small group of winning observations will not immediately be displayed as an unrealistic 100% probability.

12. Historical Expectancy

FlowVision also calculates historical expectancy in R.

Example:

EXP +0.32R

indicates that the historical group of similar signals produced an average positive outcome equivalent to approximately +0.32 units of the configured risk reference.

A negative expectancy indicates that similar historical signals produced a negative average result under the current probability benchmark.

Probability and expectancy should be analyzed together.

A high win rate does not automatically mean positive expectancy.

13. Visual Trading Panel

The FlowVision panel provides an immediate overview of the market.

It displays:

  • Current market state

  • FlowVision Score

  • BUY or SELL Historical Probability

  • Historical sample size

  • Unresolved samples

  • Historical expectancy

  • Wave direction

  • Money Flow

  • RSI

  • Stochastic RSI

  • Divergence status

  • Higher-timeframe context

  • Probability benchmark

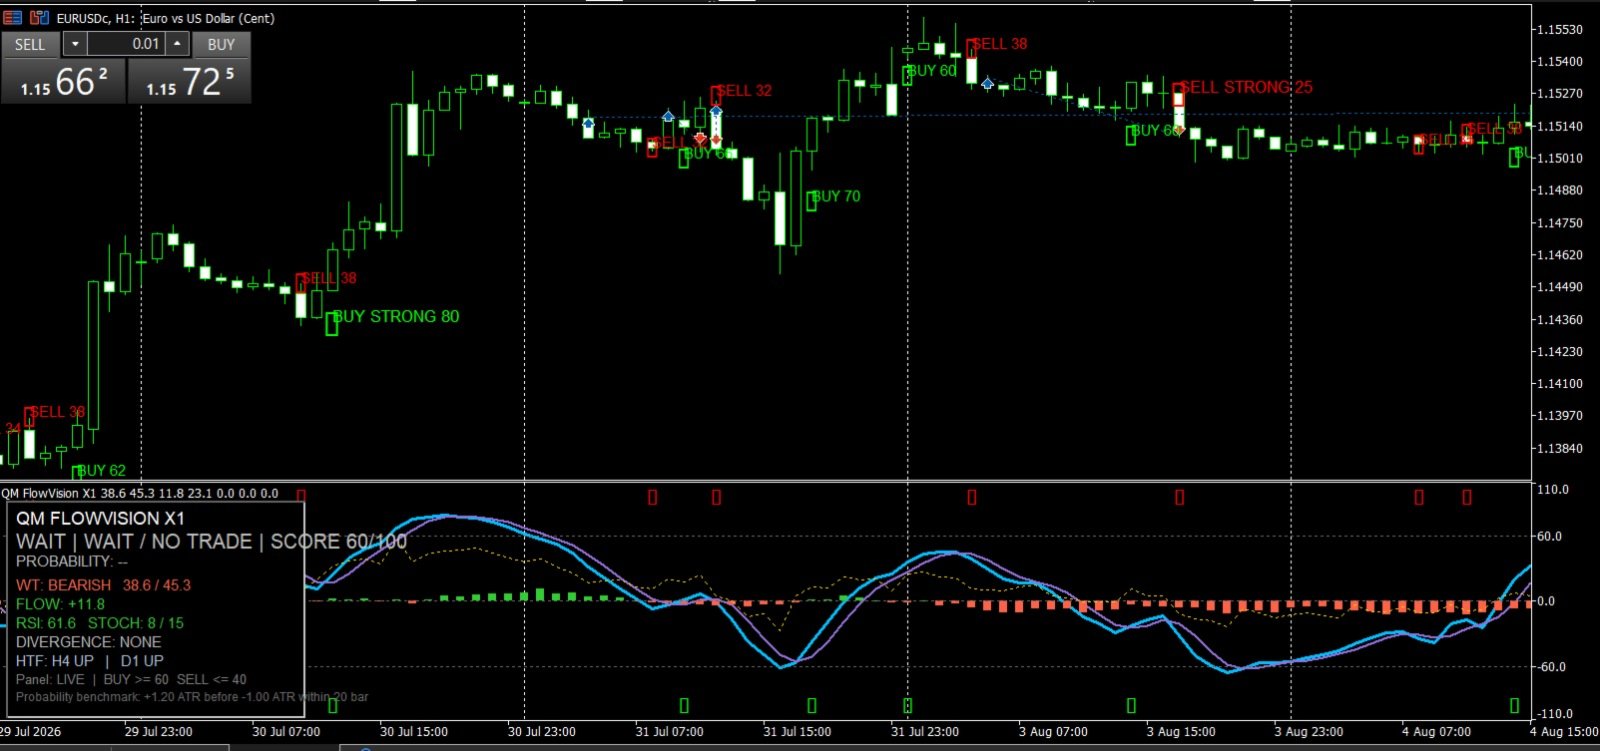
Example:

QM FLOWVISION X1

BUY | STRONG BUY | SCORE 81/100

BUY PROB: 66.4% | N=214 | EXP +0.31R | MODERATE

WT: BULLISH

FLOW: +18.2

RSI: 61.4

STOCH: 72 / 64

DIVERGENCE: BULLISH

HTF: H1 UP | H4 UP

14. BUY and SELL Signals

FlowVision does not generate a new signal simply because the score remains inside BUY or SELL territory.

The internal trigger engine evaluates events such as:

  • Entry of the score into a BUY or SELL state

  • Wave momentum crossing in a relevant zone

  • Confirmed bullish or bearish divergence

A valid BUY requires the FlowVision score to be inside BUY territory.

A valid SELL requires the FlowVision score to be inside SELL territory.

This reduces repetitive signals while the same market condition remains active.

15. Historical Chart Signals

Confirmed BUY and SELL events can be displayed directly on the main price chart.

BUY signals appear below price.

SELL signals appear above price.

Signal labels can also display the corresponding FlowVision score.

Strong signals receive additional visual emphasis.

16. Closed-Bar Signal Confirmation

Historical signal arrows and alerts are generated from confirmed closed candles.

This is designed to prevent an unfinished candle from being presented as a completed trading signal.

The live panel is different:

The panel continuously represents the current candle and can therefore change while that candle is forming.

Traders should understand the distinction between:

  • Live market analysis

  • Confirmed closed-bar signals

17. Alerts

FlowVision supports MetaTrader alerts when a confirmed BUY or SELL signal is generated.

Optional Push Notifications are also available.

Signal alerts can include:

  • Symbol

  • Direction

  • Signal strength

  • Score

  • Historical probability

  • Number of samples

  • Historical expectancy

  • Current timeframe

How to Read FlowVision

A simple way to use the indicator is to analyze four layers.

Layer 1 — Direction

Start with the current FlowVision state.

STRONG BUY / BUY
Bullish environment.

WAIT / NO TRADE
Insufficient directional agreement.

SELL / STRONG SELL
Bearish environment.

Layer 2 — Historical Probability

Check whether similar signals performed well historically.

Example:

BUY Score 72
Probability 64%
N=185

This carries more historical information than:

BUY Score 72
Probability 75%
N=8

Sample size matters.

Layer 3 — Expectancy

Check whether historical expectancy is positive.

A positive probability combined with positive expectancy represents stronger historical evidence than win rate alone.

Layer 4 — Context

Observe:

  • Wave direction

  • Money Flow

  • RSI

  • Stochastic RSI

  • Divergence

  • Higher-timeframe direction

The panel allows traders to understand why the score is bullish, neutral or bearish.

Example Bullish Reading

STRONG BUY

Score: 82/100

Historical Probability: 67%

Samples: 236

Expectancy: +0.34R

Wave: Bullish

Money Flow: Positive

RSI: Bullish

Stochastic: Bullish

H1 Context: UP

H4 Context: UP

This represents strong technical confluence combined with positive historical statistics.

Example No-Trade Reading

WAIT / NO TRADE

Score: 53/100

Wave: Bullish

Money Flow: Negative

RSI: Neutral

Stochastic: Bearish

HTF Context: Mixed

FlowVision identifies conflicting information and does not classify the market as a directional BUY or SELL condition.

Example of Technical Strength with Weak Historical Evidence

STRONG BUY

Score: 81/100

Probability: 48%

Samples: 301

Expectancy: -0.07R

The current technical structure is strongly bullish, but historically similar BUY signals did not demonstrate a positive statistical advantage under the selected ATR benchmark.

This is exactly why FlowVision keeps Score and Probability separate.

Main Inputs

Core / Wave

WT Channel Length
Controls the main Wave smoothing period.

Default: 9

WT Average Length
Controls the WaveTrend average.

Default: 12

WT Signal Length
Controls the secondary Wave signal smoothing.

Default: 3

WT Overbought
Default: 53

WT Oversold
Default: -53

Flow / RSI / Stochastic

Flow Period
Default: 34

RSI Period
Default: 14

Stochastic Period
Default: 14

Stochastic K Smooth
Default: 3

Stochastic D Smooth
Default: 3

Higher-Timeframe Context

Auto HTF
Automatically selects higher-timeframe context according to the chart timeframe.

Default: true

HTF1 / HTF2
Manual higher timeframes used when Auto HTF is disabled.

Fast EMA
Default: 20

Slow EMA
Default: 50

Signal Thresholds

Strong Buy Score
Default: 75

Buy Score
Default: 60

Sell Score
Default: 40

Strong Sell Score
Default: 25

WT Trigger Zone
Default: 25

Historical Probability Settings

Probability Lookback Bars
Default: 3000

Maximum historical search window used by the probability engine.

Forward Bars
Default: 20

Maximum number of candles evaluated after each historical signal.

ATR Period
Default: 14

Target ATR
Default: 1.20

Stop ATR
Default: 1.00

Score Tolerance
Default: 10

Controls how similar a historical signal's FlowVision score must be compared with the current score.

Minimum Display Sample
Default: 30

Used to classify very small statistical samples as insufficient.

Visual Settings

Users can enable or disable:

  • RSI display

  • Score line

  • Price-chart arrows

  • Signal text

  • Information panel

  • Historical signal display

The number of historical signal bars and maximum calculation bars can also be configured.

Alerts

Enable Alerts
Enables standard MetaTrader signal alerts.

Enable Push
Enables MetaTrader Push Notifications when configured in the terminal.

Timeframes

QM FlowVision X1 automatically recalculates when the chart timeframe changes.

The signal engine always analyzes the active chart timeframe.

Higher-timeframe context automatically adjusts when Auto HTF is enabled.

Because market behavior differs between symbols and timeframes, historical probability and expectancy should always be interpreted specifically for the currently selected symbol and timeframe.

Markets

FlowVision is designed as a multi-factor technical analysis tool and can be applied to different MetaTrader 5 symbols where sufficient historical price data is available.

Results and historical statistics can differ significantly between:

  • Forex pairs

  • Metals

  • Indices

  • Cryptocurrencies

  • Different brokers

  • Different timeframes

  • Different market conditions

Users should evaluate the indicator on the specific market and timeframe they intend to trade.

Important Information

QM FlowVision X1 is an indicator.

It does not open, manage or close trades.

It does not guarantee future market performance.

Historical probability represents the historical behavior of similar FlowVision signals under the configured ATR target, stop and evaluation horizon.

Historical statistics do not guarantee that the same behavior will occur in the future.

Probability should not be interpreted as certainty.

The live panel may change while the current candle is still forming.

Confirmed signal arrows and alerts are based on closed-bar conditions.

Trading involves financial risk. Always evaluate the method according to your own strategy, account size and risk tolerance.


Automated Trading
QM FlowVision X1 is designed for manual market analysis and does not execute trades.
Traders who prefer automated execution can use the separate QM FlowVision EA X1, an Expert Advisor from the same FlowVision product family.
The EA contains its own signal engine and does not require this indicator to be installed.
Related FlowVision products can be found among the author's products in the MQL5 Market.

Recommended First Use

For the first evaluation:

  1. Keep the default parameters.

  2. Enable Auto HTF.

  3. Open the desired symbol and timeframe.

  4. Observe the FlowVision Score.

  5. Compare Score with Historical Probability.

  6. Check the number of historical samples.

  7. Check Historical Expectancy.

  8. Observe Wave, Money Flow and higher-timeframe alignment.

  9. Use confirmed BUY and SELL signals together with your own risk-management process.

Do not interpret a single component in isolation.

The purpose of FlowVision is to combine technical information, historical behavior and market context into one visual decision-support environment.

QM FlowVision X1

See the signal. Understand the context. Measure the history.

Рекомендуем также
High Low Open Close
Alexandre Borela
4.98 (45)
Если вам нравится этот проект, оставьте 5-звездочный обзор. Данный показатель рисует открытые, высокие, низкие и закрывающие цены на указанные период и его можно отрегулировать для специфического часового пояса. Это важные уровни, которые выглядят многие институциональные и профессиональные трейдеры и могут быть полезны для вас, чтобы знать места, где они могут быть больше активный. Доступные периоды: Предыдущий день. Предыдущая неделя. Предыдущий месяц. Предыдущий квартал. Предыдущий год. Или
FREE
Pivot Point Fibo RSJ - это индикатор, который отслеживает линии поддержки и сопротивления дня с использованием ставок Фибоначчи. Этот впечатляющий индикатор создает до 7 уровней поддержки и сопротивления через точку разворота с использованием ставок Фибоначчи. Замечательно, как цены уважают каждый уровень этой поддержки и сопротивления, где можно определить возможные точки входа / выхода из операции. Функции До 7 уровней поддержки и 7 уровней сопротивления Устанавливайте цвета уровней индивид
FREE
RBM Delta Gold
Renato Brendim Medici
5 (1)
Золото движется не только из-за цены. Рынок движется за счёт агрессии, дисбаланса и потока ордеров. Именно для этого был создан индикатор Delta. Индикатор Delta XAUUSD от RBM Trader определяет разницу между агрессивными покупателями и продавцами, помогая трейдерам видеть реальное давление рынка ещё до того, как движение станет очевидным на графике. Пока большинство трейдеров смотрят только на свечи, Delta показывает, что происходит за движением цены. Индикатор был специально разработан для X
FREE
VolumeBasedColorsBars — Free Powerful Volume Analysis for All Traders Unlock the hidden story behind every price bar! VolumeBasedColorsBars is a professional-grade, 100% FREE indicator that colorizes your chart candles based on real, adaptive volume analysis. Instantly spot surges in market activity, identify exhaustion, and catch the moves that matter. This indicator gives you:    • Dynamic color-coded bars for instant volume context    • Adaptive thresholds based on historical, session-awar
FREE
MACD Colored ZeroLag
Farzin Sadeghi Bonjar
4.73 (11)
Это MQL5-версия индикатора MACD с нулевым запаздыванием, версия для MT4 которого доступна здесь: https://www.mql5.com/ru/code/9993 Также была опубликована цветная версия индикатора, но с ней были некоторые проблемы: https://www.mql5.com/ru/code/8703 Я исправил версию для MT4, содержащую 95 строк кода. На написание версии для MT5 у меня ушло 5 дней (включая чтение логов, несколько тестирование и поиск различий между MT5 и MT4!) В первой моей версии этого индикатора на MQL5 было 400 строк кода, но
FREE
Fibomathe
Almaquio Ferreira De Souza Junior
Fibomathe Indicator: Support and Resistance Tool for MT5 The Fibomathe Indicator is a technical analysis tool designed for MetaTrader 5 (MT5) that assists traders in identifying support and resistance levels, take-profit zones, and additional price projection areas. It is suitable for traders who use structured approaches to analyze price action and manage trades. Key Features Support and Resistance Levels: Allows users to define and adjust support and resistance levels directly on the chart.
FREE
Apex Point is a trend-following indicator for MetaTrader 5, transforming complex market data into signals for traders. It displays blue dots for uptrends, red dots for downtrends, and yellow crosses at potential reversals, helping users identify momentum shifts quickly. Key features include a confirmation system requiring multiple bars (default: 3) to validate changes, reducing false signals; dynamic ATR-based offsets for adaptive trailing, with instant ratcheting in the trend direction and smo
FREE
Friend of the Trend: Ваш Трекер Трендов Освойте рынок с помощью Friend of the Trend — индикатора, который упрощает анализ трендов и помогает определить лучшие моменты для покупки, продажи или ожидания. С интуитивно понятным и визуально привлекательным дизайном, Friend of the Trend анализирует движения цен и предоставляет четкие сигналы через цветной гистограмму: Зеленые полосы : Указывают на восходящий тренд, сигнализируя о возможностях для покупки. Красные полосы : Предупреждают о нисходящем тр
FREE
Эксперт  MACD_LevelTrader MT5   создан для торговле валютной пары XAUUSD. Данная версия это наработки того, что можно извлечь  из  индикатора MACD и Moving Average.  Важно   перед тестированием изменить настройку с 1000 на 5000                       Offset in points UP from SMA200 for sell              5000                       Offset in points DOWN from SMA200 for buy        5000   Тайм фрейм  М5. Два варианта логики, П араметр  true=вход по уровню  MACD +   SMA200, false=вход по MACD  Тестиру
FREE
Pivot Points Indicator – a fast, reliable, and fully customizable pivot detection for MetaTrader 5. This indicator uses MetaTrader’s native iHighest and iLowest functions to identify pivot highs and lows by scanning for the highest and lowest prices within a user-defined window of bars. A pivot is confirmed only when the current bar is the absolute maximum or minimum within the selected range, ensuring accurate and timely signals based on robust built-in logic. Key Features No Repainting : Onc
FREE
Free automatic Fibonacci is an indicator that automatically plots a Fibonacci retracement based on the number of bars you select on the BarsToScan setting in the indicator. The Fibonacci is automatically updated in real time as new highest and lowest values appears amongst the selected bars. You can select which level values to be displayed in the indicator settings. You can also select the color of the levels thus enabling the trader to be able to attach the indicator several times with differe
FREE
Общее описание Этот индикатор — усовершенствованная версия классического канала Дончия с добавлением практических функций для реальной торговли. Помимо стандартных трёх линий (верхняя, нижняя и средняя), система определяет пробои и отображает их на графике стрелками, показывая только линию, противоположную текущему направлению тренда для более чистого восприятия. Индикатор включает: Визуальные сигналы : цветные стрелки при пробое Автоматические уведомления : всплывающие окна, push и email Фильтр
FREE
PROMETHEUS TECHNICAN VERSION Free | By THE SONS A gift from The Sons — no strings, no trial, no expiry. Every trader deserves access to professional-grade market intelligence. That belief is why Prometheus Technical Version exists, and why it costs nothing. Consider it our handshake to the trading community. What You're Getting This is not a simplified tool dressed up as a gift. Prometheus Technican Version is a fully built, institutional-quality technical analysis indicator running a dual-model
FREE
Volume profile CVD Frato
Francisco Felipe Alves Da Silva Rocha
5 (2)
Frato Volume Profile Pro v7.5 Разработано Frato Academy Этот индикатор отображает профиль объема торгов для MetaTrader 5. Он рассчитывает распределение объема торгов по уровням цен за настраиваемый период и отображает результаты непосредственно на основном графике. Особенности: Профиль объема с цветовым градиентом Индикатор делит ценовой диапазон на уровни и присваивает каждому уровню соответствующий объем. Цвет каждого уровня изменяется в непрерывном градиенте в зависимости от объема: уровн
FREE
Индикатор PipTick OHLC показывает текущие и исторические значения минимума, максимума, открытия, закрытия и средне цены на выбранном периоде. Он может отображать текущие значения или значения за предыдущую сессию. Диапазоном для расчета индикатора может быть дневная, недельная, месячная или любая выбранная пользователем сессия. Уровни Максимум текущей или предыдущей сессии Минимум текущей или предыдущей сессии Открытие текущей или предыдущей сессии Закрытие текущей или предыдущей сессии Среднее
FREE
Dynamic Pivot Zones – Your Level Assistant on the Chart This indicator is a bit like a GPS for your trading . It shows you where the price likes to hang out, where it gets nervous, and where it flies through. No more calculating pivots by hand or guessing support and resistance levels. What it does: Automatically plots H1, H4, and D1 pivots . Shows support and resistance zones : R1, R2, S1, S2. Lines are colored and easy to read , so you can instantly see what’s hot or cold. Why you’ll love it:
FREE
MSX Hybrid Heiken Scalper Overview MSX Hybrid Heiken Scalper is a MetaTrader 5 indicator based on a modified Heiken Ashi methodology with closed-bar smoothing. The indicator is designed to display trend direction through color-coded candles while reducing sensitivity to short-term market fluctuations. All calculations are performed using completed candles, allowing historical values to remain fixed after bar close. Features • Modified Heiken Ashi calculation • Closed-bar processing • Color-code
FREE
Donchian Channel is an indicator created by Richard Donchian. It is formed by taking the highest high and the lowest low of the last specified period in candles. The area between high and low is the channel for the chosen period. Its configuration is simple. It is possible to have the average between the upper and lower lines, plus you have alerts when price hits one side. If you have any questions or find any bugs, please contact me. Enjoy!
FREE
Основное назначение:   "Pin Bars"   предназначен для автоматического обнаружения пин-баров на графиках финансовых рынках. Пин-бар – это свеча с характерным телом и длинным хвостом, которая может сигнализировать о развороте тренда или коррекции. Принцип работы:   Индикатор анализирует каждую свечу на графике, определяя размер тела, хвоста и носа свечи. При обнаружении пин-бара, соответствующего заранее определенным параметрам, индикатор отмечает его на графике стрелкой вверх или вниз, в зависимос
FREE
Trade Behavior Mirror читает только уже закрытую историю сделок вашего собственного счёта и считает один конкретный паттерн: открытие новой позиции вскоре после зафиксированного убытка, с лотом больше вашего обычного объёма. Инструмент ничего не прогнозирует и не даёт советов. Каждая цифра на панели - это то, что уже произошло на этом счёте. Как строятся цифры: инструмент читает до 31 дня закрытых сделок по всем символам и всем магическим номерам - это картина всего счёта, а не только символа,
FREE
RBM Smc
Renato Brendim Medici
RBM SMC Liquidity Hunter MT5 — Institutional Structure and Liquidity Indicator   The RBM SMC Liquidity Hunter is a professional tool developed to map Smart Money Concepts (SMC) dynamics directly on your charts. The indicator tracks market structure breaks, validates supply and demand zones using price displacement, and detects liquidity sweeps confirmed by volume, integrating all confluences into an executive on-chart dashboard.   Key Features  Market Structure Mapping (BOS / CHoCH): Automatic
FREE
Данный индикатор повторяет широко известную версию индикатора для MetaTrader 4, который есть в интернете в свободном доступе. Индикатор не перерисовывается. Индикатор реализует стратегию прорыва. Стрелки показывают направления рынка. Используйте индикатор на интервалах от M15 и выше. Индикатор рисует две полосы возле ценового действия и генерирует сигналы при закрытии цены под нижней и над верхней полосой. Для расчета нижнего и верхнего порога полос индикатор использует периодические максимумы и
FREE
Calmer chart context, kept practical Northstar Flow Candles MT5 is a chart-window indicator that presents Heikin Ashi candles with a five-state trend context. It is designed for traders who want a quieter view of price while keeping the native chart available as an optional reference. Visual-only indicator: Northstar Flow Candles MT5 does not place trades and does not send popup, push, or email notifications. What appears on the chart Five candle states: strong bullish, bullish, balanced, bearis
FREE
Данный информационный индикатор будет полезен тем, кто всегда хочет быть в курсе текущей ситуации на счете. VERSION MT 4 -  Больше полезных индикаторов Индикатор отображает такие данные, как прибыль в пунктах, процентах и валюте, а также спред по текущей паре и время до закрытия бара на текущем таймфрейме. Существует несколько вариантов расположения информационной строки на графике: Справа от цены (бегает за ценой); Как комментарий (в левом верхнем углу графика); В выбранном углу экрана. Так же
FREE
MTF Lines PRO
Renato Fiche Junior
3 (2)
This indicator was developed to support multiple timeframe analysis. In the indicator settings, the user can set the color, width, and style of the horizontal lines for each timeframe. This way, when the horizontal lines are inserted into the chart, they will be plotted with the timeframe settings. MTF Lines also allows visibility control of another objets like rectangles, trend lines and texts. This is a product developed by Renato Fiche Junior and available to all MetaTrader 4 and 5 users!
FREE
MACD Enhanced
Nikita Berdnikov
4 (4)
Представляем   MACD  Enhanced  – усовершенствованный индикатор MACD (Moving Average Convergence Divergence), который предоставляет трейдерам расширенные возможности для анализа тренда и момента на финансовых рынках. Индикатор использует разницу между быстрой и медленной экспоненциальными скользящими средними для определения импульса, направления и силы тренда, создавая четкие визуальные сигналы для потенциальных точек входа и выхода. Внимание!   Для достижения наилучших результатов рекомендуется
FREE
PZ Penta O MT5
PZ TRADING SLU
3.8 (5)
The Penta-O is a 6-point retracement harmonacci pattern which usually precedes big market movements. Penta-O patterns can expand and repaint quite a bit. To make things easier this indicator implements a twist: it waits for a donchian breakout in the right direction before signaling the trade. The end result is an otherwise repainting indicator with a very reliable trading signal. The donchian breakout period is entered as an input. [ Installation Guide | Update Guide | Troubleshooting | FAQ | A
FREE
This indicator is an automated version of the Fibonacci retracement (Fib) indicator. Deciding the best areas to use when drawing the fib can be tricky and this  indicator was made with that in mind. When you drop it on the chart it will automatically choose the best points to draw the fib with, but in case you aren't satisfied with those regions, you can adjust it as you wish.
FREE
Are you tired of drawing trendlines every time you're analyzing charts? Or perhaps you would like more consistency in your technical analysis. Then this is for you. This indicator will draw trend lines automatically when dropped on a chart. How it works Works similar to standard deviation channel found on mt4 and mt5. It has 2 parameters: 1. Starting Bar 2. Number of bars for calculation The   starting bar   is the bar which drawing of the trend lines will begin, while the   number of bars for c
FREE
!! THE FIRST FREE NEURAL NETWORK EA WITH EXCELLENT AND REALISTIC RESULTS.!! Another beautiful work of art, guys you don't know the powerful creations that are created by my developer Nardus Van Staden. Check him out guys and gals, he is the real deal, an amazing person and a professional when it comes to coding and business, if you want work done!, hit him up! you can get in contact with him HERE . THE FOLLOWING PRODUCT IS A FREE VERSION OF A PAID VERSION THAT IS TO COME, PROFITS ARE GOING TO B
FREE
С этим продуктом покупают
SMART TREND TRADING SYSTEM — СПЕЦИАЛЬНОЕ ПРЕДЛОЖЕНИЕ Ваша торговая система. Ваш советник для автоматизации. Ваше обучение и поддержка. Купите Smart Trend Trading System для MT5 за 99 долларов США и получите Smart Universal Expert Advisor БЕСПЛАТНО для автоматизации сигналов системы. STTS объединяет направление тренда, сигналы входа и выхода, зоны разворота и важные ценовые уровни прямо на графике. Торгуйте по системе вручную или подключите входящий в комплект советник для автоматического исполне
Trend Sniper X
Sarvarbek Abduvoxobov
4.9 (39)
Trend Sniper X — это трендовый индикатор для MetaTrader 5, работающий на нескольких таймфреймах, который помогает трейдерам точно и ясно определять направление тренда и потенциальные точки разворота. для MT4: https://www.mql5.com/en/market/product/193245 Информация о цене: Текущая цена является промо-ценой и может измениться по мере выхода предстоящих обновлений и новых функций. Бонусное предложение: Чтобы получить БЕСПЛАТНЫЙ авто-трейд советник Assistant EA для этого индикатора, пожалуйста, на
Neuro Poseidon - новый индикатор от Дарьи Резуевой. Он сочетает точные торговые сигналы с адаптивными уровнями TP/SL , в результате создавая максимально выгодные сделки! TO SWITCH TO   ENG   PLEASE CHOOSE IT IN THE UPPER-RIGHT CORNER OF THE WEBSITE Напишите мне и получите  Neuro Poseidon Assistant  в подарок для автоматизации вашей торговли! Что отличает его от других индикаторов? 1. Доказанная прибыльность на всех активах и таймфреймах 2. На графике присутствуют только подтвержденные сигналы н
Zoryk Gold
Reda El Koutbane
5 (12)
Скидка заканчивается через 24 часа — следующая цена $ 69 ZORYK — продвинутая сигнальная система для XAUUSD в MetaTrader 5 Вам знакомо это чувство. Вы долго анализируете золото. Ждёте подходящего момента для входа. Наконец открываете сделку — и цена сразу начинает двигаться против вас. Вы закрываете позицию слишком рано, передвигаете Stop Loss или сомневаетесь всего несколько секунд. После этого рынок достигает именно той цели, которую вы ожидали изначально, но уже без вас. Проблема не всегда за
SuperScalp Pro
Van Minh Nguyen
4.65 (34)
SuperScalp Pro - Professional Multi-Layer Confluence Scalping System SuperScalp Pro — это продвинутый индикатор для скальпинга, который улучшает классический Supertrend с помощью нескольких интеллектуальных фильтров подтверждения. Он помогает определять торговые возможности Buy/Sell с более высокой вероятностью, значительно сокращая количество ложных сигналов. Чёткие стрелки Buy и Sell отображаются непосредственно на графике, а уровни Stop Loss и Take Profit на основе ATR автоматически рассчитыв
M1 SNIPER   — это простая в использовании торговая система. Это стрелочный индикатор, разработанный для тайм фрейма M1. Индикатор можно использовать как отдельную систему для скальпинга на тайм фрейме M1, а также как часть вашей существующей торговой системы. Хотя эта торговая система была разработана специально для торговли на M1, ее можно использовать и с другими тайм фреймами. Первоначально я разработал этот метод для торговли XAUUSD и BTCUSD. Но я считаю этот метод полезным и для торговли на
Gann Made Easy   - это профессиональная, но при этом очень простая в применении Форекс система, основанная на лучших принципах торговли по методам господина У.Д. Ганна. Индикатор дает точные BUY/SELL сигналы, включающие в себя уровни Stop Loss и Take Profit. ПОЖАЛУЙСТА, СВЯЖИТЕСЬ СО МНОЙ ПОСЛЕ ПОКУПКИ, ЧТОБЫ ПОЛУЧИТЬ ТОРГОВЫЕ ИНСТРУКЦИИ И ОТЛИЧНЫЕ ДОПОЛНИТЕЛЬНЫЕ ИНДИКАТОРЫ БЕСПЛАТНО! Вероятно вы уже не раз слышали о торговли по методам Ганна. Как правило теория Ганна отпугивает от себя не только
Давайте сначала будем честны. Ни один индикатор сам по себе не сделает вас прибыльным. Если кто-то говорит вам обратное — он продаёт вам мечту. Любой индикатор, который показывает идеальные стрелки покупки/продажи, можно сделать безупречным — просто увеличьте нужный участок истории и сделайте скриншот успешных сделок. Мы так делать не будем. SMC Intraday Formula — это инструмент. Он считывает структуру рынка за вас, определяет зоны с наивысшей вероятностью движения цены и точно показывает, как
UNIX SCALPER — СПЕЦИАЛЬНОЕ ПРЕДЛОЖЕНИЕ Найдите торговую ситуацию. Оцените план. Выберите способ торговли. Купите UNIX Scalper для MT5 за 99 долларов США и получите Smart Universal Expert Advisor БЕСПЛАТНО для автоматизации сигналов индикатора. UNIX Scalper объединяет анализ рынка, решения BUY/SELL/WAIT и уровни Entry, Stop Loss, TP1 и TP2 в одной удобной панели. Следуйте торговому плану вручную или подключите входящий в комплект советник для автоматического исполнения с выбранными вами настройка
Entry Points Pro — топ-1 индикатор по количеству отзывов (600 отзывов и 31 000 скачиваний обеих версий). Индикатор даёт самые перспективные точки входа в сделки без перерисовки на любых инструментах. Индикатор покажет заранее стрелкой точку входа в сделку, укажет цену входа и нарисует на графике уровень входа и стопа, а так же рассчитает рабочий лот под твой депозит и риск, а панель статистики поможет выбрать самый перспективный инструмент и таймфрейм .  Тебе остаётся поставить отложенный ордер
GoldenX Entry — это индикатор для MT5 с адаптивным алгоритмом Smart Entry Trend, системой оценки сигналов, детектором рыночных режимов и фильтром волатильности. Каждый сигнал включает рассчитанный уровень входа, три уровня Take-Profit (TP1, TP2, TP3) и уровень Stop-Loss. Он построен на нескольких аналитических слоях, предназначенных для адаптации к различным рыночным условиям, объединяя многоуровневую аналитическую систему со встроенным оптимизатором и системой статистического отслеживания. Инди
Reversion King Indicator
Eugen-alexandru Zibileanu
5 (9)
Новый король в городе — Индикатор + управление ордерами (TP1 + TP2 + TP3) + опциональный Telegram-сигнал-сендер ВКЛЮЧЁН (БЕСПЛАТНО) (ПОЛНОЦЕННАЯ ТОРГОВАЯ И СИГНАЛЬНАЯ СИСТЕМА) Gold Slayer EA Этот индикатор включает в себя продвинутую стратегию, торговую систему с настраиваемым управлением ордерами и систему mean reversion, которая сочетает расширения Envelope и поддерживается несколькими интеллектуальными фильтрами подтверждения, такими как RSI, для поиска высоковероятных точек разворота с сигн
Gold Entry Sniper – Профессиональная Мульти-Таймфрейм ATR Панель для Скальпинга и Свинг-Трейдинга на Золоте Gold Entry Sniper — это передовой индикатор для MetaTrader 5, разработанный для точных сигналов на покупку/продажу по XAUUSD и другим инструментам. Основан на логике ATR Trailing Stop и мульти-таймфрейм анализе , этот инструмент идеально подходит как для скальперов, так и для среднесрочных трейдеров, обеспечивая чёткие точки входа с высокой вероятностью . Основные возможности и преимуществ
Market Structure Order Block Dashboard MT5 — это индикатор MT5, разработанный для трейдеров, которые хотят читать рыночную структуру и основные зоны реакции цены прямо на графике. Он объединяет BOS, ChoCH, Order Blocks, Fair Value Gaps (FVG), Ликвидность, Kill Zones, Volume Profile и компактную панель для быстрого анализа. Индикатор предназначен для трейдеров, использующих рыночную структуру, концепции ICT и Smart Money как основу для принятия решений. Он помогает выявлять продолжения тренда, во
Welcome to ENTRY IN THE ZONE AND SMC MULTI TIMEFRAME Entry In The Zone and SMC Multi Timeframe is a real-time market analysis tool based on Smart Money Concepts (SMC), designed to analyze market structure, price direction, and key trading zones. It supports both Single-Timeframe Analysis and Multi-Timeframe Analysis, providing a clearer view of the overall market structure across multiple timeframes, with real-time BUY / SELL signals that do not repaint. It is designed to help filter trading opp
ATOMIC ANALYST — СПЕЦИАЛЬНОЕ ПРЕДЛОЖЕНИЕ Ваш анализ рынка. Ваш советник для автоматизации. Ваше обучение и поддержка. Купите Atomic Analyst для MT5 за 99 долларов США и получите Smart Universal Expert Advisor БЕСПЛАТНО для автоматизации сигналов индикатора. Atomic Analyst объединяет анализ ценового движения, направление тренда, сигналы входа и выхода, уровни Stop Loss и несколько уровней Take Profit прямо на графике. Торгуйте вручную, используя его анализ, или подключите входящий в комплект
Adaptive Price Action Engine Купи индикатор — получи советник (EA) к нему бесплатно Самооптимизирующийся мульти-таймфреймовый анализ тренда и свечных моделей Рынок постоянно меняется — и не каждая модель Price Action имеет одинаковую ценность в разных рыночных режимах. Adaptive Price Action Engine создан для адаптации к изменяющимся рыночным условиям, объединяя трендовую структуру, мульти-таймфреймовый анализ, свечные модели и статистическую оптимизацию в единой аналитической системе. Два адапти
Индикатор Tokyo Indicator обеспечивает наглядное представление о направлении тренда, потенциальных торговых сигналах и текущей рыночной ситуации. Его ступенчатая линия тренда с цветовой индикацией позволяет различать «бычьи» фазы (выделены синим цветом) и «медвежьи» фазы (выделены пурпурным цветом). Соответствующие стрелки указывают на возможные точки входа в рынок (покупку или продажу) при смене тренда. Встроенная информационная панель объединяет данные о текущем сигнале, рыночном настроении,
Currency Strength Wizard   — очень мощный индикатор, предоставляющий вам комплексное решение для успешной торговли. Индикатор рассчитывает силу той или иной форекс-пары, используя данные всех валют на нескольких тайм фреймах. Эти данные представлены в виде простых в использовании индексов валют и линий силы валют, которые вы можете использовать, чтобы увидеть силу той или иной валюты. Все, что вам нужно, это прикрепить индикатор к графику, на котором вы хотите торговать, и индикатор покажет вам
FiboSniper Pro – Multi-Filter Fibonacci System with Auto SL/TP and Control Panel FiboSniper Pro — это технический индикатор, который объединяет динамические Fibonacci Envelopes с несколькими фильтрами подтверждения для формирования отборных сигналов Buy и Sell. Уровни Fibonacci рассчитываются на основе Moving Average и ATR, а затем фильтруются с помощью ADX, EMA, RSI, ATR, Volume, Time и структуры свечи. Индикатор отображает на графике автоматические уровни Stop Loss и Take Profit на основе ATR,
Каждый покупатель этого индикатора получает дополнительно Бесплатно: Авторскую утилиту "Bomber Utility", которая автоматически сопровождает каждю торговую операцию, устанавливает уровни Стоп Лосс и Тейк профит и закрывает сделки согласно правилам этой стратегии, Сет-файлы для настройки этого индикатора на различных активах, Сет-файлы для настройки Bomber Utility в режимы: "Минимум Риска", "Взвешенный Риск" и "Стратегия Выжидания", Пошаговый видео-мануал, который поможет вам быстро установить, н
SMART PRICE ACTION CONCEPTS — СПЕЦИАЛЬНОЕ ПРЕДЛОЖЕНИЕ Изучайте структуру. Определяйте зоны. Создавайте торговый план. Приобретите Smart Price Action Concepts для MT5 за 49 USD и получите Smart Universal Expert Advisor БЕСПЛАТНО. Объедините Smart Money Concepts (SMC), анализ в стиле ICT и Price Action на одном упорядоченном графике. Определяйте структуру рынка, ордер-блоки, ориентиры ликвидности и дисбалансы, а затем выбирайте отображаемые элементы с помощью Smart Panel. Текущая цена 49 USD дейс
Superhero
Ihor Otkydach
5 (3)
SUPERHERO индикатор - это мультивалютная торговая система, которая создана по принципу "Все включено". Индикатор самостоятельно анализирует рынок и дает сигналы когда открывать и когда закрывать сделки. Используются ордера Стоп Лосс и Тейк профит. Соотношение R:R = 1:1 Эта система может присылать на смартфон PUSH-уведомления, так что вы сможете делать сделки "на ходу" без привязки к ПК. Отлично подходит для Проп Фирм трейдинга. БОНУС ДЛЯ КАЖДОГО ПОКУПАТЕЛЯ: Каждый покупатель этого индикатора пол
Volatility Master for MetaTrader is a real-time dashboard tool that scans up to  50 symbols  to identify high-volatility , trending markets instantly. With bullish/bearish signals, customizable alerts, and a user-friendly interface, it helps you avoid range-bound conditions and focus on high-probability trades. Clarity leads to confidence. Trade confidently and protect your capital effectively with this powerful dashboard. We don't offer free or bonus indicators in exchange of reviews from you.
Trend Trading - это индикатор, предназначенный для получения максимальной прибыли от трендов, происходящих на рынке, путем определения времени отката и прорыва. Он находит торговые возможности, анализируя, что делает цена во время установленных тенденций. [ Руководство по установке | Руководство по обновлению | Устранение неполадок | FAQ | Все продукты ] Торгуйте на финансовых рынках с уверенностью и эффективностью Прибыль от устоявшихся тенденций без проволочек Признать прибыльные откаты, пр
Power Candles V3 — самооптимизирующийся индикатор силы Power Candles V3 преобразует силу валюты и инструмента в готовый к использованию торговый план на каждом графике, к которому он прикреплен. Вместо того, чтобы просто раскрашивать свечи, он выполняет автоматическую оптимизацию в режиме реального времени в фоновом режиме и предоставляет вам оптимальные значения Stop Loss, Take Profit и порог сигнала для выбранного вами символа. Один клик — и все готово для реальной торговли: на графике появляю
IQ FX Gann Levels a precision trading indicator based on W.D. Gann’s square root methods . It plots real-time, non-repainting support and resistance levels to help traders confidently spot intraday and scalping opportunities with high accuracy. William Delbert Gann (W.D. Gann) was an exceptional market analyst, whose trading technique was based on a complex blend of mathematics, geometry, astrology, and ancient mathematics which proved to be extremely accurate. We don't offer free or bonus indic
Trend Catcher   анализирует движения рыночных цен, используя комбинацию собственных и индивидуально разработанных адаптивных индикаторов анализа тренда. Он определяет истинное направление рынка, отфильтровывая краткосрочные шумы и фокусируясь на силе импульса, расширении волатильности и поведении ценовой структуры. Он также использует комбинацию сглаживающих и фильтрующих тренд индикаторов, таких как скользящие средние, RSI и фильтры волатильности. Мониторинг реальных операций, а также другие
RelicusRoad Pro: Квантовая Рыночная Операционная Система СКИДКА 70% ПОЖИЗНЕННЫЙ ДОСТУП (ОГРАНИЧЕНО) - ПРИСОЕДИНЯЙТЕСЬ К 2000+ ТРЕЙДЕРАМ Почему большинство трейдеров теряют деньги даже с «идеальными» индикаторами? Потому что они торгуют Единичными Концепциями в вакууме. Сигнал без контекста — это лотерея. Чтобы выигрывать стабильно, вам нужна КОНФЛЮЭНЦИЯ . RelicusRoad Pro — это не простой стрелочный индикатор. Это полная Количественная Рыночная Экосистема . Она отображает «Дорогу Справедливой Сто
Axiom Matrix — СПЕЦИАЛЬНОЕ ПРЕДЛОЖЕНИЕ Купите Axiom Matrix за 49 USD и получите Smart Universal Expert Advisor БЕСПЛАТНО. Сканируйте рынок. Сравнивайте ситуации. Выбирайте следующий график. Axiom Matrix объединяет анализ нескольких инструментов и таймфреймов в одной панели. Определяйте, на чём сосредоточиться, без просмотра каждого графика отдельно. Сканирование Обзора рынка или выбранных инструментов на нескольких таймфреймах. Сравнение тренда, импульса, объёма, волатильности и качества рыночны
Другие продукты этого автора
QuantMatrix Probability AI Free QuantMatrix Probability AI Free is a technical indicator for MetaTrader 5 that combines several measurements of current market conditions into three numerical estimates. The indicator uses exponential moving averages, Relative Strength Index (RSI), Average True Range (ATR) and the current price position in its calculation. These measurements are combined into a normalized market score. The resulting information is displayed on the chart as: BUY percentage SELL p
FREE
QuantMatrix Candle Patterns is a free MetaTrader 5 indicator designed to identify classic candlestick formations directly on the chart. The indicator analyzes completed candles and detects recognized bullish, bearish and neutral price-action patterns. When a valid bullish or bearish formation is confirmed, the corresponding BUY or SELL signal is displayed on the following candle . This means the signal is only generated after the source pattern has been completed. The indicator also displays a c
FREE
QuantMatrix Wick Pressure QuantMatrix Wick Pressure is a technical indicator for MetaTrader 5 that measures the relationship between upper and lower candlestick wicks and converts this information into a numerical pressure measurement. Candlestick wicks represent price movement that occurred beyond the candle body before price returned from those levels. The indicator measures this rejection behavior over consecutive candles and displays the result in a separate indicator window. Positive values
FREE
QuantMatrix Volatility Regime QuantMatrix Volatility Regime is a technical indicator for MetaTrader 5 that evaluates the current volatility of the selected symbol and timeframe. The indicator uses Average True Range (ATR) to compare current volatility with a historical baseline calculated from previous bars. Based on this comparison, the current market condition is classified into one of four volatility regimes: LOW – current volatility is below the historical baseline. NORMAL – current volatil
FREE
QuantMatrix Probability AI PRO QuantMatrix Probability AI PRO is a technical indicator for MetaTrader 5 designed to evaluate current market conditions and present them as BUY, SELL and NEUTRAL percentage estimates. The indicator combines several market measurements, including trend, momentum, volatility, price position, candlestick wick behavior and breakout conditions. It also compares the current market state with similar historical situations found in the selected symbol and timeframe. The hi
QM Candle Timing Meter is a free MetaTrader 5 indicator designed to answer one simple question: How late am I in the current candle? A trading signal may still be technically valid while the timing of the entry has already changed significantly. For example, entering during the first minutes of an H1 candle is very different from entering when 90% of that candle has already elapsed. QM Candle Timing Meter continuously measures the temporal position of the current candle and displays this informa
FREE
QuantMatrix FX+Gold V8.4 Адаптивная количественная торговля на Forex и Gold QuantMatrix FX+Gold V8.4 — многоактивный Expert Advisor для торговли на Forex и Gold (XAUUSD) . Вместо одной фиксированной стратегии QuantMatrix использует исследовательскую архитектуру, предназначенную для поиска, проверки, ранжирования и постоянного мониторинга торговых моделей на основе исторического поведения каждого рынка. Главный принцип: Не рынок должен подстраиваться под стратегию. Стратегия должна доказать, что
QuantMatrix Candle Exhaustion QuantMatrix Candle Exhaustion is a technical indicator for MetaTrader 5 that identifies candles showing predefined price expansion and wick characteristics. The indicator compares the range of the current candle with the average range of previous candles. When the candle range exceeds the configured historical range threshold, its upper and lower wicks are evaluated. A bullish exhaustion marker can be displayed when an expanded bullish candle also contains the requi
QuantMatrix False Breakout Detector QuantMatrix False Breakout Detector is a technical indicator for MetaTrader 5 that identifies potential failed breakouts of recent price ranges. The indicator calculates the highest high and lowest low within a configurable historical period. It then evaluates whether the current price moves beyond one of these levels by a minimum volatility-adjusted distance and subsequently closes back inside the previous range. Average True Range (ATR) is used to adjust the
QuantMatrix Historical Move Probability QuantMatrix Historical Move Probability is a statistical indicator for MetaTrader 5 that compares the current price movement with similar movements found in the historical data of the selected symbol and timeframe. Price movements are normalized using Average True Range (ATR). This allows movements from different historical periods to be compared relative to the volatility present at each period. The indicator searches the configured historical sample for
QuantMatrix Prism Structure is a MetaTrader 5 indicator for visual analysis of market structure. It identifies confirmed swing highs and swing lows and displays structural information directly on the chart. The indicator can display higher highs, higher lows, lower highs, lower lows, structure changes, fair value gap areas and ATR based information. A chart panel summarizes the current structure state, recent structural events and relevant market information. The indicator is intended for m
QuantMatrix Volume Depth is a MetaTrader 5 indicator for visual analysis of market activity across different price levels. The indicator builds a horizontal profile across the analyzed price range and shows where trading activity has been concentrated. It displays the Point of Control, Value Area High, Value Area Low and the distribution of activity across multiple price levels. The indicator can use real volume when it is available from the symbol. When real volume is not available, tick vol
Фильтр:
str8derx
79
str8derx 2026.09.03 15:03 
 

Пользователь не оставил комментарий к оценке

Ответ на отзыв