QM FlowVision X1

  • Indicadores
  • Rafael Barreto Haddad
    Rafael Barreto Haddad
    • Rafael Haddad → QuantMatrix → quantitative trading research em  Quantitative Trading Systems Researcher
    • Brasil
    • 1884
    Criador da série de pesquisa QuantMatrix para MetaTrader 5.
    Desenvolvo sistemas quantitativos de trading, Expert Advisors adaptativos e ferramentas de análise de mercado baseadas em evidências históricas, validação de estratégias e avaliação contínua de modelos.
  • Versão: 1.10
QM FlowVision X1

Visual Multi-Factor Trading Indicator with Historical Probability, Market Flow, Momentum, Divergence and Multi-Timeframe Context

QM FlowVision X1 is a visual decision-support indicator for MetaTrader 5 designed to transform multiple market conditions into a simple and readable trading state.

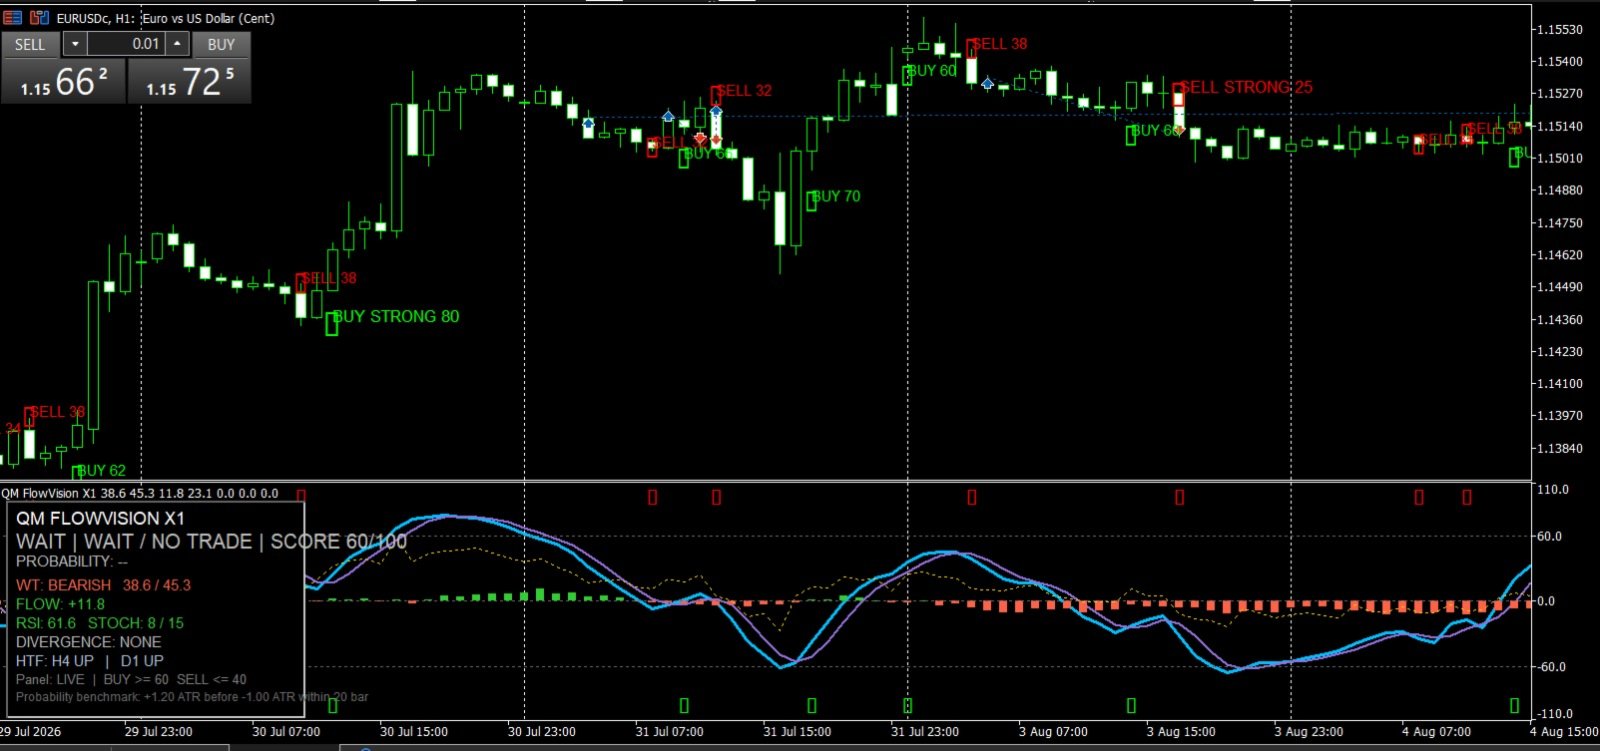
Instead of displaying isolated oscillators without interpretation, FlowVision combines momentum, money flow, RSI, Stochastic RSI, divergence and higher-timeframe context into a unified 0–100 directional score.

The indicator then classifies the current market condition as:

  • STRONG BUY

  • BUY

  • WAIT / NO TRADE

  • SELL

  • STRONG SELL

In addition to the directional score, FlowVision includes a Historical Probability Engine that analyzes how similar signals behaved in the past.

This allows the trader to distinguish between two completely different concepts:

Score = how strongly the current indicators agree.

Probability = how similar historical signals actually performed.

Main Features

1. Visual Wave Momentum Engine

FlowVision displays two momentum waves designed to identify changes in market direction and momentum.

The relationship between Wave 1 and Wave 2 is used as one of the main components of the directional score.

Bullish and bearish crossings can also participate in signal generation, particularly when they occur in relevant momentum zones.

2. Money Flow

A visual Money Flow histogram helps identify current buying or selling pressure.

  • Green = positive flow

  • Red = negative flow

Money Flow is included directly in the FlowVision scoring model.

This helps distinguish a momentum signal supported by market pressure from one occurring against the current flow.

3. RSI

FlowVision includes an RSI component as part of its multi-factor analysis.

RSI is not used as a standalone BUY or SELL system.

Instead, it contributes to the total directional score and helps identify whether momentum is strengthening, weakening or remaining neutral.

4. Stochastic RSI

Stochastic RSI is used as an additional momentum confirmation layer.

The relationship between its K and D components contributes to the FlowVision score.

This provides a faster momentum component alongside the slower Wave and RSI structures.

5. Divergence Detection

FlowVision automatically detects regular bullish and bearish divergences between price and the internal Wave structure.

Bullish divergence:

Price forms a lower low while the oscillator forms a higher low.

Bearish divergence:

Price forms a higher high while the oscillator forms a lower high.

Divergences are confirmed only after the required pivot structure exists.

They are therefore treated as confirmed events rather than being projected into the past before confirmation.

6. Multi-Timeframe Context

FlowVision includes two higher-timeframe context filters.

With Auto HTF enabled, the higher timeframes automatically adapt when the chart timeframe changes.

Default automatic structure:

M1–M5

  • Context 1: M15

  • Context 2: H1

M6–M30

  • Context 1: H1

  • Context 2: H4

H1–H3

  • Context 1: H4

  • Context 2: D1

H4–H12

  • Context 1: D1

  • Context 2: W1

D1

  • Context 1: W1

  • Context 2: MN1

The user can disable Auto HTF and manually select both higher timeframes.

Higher-timeframe context is determined using fast and slow EMA relationships.

7. FlowVision Score — 0 to 100

The indicator combines six analysis groups into one directional score:

  • Wave momentum

  • Money Flow

  • RSI

  • Stochastic RSI

  • Divergence

  • Higher-timeframe context

The final value ranges from 0 to 100.

Default interpretation:

75–100
STRONG BUY

60–74
BUY

41–59
WAIT / NO TRADE

26–40
SELL

0–25
STRONG SELL

These thresholds can be changed in the indicator inputs.

The score represents market confluence, not historical win probability.

8. Historical Probability Engine

One of the main features of QM FlowVision X1 is its internal Historical Probability Engine.

When the current state reaches BUY or SELL territory, FlowVision searches the historical data of the current symbol and timeframe for previous signals in the same direction with a similar FlowVision score.

By default, signals are considered similar when their scores are within ±10 points of the current score.

The indicator then evaluates what happened after each historical signal.

Default benchmark:

Target: +1.20 ATR

Stop reference: -1.00 ATR

Maximum evaluation horizon: 20 candles

For a BUY signal, the historical event is considered successful when price reaches +1.20 ATR before falling -1.00 ATR.

For a SELL signal, the logic is reversed.

If both target and stop are reached inside the same candle, FlowVision applies the conservative assumption and records the event as a loss.

9. Probability Is Different from Score

This distinction is important.

An example:

BUY
Score: 82/100
Historical Probability: 64%

This means the current technical conditions have strong bullish confluence, while approximately 64% of the resolved similar historical BUY signals reached the configured target before the configured stop.

Another example:

STRONG BUY
Score: 87/100
Historical Probability: 46%

The technical picture may currently be strongly bullish, but historically similar signals did not produce a strong success rate.

FlowVision allows the trader to see both pieces of information instead of assuming that a high indicator score automatically represents a high statistical probability.

10. Sample Size

Historical probability is displayed together with the number of historical observations.

The panel uses the following sample-quality classification:

INSUFFICIENT
Less than the configured minimum sample size. Default: 30 resolved samples.

LOW
30–99 resolved samples.

MODERATE
100–299 resolved samples.

HIGH
300 or more resolved samples.

This is important because a probability calculated from a very small sample should not be interpreted in the same way as a probability calculated from hundreds of historical occurrences.

FlowVision also displays:

N = resolved historical samples

U = unresolved historical samples

11. Probability Smoothing

Historical probability uses Laplace smoothing.

This reduces extreme probability readings caused by small samples.

For example, a very small group of winning observations will not immediately be displayed as an unrealistic 100% probability.

12. Historical Expectancy

FlowVision also calculates historical expectancy in R.

Example:

EXP +0.32R

indicates that the historical group of similar signals produced an average positive outcome equivalent to approximately +0.32 units of the configured risk reference.

A negative expectancy indicates that similar historical signals produced a negative average result under the current probability benchmark.

Probability and expectancy should be analyzed together.

A high win rate does not automatically mean positive expectancy.

13. Visual Trading Panel

The FlowVision panel provides an immediate overview of the market.

It displays:

  • Current market state

  • FlowVision Score

  • BUY or SELL Historical Probability

  • Historical sample size

  • Unresolved samples

  • Historical expectancy

  • Wave direction

  • Money Flow

  • RSI

  • Stochastic RSI

  • Divergence status

  • Higher-timeframe context

  • Probability benchmark

Example:

QM FLOWVISION X1

BUY | STRONG BUY | SCORE 81/100

BUY PROB: 66.4% | N=214 | EXP +0.31R | MODERATE

WT: BULLISH

FLOW: +18.2

RSI: 61.4

STOCH: 72 / 64

DIVERGENCE: BULLISH

HTF: H1 UP | H4 UP

14. BUY and SELL Signals

FlowVision does not generate a new signal simply because the score remains inside BUY or SELL territory.

The internal trigger engine evaluates events such as:

  • Entry of the score into a BUY or SELL state

  • Wave momentum crossing in a relevant zone

  • Confirmed bullish or bearish divergence

A valid BUY requires the FlowVision score to be inside BUY territory.

A valid SELL requires the FlowVision score to be inside SELL territory.

This reduces repetitive signals while the same market condition remains active.

15. Historical Chart Signals

Confirmed BUY and SELL events can be displayed directly on the main price chart.

BUY signals appear below price.

SELL signals appear above price.

Signal labels can also display the corresponding FlowVision score.

Strong signals receive additional visual emphasis.

16. Closed-Bar Signal Confirmation

Historical signal arrows and alerts are generated from confirmed closed candles.

This is designed to prevent an unfinished candle from being presented as a completed trading signal.

The live panel is different:

The panel continuously represents the current candle and can therefore change while that candle is forming.

Traders should understand the distinction between:

  • Live market analysis

  • Confirmed closed-bar signals

17. Alerts

FlowVision supports MetaTrader alerts when a confirmed BUY or SELL signal is generated.

Optional Push Notifications are also available.

Signal alerts can include:

  • Symbol

  • Direction

  • Signal strength

  • Score

  • Historical probability

  • Number of samples

  • Historical expectancy

  • Current timeframe

How to Read FlowVision

A simple way to use the indicator is to analyze four layers.

Layer 1 — Direction

Start with the current FlowVision state.

STRONG BUY / BUY
Bullish environment.

WAIT / NO TRADE
Insufficient directional agreement.

SELL / STRONG SELL
Bearish environment.

Layer 2 — Historical Probability

Check whether similar signals performed well historically.

Example:

BUY Score 72
Probability 64%
N=185

This carries more historical information than:

BUY Score 72
Probability 75%
N=8

Sample size matters.

Layer 3 — Expectancy

Check whether historical expectancy is positive.

A positive probability combined with positive expectancy represents stronger historical evidence than win rate alone.

Layer 4 — Context

Observe:

  • Wave direction

  • Money Flow

  • RSI

  • Stochastic RSI

  • Divergence

  • Higher-timeframe direction

The panel allows traders to understand why the score is bullish, neutral or bearish.

Example Bullish Reading

STRONG BUY

Score: 82/100

Historical Probability: 67%

Samples: 236

Expectancy: +0.34R

Wave: Bullish

Money Flow: Positive

RSI: Bullish

Stochastic: Bullish

H1 Context: UP

H4 Context: UP

This represents strong technical confluence combined with positive historical statistics.

Example No-Trade Reading

WAIT / NO TRADE

Score: 53/100

Wave: Bullish

Money Flow: Negative

RSI: Neutral

Stochastic: Bearish

HTF Context: Mixed

FlowVision identifies conflicting information and does not classify the market as a directional BUY or SELL condition.

Example of Technical Strength with Weak Historical Evidence

STRONG BUY

Score: 81/100

Probability: 48%

Samples: 301

Expectancy: -0.07R

The current technical structure is strongly bullish, but historically similar BUY signals did not demonstrate a positive statistical advantage under the selected ATR benchmark.

This is exactly why FlowVision keeps Score and Probability separate.

Main Inputs

Core / Wave

WT Channel Length
Controls the main Wave smoothing period.

Default: 9

WT Average Length
Controls the WaveTrend average.

Default: 12

WT Signal Length
Controls the secondary Wave signal smoothing.

Default: 3

WT Overbought
Default: 53

WT Oversold
Default: -53

Flow / RSI / Stochastic

Flow Period
Default: 34

RSI Period
Default: 14

Stochastic Period
Default: 14

Stochastic K Smooth
Default: 3

Stochastic D Smooth
Default: 3

Higher-Timeframe Context

Auto HTF
Automatically selects higher-timeframe context according to the chart timeframe.

Default: true

HTF1 / HTF2
Manual higher timeframes used when Auto HTF is disabled.

Fast EMA
Default: 20

Slow EMA
Default: 50

Signal Thresholds

Strong Buy Score
Default: 75

Buy Score
Default: 60

Sell Score
Default: 40

Strong Sell Score
Default: 25

WT Trigger Zone
Default: 25

Historical Probability Settings

Probability Lookback Bars
Default: 3000

Maximum historical search window used by the probability engine.

Forward Bars
Default: 20

Maximum number of candles evaluated after each historical signal.

ATR Period
Default: 14

Target ATR
Default: 1.20

Stop ATR
Default: 1.00

Score Tolerance
Default: 10

Controls how similar a historical signal's FlowVision score must be compared with the current score.

Minimum Display Sample
Default: 30

Used to classify very small statistical samples as insufficient.

Visual Settings

Users can enable or disable:

  • RSI display

  • Score line

  • Price-chart arrows

  • Signal text

  • Information panel

  • Historical signal display

The number of historical signal bars and maximum calculation bars can also be configured.

Alerts

Enable Alerts
Enables standard MetaTrader signal alerts.

Enable Push
Enables MetaTrader Push Notifications when configured in the terminal.

Timeframes

QM FlowVision X1 automatically recalculates when the chart timeframe changes.

The signal engine always analyzes the active chart timeframe.

Higher-timeframe context automatically adjusts when Auto HTF is enabled.

Because market behavior differs between symbols and timeframes, historical probability and expectancy should always be interpreted specifically for the currently selected symbol and timeframe.

Markets

FlowVision is designed as a multi-factor technical analysis tool and can be applied to different MetaTrader 5 symbols where sufficient historical price data is available.

Results and historical statistics can differ significantly between:

  • Forex pairs

  • Metals

  • Indices

  • Cryptocurrencies

  • Different brokers

  • Different timeframes

  • Different market conditions

Users should evaluate the indicator on the specific market and timeframe they intend to trade.

Important Information

QM FlowVision X1 is an indicator.

It does not open, manage or close trades.

It does not guarantee future market performance.

Historical probability represents the historical behavior of similar FlowVision signals under the configured ATR target, stop and evaluation horizon.

Historical statistics do not guarantee that the same behavior will occur in the future.

Probability should not be interpreted as certainty.

The live panel may change while the current candle is still forming.

Confirmed signal arrows and alerts are based on closed-bar conditions.

Trading involves financial risk. Always evaluate the method according to your own strategy, account size and risk tolerance.


Automated Trading
QM FlowVision X1 is designed for manual market analysis and does not execute trades.
Traders who prefer automated execution can use the separate QM FlowVision EA X1, an Expert Advisor from the same FlowVision product family.
The EA contains its own signal engine and does not require this indicator to be installed.
Related FlowVision products can be found among the author's products in the MQL5 Market.

Recommended First Use

For the first evaluation:

  1. Keep the default parameters.

  2. Enable Auto HTF.

  3. Open the desired symbol and timeframe.

  4. Observe the FlowVision Score.

  5. Compare Score with Historical Probability.

  6. Check the number of historical samples.

  7. Check Historical Expectancy.

  8. Observe Wave, Money Flow and higher-timeframe alignment.

  9. Use confirmed BUY and SELL signals together with your own risk-management process.

Do not interpret a single component in isolation.

The purpose of FlowVision is to combine technical information, historical behavior and market context into one visual decision-support environment.

QM FlowVision X1

See the signal. Understand the context. Measure the history.

Produtos recomendados
High Low Open Close
Alexandre Borela
4.98 (45)
Se você gosta deste projeto, deixe uma revisão de 5 estrelas. Este indicador desenha os preços abertos, altos, baixos e finais para o especificado período e pode ser ajustado para um fuso horário específico. Estes são níveis importantes olhados por muitos institucional e profissional comerciantes e pode ser útil para você saber os lugares onde eles podem ser mais activa. Os períodos disponíveis são: Dia anterior. Semana anterior. Mês anterior. Quarto anterior. Ano anterior. Ou: Dia atual. Seman
FREE
O Pivot Point Fibo RSJ é um indicador que traça as linhas de suporte e resistência do dia usando as proporções   de Fibonacci. Este indicador espetacular cria até 7 níveis de suporte e resistência por meio do Pivot Point usando proporções de Fibonacci. É fantástico como os preços respeitam cada nível deste suporte e resistência, onde é possível perceber possíveis pontos de entrada / saída de uma operação. Recursos Até 7 níveis de suporte e 7 níveis de resistência Defina as cores dos níveis indi
FREE
RBM Delta Gold
Renato Brendim Medici
5 (1)
O mercado do ouro não se move apenas por preço. Ele se move por agressão, desequilíbrio e fluxo. O Delta foi criado exatamente para revelar isso. O Indicador Delta XAUUSD da RBM Trader identifica a diferença entre compradores e vendedores agressivos dentro do mercado, ajudando o trader a enxergar pressão real antes que o movimento fique óbvio no gráfico. Enquanto a maioria opera apenas candles, o Delta mostra o que está acontecendo por trás da movimentação do preço. O indicador foi desenvolv
FREE
VolumeBasedColorsBars
Henrique Magalhaes Lopes
VolumeBasedColorsBars — Free Powerful Volume Analysis for All Traders Unlock the hidden story behind every price bar! VolumeBasedColorsBars is a professional-grade, 100% FREE indicator that colorizes your chart candles based on real, adaptive volume analysis. Instantly spot surges in market activity, identify exhaustion, and catch the moves that matter. This indicator gives you:    • Dynamic color-coded bars for instant volume context    • Adaptive thresholds based on historical, session-awar
FREE
MACD Colored ZeroLag
Farzin Sadeghi Bonjar
4.73 (11)
It is the MQL5 version of zero lag MACD that was available for MT4 here: https://www.mql5.com/en/code/9993 Also there was a colored version of it here but it had some problems: https://www.mql5.com/en/code/8703 I fixed the MT4 version which has 95 lines of code. It took me 5 days to write the MT5 version.(reading the logs and testing multiple times and finding out the difference of MT5 and MT4!) My first MQL5 version of this indicator had 400 lines of code but I optimized my own code again and n
FREE
Fibomathe
Almaquio Ferreira De Souza Junior
Fibomathe Indicator: Support and Resistance Tool for MT5 The Fibomathe Indicator is a technical analysis tool designed for MetaTrader 5 (MT5) that assists traders in identifying support and resistance levels, take-profit zones, and additional price projection areas. It is suitable for traders who use structured approaches to analyze price action and manage trades. Key Features Support and Resistance Levels: Allows users to define and adjust support and resistance levels directly on the chart.
FREE
Apex Point
Marco Engstermann
Apex Point is a trend-following indicator for MetaTrader 5, transforming complex market data into signals for traders. It displays blue dots for uptrends, red dots for downtrends, and yellow crosses at potential reversals, helping users identify momentum shifts quickly. Key features include a confirmation system requiring multiple bars (default: 3) to validate changes, reducing false signals; dynamic ATR-based offsets for adaptive trailing, with instant ratcheting in the trend direction and smo
FREE
Friend of the trend : Seu Rastreador de Tendências Domine o mercado com o Friend of the trend , o indicador que simplifica a análise de tendências e te ajuda a identificar os melhores momentos para comprar, vender ou esperar. Com um design intuitivo e visualmente impactante, o Trend Analisa os movimentos de preço e entregar sinais através de um histograma colorido: Barras Verdes : Sinalizam uma tendência de alta, indicando oportunidades de compra. Barras Vermelhas : Alertam para uma tendência de
FREE
Эксперт  MACD_LevelTrader MT5   создан для торговле валютной пары XAUUSD. Данная версия это наработки того, что можно извлечь  из  индикатора MACD и Moving Average.  Важно   перед тестированием изменить настройку с 1000 на 5000                       Offset in points UP from SMA200 for sell              5000                       Offset in points DOWN from SMA200 for buy        5000   Тайм фрейм  М5. Два варианта логики, П араметр  true=вход по уровню  MACD +   SMA200, false=вход по MACD  Тестиру
FREE
Pivot Points Indicator – a fast, reliable, and fully customizable pivot detection for MetaTrader 5. This indicator uses MetaTrader’s native iHighest and iLowest functions to identify pivot highs and lows by scanning for the highest and lowest prices within a user-defined window of bars. A pivot is confirmed only when the current bar is the absolute maximum or minimum within the selected range, ensuring accurate and timely signals based on robust built-in logic. Key Features No Repainting : Onc
FREE
Free automatic Fibonacci is an indicator that automatically plots a Fibonacci retracement based on the number of bars you select on the BarsToScan setting in the indicator. The Fibonacci is automatically updated in real time as new highest and lowest values appears amongst the selected bars. You can select which level values to be displayed in the indicator settings. You can also select the color of the levels thus enabling the trader to be able to attach the indicator several times with differe
FREE
Donchian Breakout And Rsi
Mattia Impicciatore
4.5 (2)
Descrição geral Este indicador é uma versão aprimorada do Canal Donchian clássico, enriquecida com funções práticas para o trading real. Além das três linhas padrão (máxima, mínima e linha do meio), o sistema detecta breakouts e os mostra visualmente com setas no gráfico, exibindo apenas a linha oposta à direção da tendência atual para uma leitura mais limpa. O indicador inclui: Sinais visuais : setas coloridas nos breakouts Notificações automáticas : alerta pop-up, push e e-mail Filtro RSI : pa
FREE
PROMETHEUS TECHNICAN VERSION Free | By THE SONS A gift from The Sons — no strings, no trial, no expiry. Every trader deserves access to professional-grade market intelligence. That belief is why Prometheus Technical Version exists, and why it costs nothing. Consider it our handshake to the trading community. What You're Getting This is not a simplified tool dressed up as a gift. Prometheus Technican Version is a fully built, institutional-quality technical analysis indicator running a dual-model
FREE
Volume profile CVD Frato
Francisco Felipe Alves Da Silva Rocha
5 (2)
Frato Volume Profile Pro v7.5 Desenvolvido por Frato Academy Este indicador exibe o perfil de volume de preco para o MetaTrader 5. Ele calcula a distribuicao de volume negociado por nivel de preco ao longo de um periodo configuravel e apresenta os resultados diretamente no grafico principal. Funcionalidades: Perfil de volume com gradiente de cor O indicador divide o intervalo de preco em niveis e atribui a cada nivel o volume correspondente. A cor de cada nivel varia em gradiente continuo de
FREE
The   OHLC indicator   shows the current and historical values of High, Low, Open, Close and Mid for a specific time period. It can plot the current values or the values from the previous session. The indicator's range can be calculated from a daily, weekly, monthly, or user-specified session. Levels High  of the current or previous session. Low  of the current or previous session. Open  of current or previous session. Close  of the current or previous session. Midpoint  of the current or prev
FREE
Dynamic Pivot Zones
Vincent Jose Proenca
Dynamic Pivot Zones – Your Level Assistant on the Chart This indicator is a bit like a GPS for your trading . It shows you where the price likes to hang out, where it gets nervous, and where it flies through. No more calculating pivots by hand or guessing support and resistance levels. What it does: Automatically plots H1, H4, and D1 pivots . Shows support and resistance zones : R1, R2, S1, S2. Lines are colored and easy to read , so you can instantly see what’s hot or cold. Why you’ll love it:
FREE
MSX Hybrid Heiken Scalper
Som Prakash Gehlot
5 (1)
MSX Hybrid Heiken Scalper Overview MSX Hybrid Heiken Scalper is a MetaTrader 5 indicator based on a modified Heiken Ashi methodology with closed-bar smoothing. The indicator is designed to display trend direction through color-coded candles while reducing sensitivity to short-term market fluctuations. All calculations are performed using completed candles, allowing historical values to remain fixed after bar close. Features • Modified Heiken Ashi calculation • Closed-bar processing • Color-code
FREE
LT Donchian Channel
Thiago Duarte
4.86 (7)
Donchian Channel (ou canal de Donchian) é um indicador criado por  Richard Donchian. Ele é  formado tomando a máxima mais alta e a mais baixa mais baixa do último período especificado em velas. A área entre alta e baixa é o canal para o período escolhido. Sua configuração é simples. É possível ter a média entre a linha superior e inferior além de alertas quando o preço atinge um dos lados. Se tiver alguma dúvida ou encontrar alguma falha, me contate. Faça bom uso!
FREE
Pin Bars MT5
Yury Emeliyanov
Main purpose:   "Pin Bars"   is designed to automatically detect pin bars on financial market charts. A pin bar is a candle with a characteristic body and a long tail, which can signal a trend reversal or correction. How it works:   The indicator analyzes each candle on the chart, determining the size of the body, tail and nose of the candle. When a pin bar corresponding to predefined parameters is detected, the indicator marks it on the chart with an up or down arrow, depending on the directi
FREE
O Trade Behavior Mirror lê apenas o histórico de operações já encerradas da sua própria conta e conta um único padrão: abrir uma nova posição pouco depois de uma perda realizada, com um lote maior do que o seu volume habitual. A ferramenta não prevê nada e não dá nenhum conselho. Cada número no painel é algo que já aconteceu nesta conta. Como os números são construídos: ela lê até 31 dias de negociações encerradas em todos os símbolos e todos os números mágicos - é uma visão de toda a conta, nã
FREE
RBM Smc
Renato Brendim Medici
RBM SMC Liquidity Hunter MT5 — Indicador de Estrutura e Liquidez Institucional O RBM SMC Liquidity Hunter é uma ferramenta profissional desenvolvida para mapear a dinâmica dos Smart Money Concepts (SMC) no gráfico. O indicador rastreia quebras de estrutura, valida zonas de oferta e demanda por deslocamento de preço e identifica capturas de liquidez confirmadas por volume, integrando todas as confluências em um painel executivo no gráfico. Principais Funcionalidades  Mapeamento de Estrutura (B
FREE
Curver Arrows
Francis Dube
3.75 (4)
Este indicador é uma porta em linha reta de um conhecido indicador MetaTrader 4 que está disponível gratuitamente na Internet. Ele não redesenha. Ele implementa um tipo de estratégia de fuga. As setas indicam a direção do mercado. Use o indicador em gráficos M15 e superior.
FREE
Calmer chart context, kept practical Northstar Flow Candles MT5 is a chart-window indicator that presents Heikin Ashi candles with a five-state trend context. It is designed for traders who want a quieter view of price while keeping the native chart available as an optional reference. Visual-only indicator: Northstar Flow Candles MT5 does not place trades and does not send popup, push, or email notifications. What appears on the chart Five candle states: strong bullish, bullish, balanced, bearis
FREE
Show Pips for MT5
Roman Podpora
4.5 (32)
Este indicador de informação será útil para quem quer estar sempre atento à situação atual da conta. VERSION MT 4 -   More useful indicators O indicador exibe dados como lucro em pontos, porcentagem e moeda, bem como o spread do par atual e o tempo até o fechamento da barra no período atual. Existem várias opções para colocar a linha de informação no gráfico: À direita do preço (corre atrás do preço); Como comentário (no canto superior esquerdo do gráfico); No canto selecionado da tela. Também é
FREE
MTF Lines PRO
Renato Fiche Junior
3 (2)
Este indicador foi desenvolvido para auxiliar na análise de um ativo em múltiplos tempos gráficos. Nas configurações do indicador, o usuário escolhe a cor, largura e estilo das linhas horizontais para cada tempo gráfico. Dessa forma, as linhas horizontais automaticamente terão a configuração definida para o tempo gráfico ao serem adicionadas no gráfico. O MTF Lines também permite o controle de visibilidade de outros objetos como retângulos, linhas de tendência e textos. Este é mais um produto
FREE
MACD Enhanced
Nikita Berdnikov
4 (4)
Introducing the MACD  Enhanced – an advanced MACD (Moving Average Convergence Divergence) indicator that provides traders with extended capabilities for trend and momentum analysis in financial markets. The indicator uses the difference between the fast and slow exponential moving averages to determine momentum, direction, and strength of the trend, creating clear visual signals for potential entry and exit points. Attention! To achieve the best results, it is recommended to adapt the indicator
FREE
PZ Penta O MT5
PZ TRADING SLU
3.8 (5)
The Penta-O is a 6-point retracement harmonacci pattern which usually precedes big market movements. Penta-O patterns can expand and repaint quite a bit. To make things easier this indicator implements a twist: it waits for a donchian breakout in the right direction before signaling the trade. The end result is an otherwise repainting indicator with a very reliable trading signal. The donchian breakout period is entered as an input. [ Installation Guide | Update Guide | Troubleshooting | FAQ | A
FREE
This indicator is an automated version of the Fibonacci retracement (Fib) indicator. Deciding the best areas to use when drawing the fib can be tricky and this  indicator was made with that in mind. When you drop it on the chart it will automatically choose the best points to draw the fib with, but in case you aren't satisfied with those regions, you can adjust it as you wish.
FREE
Are you tired of drawing trendlines every time you're analyzing charts? Or perhaps you would like more consistency in your technical analysis. Then this is for you. This indicator will draw trend lines automatically when dropped on a chart. How it works Works similar to standard deviation channel found on mt4 and mt5. It has 2 parameters: 1. Starting Bar 2. Number of bars for calculation The   starting bar   is the bar which drawing of the trend lines will begin, while the   number of bars for c
FREE
Exact Neuron Genuine Algo Genius Engaged
Toha Arekaatera Akutina Gage
3.8 (5)
!! THE FIRST FREE NEURAL NETWORK EA WITH EXCELLENT AND REALISTIC RESULTS.!! Another beautiful work of art, guys you don't know the powerful creations that are created by my developer Nardus Van Staden. Check him out guys and gals, he is the real deal, an amazing person and a professional when it comes to coding and business, if you want work done!, hit him up! you can get in contact with him HERE . THE FOLLOWING PRODUCT IS A FREE VERSION OF A PAID VERSION THAT IS TO COME, PROFITS ARE GOING TO B
FREE
Os compradores deste produto também adquirem
SMART TREND TRADING SYSTEM — OFERTA ESPECIAL Seu sistema de trading. Seu EA de automação. Seu treinamento e suporte. Compre o Smart Trend Trading System para MT5 por US$ 99 e receba o Smart Universal Expert Advisor GRÁTIS para automatizar os sinais do sistema. O STTS reúne a direção da tendência, sinais de entrada e saída, zonas de reversão e níveis de preço importantes diretamente no seu gráfico. Siga o sistema manualmente ou conecte o EA incluído para executar operações automaticamente com as
Trend Sniper X
Sarvarbek Abduvoxobov
4.9 (39)
Trend Sniper X é um indicador de acompanhamento de tendência para múltiplos tempos gráficos no MetaTrader 5 que ajuda os traders a identificar a direção da tendência e potenciais pontos de reversão com clareza e precisão. para MT4: https://www.mql5.com/en/market/product/193245 Informações sobre o preço: O preço atual é promocional e está sujeito a alterações à medida que novas atualizações e funcionalidades forem lançadas. Oferta Bônus: Para obter o Auto-Trade Assistant EA GRATUITO para este in
Neuro Poseidon MT5
Daria Rezueva
4.75 (52)
Neuro Poseidon is a new indicator by Daria Rezueva. It combines precise trading signals with adaptive TP/SL levels - creating best possible trades as a result! Message me and get  Neuro Poseidon Assistant  as a gift to automize your trading process! What makes it stand out? 1. Proven profitability on all assets and timeframes 2. Only confirmed BUY and SELL signals present on the chart 3. Adaptive TP & SL levels generated by the software for each trade 4. Easy to understand - suitable for al
Zoryk Gold
Reda El Koutbane
5 (12)
O desconto termina em 24 horas — próximo preço $ 69 ZORYK — Sistema avançado de sinais para XAUUSD no MetaTrader 5 Você conhece essa sensação. Você passa muito tempo analisando o ouro. Espera pela entrada certa. Finalmente abre a operação e o preço começa imediatamente a se mover contra você. Você fecha cedo demais, move o Stop Loss ou hesita por alguns segundos. Depois disso, o mercado alcança exatamente o destino que você esperava originalmente, mas sem você dentro da operação. O problema ne
SuperScalp Pro
Van Minh Nguyen
4.65 (34)
SuperScalp Pro - Professional Multi-Layer Confluence Scalping System SuperScalp Pro é um indicador avançado de scalping que aprimora o Supertrend clássico com vários filtros inteligentes de confirmação. Ele ajuda a identificar oportunidades de Buy/Sell com maior probabilidade, reduzindo significativamente os sinais falsos. Setas claras de Buy e Sell aparecem diretamente no gráfico, enquanto os níveis de Stop Loss e Take Profit baseados em ATR são calculados automaticamente em tempo real. Após a
M1 Sniper MT5
Oleg Rodin
5 (7)
O   M1 SNIPER   é um sistema indicador de negociação fácil de usar. É um indicador de seta projetado para o período M1. O indicador pode ser usado como um sistema independente para scalping no período M1 e pode ser usado como parte do seu sistema de negociação existente. Embora este sistema de negociação tenha sido projetado especificamente para negociação no M1, ele também pode ser usado em outros períodos. Originalmente, desenvolvi este método para negociar XAUUSD e BTCUSD. Mas considero-o úti
Gann Made Easy   é um sistema de negociação Forex profissional e fácil de usar, baseado nos melhores princípios de negociação usando a teoria do sr. W. D. Gann. O indicador fornece sinais precisos de COMPRA e VENDA, incluindo níveis de Stop Loss e Take Profit. Você pode negociar mesmo em movimento usando notificações PUSH. Entre em contato comigo após a compra para receber instruções de negociação e ótimos indicadores extras gratuitamente! Provavelmente você já ouviu muitas vezes sobre os método
Vamos ser honestos primeiro. Nenhum indicador sozinho vai te tornar lucrativo. Se alguém te disser o contrário, está te vendendo um sonho. Qualquer indicador que mostre setas perfeitas de compra/venda pode ser feito para parecer impecável — basta dar zoom na parte certa da história e tirar um print das operações vencedoras. Nós não fazemos isso.  SMC Intraday Formula é uma ferramenta. Ela lê a estrutura do mercado para você, identifica as zonas de maior probabilidade de preço e mostra exatament
Unix Scalper
Issam Kassas
4 (4)
UNIX SCALPER — OFERTA ESPECIAL Identifique a oportunidade. Veja o plano. Escolha como operar. Adquira o UNIX Scalper para MT5 por US$ 99 e receba o Smart Universal Expert Advisor GRÁTIS para automatizar seus sinais. O UNIX Scalper reúne análise de mercado, decisões BUY/SELL/WAIT e níveis de Entry, Stop Loss, TP1 e TP2 em um painel organizado. Siga o plano de operação manualmente ou conecte o EA incluído para executar operações automaticamente com as configurações que você escolher. O preço atual
A lenda está de volta: Entry Points Pro 10. O relançamento do lendário indicador que se manteve por 3 anos no Top-3 do MQL5 Market. Centenas de avaliações entusiasmadas (589 nas duas versões), milhares de traders operam com ele todos os dias, 31.000+ downloads da versão demo   MT4+MT5 . Li cada avaliação de vocês ao longo de cinco anos — e, em vez de promessas, coloquei as respostas dentro da versão 10. Do autor que está no mercado desde 1999 e valoriza a honestidade, a própria reputação e os se
GoldenX Entry MT5
Kareem Abbas
5 (16)
GoldenX Entry é um indicador para MT5 com um algoritmo adaptativo Smart Entry Trend, um sistema de pontuação de sinais, um detector de regime de mercado e um filtro de volatilidade. Cada sinal inclui um nível de entrada calculado, três níveis de Take-Profit (TP1, TP2, TP3) e um nível de Stop-Loss. Ele é construído sobre múltiplas camadas analíticas projetadas para se adaptar a diferentes condições de mercado, combinando um sistema analítico multicamadas com um otimizador integrado e um sistema d
Reversion King Indicator
Eugen-alexandru Zibileanu
5 (9)
Um novo Rei chegou à cidade - Indicador + Gestão de Ordens (TP1 + TP2 + TP3) + Enviador opcional de sinais para Telegram INCLUÍDO (GRÁTIS) (SISTEMA COMPLETO DE TRADING e SINAIS) Nosso melhor EA para Ouro: Gold Slayer Este indicador inclui uma estratégia avançada, um sistema de trading com gestão de ordens personalizável e um sistema de reversão à média que combina extensões de envelopes, apoiado por múltiplos filtros inteligentes de confirmação, como o RSI, para capturar entradas de reversão de
Gold Entry Sniper
Tahir Mehmood
5 (20)
Gold Entry Sniper – Painel ATR Multi-Tempo Profissional para Scalping e Swing Trading em Ouro Gold Entry Sniper é um indicador avançado para MetaTrader 5 projetado para fornecer sinais de compra/venda precisos para XAUUSD e outros ativos, com base na lógica de Trailing Stop ATR e análise multi-tempo . Ideal tanto para scalpers quanto para swing traders. Principais Recursos e Vantagens Análise Multi-Tempo – Veja a tendência de M1, M5 e M15 em um único painel. Trailing Stop Baseado em ATR – Níveis
Market Structure Order Block Dashboard MT5 é um indicador MT5 projetado para traders que querem ler a estrutura de mercado e as principais zonas de reação do preço diretamente no gráfico. Combina BOS, ChoCH, Order Blocks, Fair Value Gaps (FVG), Liquidez, Kill Zones, Volume Profile e um painel compacto para análise rápida. Este indicador é voltado para traders que usam estrutura de mercado, conceitos ICT e Smart Money como quadro de decisão. Pode ajudar a identificar continuações de tendência, po
Welcome to ENTRY IN THE ZONE AND SMC MULTI TIMEFRAME Entry In The Zone and SMC Multi Timeframe is a real-time market analysis tool based on Smart Money Concepts (SMC), designed to analyze market structure, price direction, and key trading zones. It supports both Single-Timeframe Analysis and Multi-Timeframe Analysis, providing a clearer view of the overall market structure across multiple timeframes, with real-time BUY / SELL signals that do not repaint. It is designed to help filter trading opp
Atomic Analyst MT5
Issam Kassas
4.46 (59)
ATOMIC ANALYST — OFERTA ESPECIAL Sua análise de mercado. Seu EA de automação. Seu treinamento e suporte. Compre o Atomic Analyst para MT5 por US$ 99 e receba o Smart Universal Expert Advisor GRÁTIS para automatizar os sinais do indicador. O Atomic Analyst reúne a ação do preço, a direção da tendência, sinais de entrada e saída, Stop Loss e vários níveis de Take Profit diretamente no seu gráfico. Opere manualmente usando a análise ou conecte o EA incluído para executar operações automaticamente
Adaptive Price Action Engine Compre um indicador, ganhe o EA de graça Análise Auto-Otimizada de Tendências e Padrões de Candlestick em Múltiplos Timeframes Os mercados estão em constante mudança, e nem todos os padrões de Price Action têm o mesmo valor em todas as condições de mercado. O Adaptive Price Action Engine foi desenvolvido para se adaptar às mudanças nas condições do mercado, combinando estrutura de tendência, análise Multi-Timeframe, padrões de candlestick e otimização estatística em
Tokyo mt5 Indicator
Vasiliy Strukov
5 (1)
O Tokyo Indicator oferece uma visão geral visual clara da direção da tendência, de possíveis sinais de negociação e das condições de mercado. Sua linha de tendência em degraus e codificada por cores distingue as fases de alta (azul) das fases de baixa (magenta). Setas direcionais correspondentes destacam possíveis oportunidades de compra e venda quando a tendência exibida muda. Um painel integrado reúne o sinal atual, o viés de mercado, o momentum, a volatilidade e a qualidade do sinal em uma v
Currency Strength Wizard   é um indicador muito poderoso que fornece uma solução completa para uma negociação bem-sucedida. O indicador calcula o poder deste ou daquele par forex usando os dados de todas as moedas em vários intervalos de tempo. Esses dados são representados em uma forma de índice de moeda fácil de usar e linhas de energia de moeda que você pode usar para ver o poder desta ou daquela moeda. Tudo o que você precisa é anexar o indicador ao gráfico que deseja negociar e o indicador
FiboSniper Pro
Van Minh Nguyen
5 (3)
FiboSniper Pro – Multi-Filter Fibonacci System with Auto SL/TP and Control Panel FiboSniper Pro é um indicador técnico que combina Fibonacci Envelopes dinâmicos com vários filtros de confirmação para gerar sinais seletivos de Buy e Sell. Os níveis de Fibonacci são calculados com base em Moving Average e ATR e, em seguida, filtrados por ADX, EMA, RSI, ATR, Volume, Time e estrutura das velas. O indicador exibe diretamente no gráfico os níveis automáticos de Stop Loss e Take Profit baseados em ATR,
Divergence Bomber
Ihor Otkydach
4.89 (94)
Cada comprador deste indicador recebe adicionalmente, e de forma gratuita: A ferramenta exclusiva "Bomber Utility", que acompanha automaticamente cada operação, define os níveis de Stop Loss e Take Profit e fecha operações de acordo com as regras da estratégia; Arquivos de configuração (set files) para ajustar o indicador em diferentes ativos; Set files para configurar o Bomber Utility nos modos: "Risco Mínimo", "Risco Balanceado" e "Estratégia de Espera"; Um vídeo tutorial passo a passo que a
SMART PRICE ACTION CONCEPTS — OFERTA ESPECIAL Veja a estrutura. Identifique as zonas. Monte seu plano de trading. Adquira o Smart Price Action Concepts para MT5 por US$ 49 e receba o Smart Universal Expert Advisor GRÁTIS. Reúna Smart Money Concepts (SMC), análise no estilo ICT e ação do preço em um gráfico organizado. Identifique a estrutura do mercado, os blocos de ordens, os níveis de referência de liquidez e os desequilíbrios. Depois, escolha quais elementos exibir pelo Smart Panel. O preço a
Superhero
Ihor Otkydach
5 (3)
O indicador SUPERHERO é um sistema de negociação multimoeda concebido numa base «tudo incluído». O indicador analisa o mercado de forma independente e fornece sinais sobre quando abrir e encerrar posições. Utiliza ordens Stop Loss e Take Profit. O rácio R:R é de 1:1. Este sistema pode enviar notificações push para o seu smartphone, para que possa realizar transações «em qualquer lugar», sem precisar de estar preso a um computador. É perfeito para empresas de negociação por conta própria. UM BÓNU
Volatility Master for MetaTrader is a real-time dashboard tool that scans up to  50 symbols  to identify high-volatility , trending markets instantly. With bullish/bearish signals, customizable alerts, and a user-friendly interface, it helps you avoid range-bound conditions and focus on high-probability trades. Clarity leads to confidence. Trade confidently and protect your capital effectively with this powerful dashboard. We don't offer free or bonus indicators in exchange of reviews from you.
PZ Trend Trading MT5
PZ TRADING SLU
3.8 (5)
O Trend Trading é um indicador projetado para lucrar o máximo possível com as tendências que ocorrem no mercado, cronometrando retrocessos e rupturas. Ele encontra oportunidades de negociação analisando o que o preço está fazendo durante as tendências estabelecidas. [ Guia de instalação | Guia de atualização | Solução de problemas | FAQ | Todos os produtos ] Negocie mercados financeiros com confiança e eficiência Lucre com as tendências estabelecidas sem ser chicoteado Reconhecer retrocessos
Power Candles MT5
Daniel Stein
4.58 (12)
Power Candles V3 - Indicador de força com auto-otimização O Power Candles V3 transforma a força da moeda e do instrumento num plano de negociação prático em todos os gráficos aos quais está associado. Em vez de se limitar a colorir as velas, executa uma otimização automática em tempo real em segundo plano e apresenta-lhe os melhores valores de Stop Loss, Take Profit e limiar de sinal para o símbolo em questão. Basta um clique para o adotar na negociação em tempo real — as linhas de entrada, Stop
IQ FX Gann Levels a precision trading indicator based on W.D. Gann’s square root methods . It plots real-time, non-repainting support and resistance levels to help traders confidently spot intraday and scalping opportunities with high accuracy. William Delbert Gann (W.D. Gann) was an exceptional market analyst, whose trading technique was based on a complex blend of mathematics, geometry, astrology, and ancient mathematics which proved to be extremely accurate. We don't offer free or bonus indic
Trend Catcher ind mt5
Ramil Minniakhmetov
5 (18)
INDICADOR TREND CATCHER O Indicador Trend Catcher analisa os movimentos de preços do mercado, utilizando uma combinação de indicadores de análise de tendências adaptativos, proprietários e personalizados pelo autor. Identifica a verdadeira direção do mercado, filtrando o ruído de curto prazo e focando a força do momentum subjacente, a expansão da volatilidade e o comportamento da estrutura de preços. Utiliza também uma combinação de indicadores personalizados de suavização e filtragem de tendê
RelicusRoad Pro MT5
Relicus LLC
4.96 (24)
RelicusRoad Pro: Sistema Operacional Quantitativo de Mercado 70% DE DESCONTO ACESSO VITALÍCIO (TEMPO LIMITADO) - JUNTE-SE A 2.000+ TRADERS Por que a maioria dos traders falha mesmo com indicadores "perfeitos"? Porque eles operam Conceitos Únicos no vácuo. Um sinal sem contexto é uma aposta. Você precisa de CONFLUÊNCIA . RelicusRoad Pro não é um simples indicador de seta. É um Ecossistema Quantitativo de Mercado completo. Ele mapeia a "Estrada do Valor Justo", distinguindo ruído de rupturas estru
Axiom Matrix
Issam Kassas
5 (8)
Axiom Matrix — OFERTA ESPECIAL Compre Axiom Matrix por US$49 e receba Smart Universal Expert Advisor GRÁTIS. Explore o mercado. Compare oportunidades. Escolha o próximo gráfico. Axiom Matrix reúne análise de múltiplos ativos e períodos em um painel. Encontre onde focar sem examinar cada gráfico separadamente. Examine a Observação do Mercado ou os símbolos escolhidos em vários períodos. Compare tendência, momentum, volume, volatilidade e qualidade do mercado. Explore oportunidades com Best Axiom
Mais do autor
QuantMatrix Probability AI Free QuantMatrix Probability AI Free is a technical indicator for MetaTrader 5 that combines several measurements of current market conditions into three numerical estimates. The indicator uses exponential moving averages, Relative Strength Index (RSI), Average True Range (ATR) and the current price position in its calculation. These measurements are combined into a normalized market score. The resulting information is displayed on the chart as: BUY percentage SELL p
FREE
QuantMatrix Candle Patterns is a free MetaTrader 5 indicator designed to identify classic candlestick formations directly on the chart. The indicator analyzes completed candles and detects recognized bullish, bearish and neutral price-action patterns. When a valid bullish or bearish formation is confirmed, the corresponding BUY or SELL signal is displayed on the following candle . This means the signal is only generated after the source pattern has been completed. The indicator also displays a c
FREE
QuantMatrix Wick Pressure QuantMatrix Wick Pressure is a technical indicator for MetaTrader 5 that measures the relationship between upper and lower candlestick wicks and converts this information into a numerical pressure measurement. Candlestick wicks represent price movement that occurred beyond the candle body before price returned from those levels. The indicator measures this rejection behavior over consecutive candles and displays the result in a separate indicator window. Positive values
FREE
QuantMatrix Volatility Regime QuantMatrix Volatility Regime is a technical indicator for MetaTrader 5 that evaluates the current volatility of the selected symbol and timeframe. The indicator uses Average True Range (ATR) to compare current volatility with a historical baseline calculated from previous bars. Based on this comparison, the current market condition is classified into one of four volatility regimes: LOW – current volatility is below the historical baseline. NORMAL – current volatil
FREE
QuantMatrix Probability AI PRO QuantMatrix Probability AI PRO is a technical indicator for MetaTrader 5 designed to evaluate current market conditions and present them as BUY, SELL and NEUTRAL percentage estimates. The indicator combines several market measurements, including trend, momentum, volatility, price position, candlestick wick behavior and breakout conditions. It also compares the current market state with similar historical situations found in the selected symbol and timeframe. The hi
QM Candle Timing Meter is a free MetaTrader 5 indicator designed to answer one simple question: How late am I in the current candle? A trading signal may still be technically valid while the timing of the entry has already changed significantly. For example, entering during the first minutes of an H1 candle is very different from entering when 90% of that candle has already elapsed. QM Candle Timing Meter continuously measures the temporal position of the current candle and displays this informa
FREE
QuantMatrix FXGold V8
Rafael Barreto Haddad
QuantMatrix FX+Gold V8.4 Trading Quantitativo Adaptativo para Forex e Ouro QuantMatrix FX+Gold V8.4 é um Expert Advisor multiativo avançado desenvolvido para Forex e Ouro (XAUUSD) . Em vez de depender de uma única estratégia fixa ou de uma combinação convencional de indicadores, o QuantMatrix utiliza uma arquitetura orientada à pesquisa para descobrir, validar, classificar e monitorar continuamente múltiplos modelos derivados do comportamento histórico de cada mercado. O princípio central é simp
QuantMatrix Candle Exhaustion QuantMatrix Candle Exhaustion is a technical indicator for MetaTrader 5 that identifies candles showing predefined price expansion and wick characteristics. The indicator compares the range of the current candle with the average range of previous candles. When the candle range exceeds the configured historical range threshold, its upper and lower wicks are evaluated. A bullish exhaustion marker can be displayed when an expanded bullish candle also contains the requi
QuantMatrix False Breakout Detector QuantMatrix False Breakout Detector is a technical indicator for MetaTrader 5 that identifies potential failed breakouts of recent price ranges. The indicator calculates the highest high and lowest low within a configurable historical period. It then evaluates whether the current price moves beyond one of these levels by a minimum volatility-adjusted distance and subsequently closes back inside the previous range. Average True Range (ATR) is used to adjust the
QuantMatrix Historical Move Probability QuantMatrix Historical Move Probability is a statistical indicator for MetaTrader 5 that compares the current price movement with similar movements found in the historical data of the selected symbol and timeframe. Price movements are normalized using Average True Range (ATR). This allows movements from different historical periods to be compared relative to the volatility present at each period. The indicator searches the configured historical sample for
QuantMatrix Prism Structure is a MetaTrader 5 indicator for visual analysis of market structure. It identifies confirmed swing highs and swing lows and displays structural information directly on the chart. The indicator can display higher highs, higher lows, lower highs, lower lows, structure changes, fair value gap areas and ATR based information. A chart panel summarizes the current structure state, recent structural events and relevant market information. The indicator is intended for m
QuantMatrix Volume Depth is a MetaTrader 5 indicator for visual analysis of market activity across different price levels. The indicator builds a horizontal profile across the analyzed price range and shows where trading activity has been concentrated. It displays the Point of Control, Value Area High, Value Area Low and the distribution of activity across multiple price levels. The indicator can use real volume when it is available from the symbol. When real volume is not available, tick vol
Filtro:
str8derx
79
str8derx 2026.09.03 15:03 
 

O usuário não deixou nenhum comentário para sua avaliação

Responder ao comentário