QM FlowVision X1

  • Indicatori
  • Rafael Barreto Haddad
    Rafael Barreto Haddad
    • Rafael Haddad → QuantMatrix → quantitative trading research al  Quantitative Trading Systems Researcher
    • Brasile
    • 1884
    Ricercatore di sistemi quantitativi di trading | Creatore di QuantMatrix Research Series | MetaTrader 5
    Creatore della serie di ricerca QuantMatrix per MetaTrader 5.
  • Versione: 1.10
QM FlowVision X1

Visual Multi-Factor Trading Indicator with Historical Probability, Market Flow, Momentum, Divergence and Multi-Timeframe Context

QM FlowVision X1 is a visual decision-support indicator for MetaTrader 5 designed to transform multiple market conditions into a simple and readable trading state.

Instead of displaying isolated oscillators without interpretation, FlowVision combines momentum, money flow, RSI, Stochastic RSI, divergence and higher-timeframe context into a unified 0–100 directional score.

The indicator then classifies the current market condition as:

  • STRONG BUY

  • BUY

  • WAIT / NO TRADE

  • SELL

  • STRONG SELL

In addition to the directional score, FlowVision includes a Historical Probability Engine that analyzes how similar signals behaved in the past.

This allows the trader to distinguish between two completely different concepts:

Score = how strongly the current indicators agree.

Probability = how similar historical signals actually performed.

Main Features

1. Visual Wave Momentum Engine

FlowVision displays two momentum waves designed to identify changes in market direction and momentum.

The relationship between Wave 1 and Wave 2 is used as one of the main components of the directional score.

Bullish and bearish crossings can also participate in signal generation, particularly when they occur in relevant momentum zones.

2. Money Flow

A visual Money Flow histogram helps identify current buying or selling pressure.

  • Green = positive flow

  • Red = negative flow

Money Flow is included directly in the FlowVision scoring model.

This helps distinguish a momentum signal supported by market pressure from one occurring against the current flow.

3. RSI

FlowVision includes an RSI component as part of its multi-factor analysis.

RSI is not used as a standalone BUY or SELL system.

Instead, it contributes to the total directional score and helps identify whether momentum is strengthening, weakening or remaining neutral.

4. Stochastic RSI

Stochastic RSI is used as an additional momentum confirmation layer.

The relationship between its K and D components contributes to the FlowVision score.

This provides a faster momentum component alongside the slower Wave and RSI structures.

5. Divergence Detection

FlowVision automatically detects regular bullish and bearish divergences between price and the internal Wave structure.

Bullish divergence:

Price forms a lower low while the oscillator forms a higher low.

Bearish divergence:

Price forms a higher high while the oscillator forms a lower high.

Divergences are confirmed only after the required pivot structure exists.

They are therefore treated as confirmed events rather than being projected into the past before confirmation.

6. Multi-Timeframe Context

FlowVision includes two higher-timeframe context filters.

With Auto HTF enabled, the higher timeframes automatically adapt when the chart timeframe changes.

Default automatic structure:

M1–M5

  • Context 1: M15

  • Context 2: H1

M6–M30

  • Context 1: H1

  • Context 2: H4

H1–H3

  • Context 1: H4

  • Context 2: D1

H4–H12

  • Context 1: D1

  • Context 2: W1

D1

  • Context 1: W1

  • Context 2: MN1

The user can disable Auto HTF and manually select both higher timeframes.

Higher-timeframe context is determined using fast and slow EMA relationships.

7. FlowVision Score — 0 to 100

The indicator combines six analysis groups into one directional score:

  • Wave momentum

  • Money Flow

  • RSI

  • Stochastic RSI

  • Divergence

  • Higher-timeframe context

The final value ranges from 0 to 100.

Default interpretation:

75–100
STRONG BUY

60–74
BUY

41–59
WAIT / NO TRADE

26–40
SELL

0–25
STRONG SELL

These thresholds can be changed in the indicator inputs.

The score represents market confluence, not historical win probability.

8. Historical Probability Engine

One of the main features of QM FlowVision X1 is its internal Historical Probability Engine.

When the current state reaches BUY or SELL territory, FlowVision searches the historical data of the current symbol and timeframe for previous signals in the same direction with a similar FlowVision score.

By default, signals are considered similar when their scores are within ±10 points of the current score.

The indicator then evaluates what happened after each historical signal.

Default benchmark:

Target: +1.20 ATR

Stop reference: -1.00 ATR

Maximum evaluation horizon: 20 candles

For a BUY signal, the historical event is considered successful when price reaches +1.20 ATR before falling -1.00 ATR.

For a SELL signal, the logic is reversed.

If both target and stop are reached inside the same candle, FlowVision applies the conservative assumption and records the event as a loss.

9. Probability Is Different from Score

This distinction is important.

An example:

BUY
Score: 82/100
Historical Probability: 64%

This means the current technical conditions have strong bullish confluence, while approximately 64% of the resolved similar historical BUY signals reached the configured target before the configured stop.

Another example:

STRONG BUY
Score: 87/100
Historical Probability: 46%

The technical picture may currently be strongly bullish, but historically similar signals did not produce a strong success rate.

FlowVision allows the trader to see both pieces of information instead of assuming that a high indicator score automatically represents a high statistical probability.

10. Sample Size

Historical probability is displayed together with the number of historical observations.

The panel uses the following sample-quality classification:

INSUFFICIENT
Less than the configured minimum sample size. Default: 30 resolved samples.

LOW
30–99 resolved samples.

MODERATE
100–299 resolved samples.

HIGH
300 or more resolved samples.

This is important because a probability calculated from a very small sample should not be interpreted in the same way as a probability calculated from hundreds of historical occurrences.

FlowVision also displays:

N = resolved historical samples

U = unresolved historical samples

11. Probability Smoothing

Historical probability uses Laplace smoothing.

This reduces extreme probability readings caused by small samples.

For example, a very small group of winning observations will not immediately be displayed as an unrealistic 100% probability.

12. Historical Expectancy

FlowVision also calculates historical expectancy in R.

Example:

EXP +0.32R

indicates that the historical group of similar signals produced an average positive outcome equivalent to approximately +0.32 units of the configured risk reference.

A negative expectancy indicates that similar historical signals produced a negative average result under the current probability benchmark.

Probability and expectancy should be analyzed together.

A high win rate does not automatically mean positive expectancy.

13. Visual Trading Panel

The FlowVision panel provides an immediate overview of the market.

It displays:

  • Current market state

  • FlowVision Score

  • BUY or SELL Historical Probability

  • Historical sample size

  • Unresolved samples

  • Historical expectancy

  • Wave direction

  • Money Flow

  • RSI

  • Stochastic RSI

  • Divergence status

  • Higher-timeframe context

  • Probability benchmark

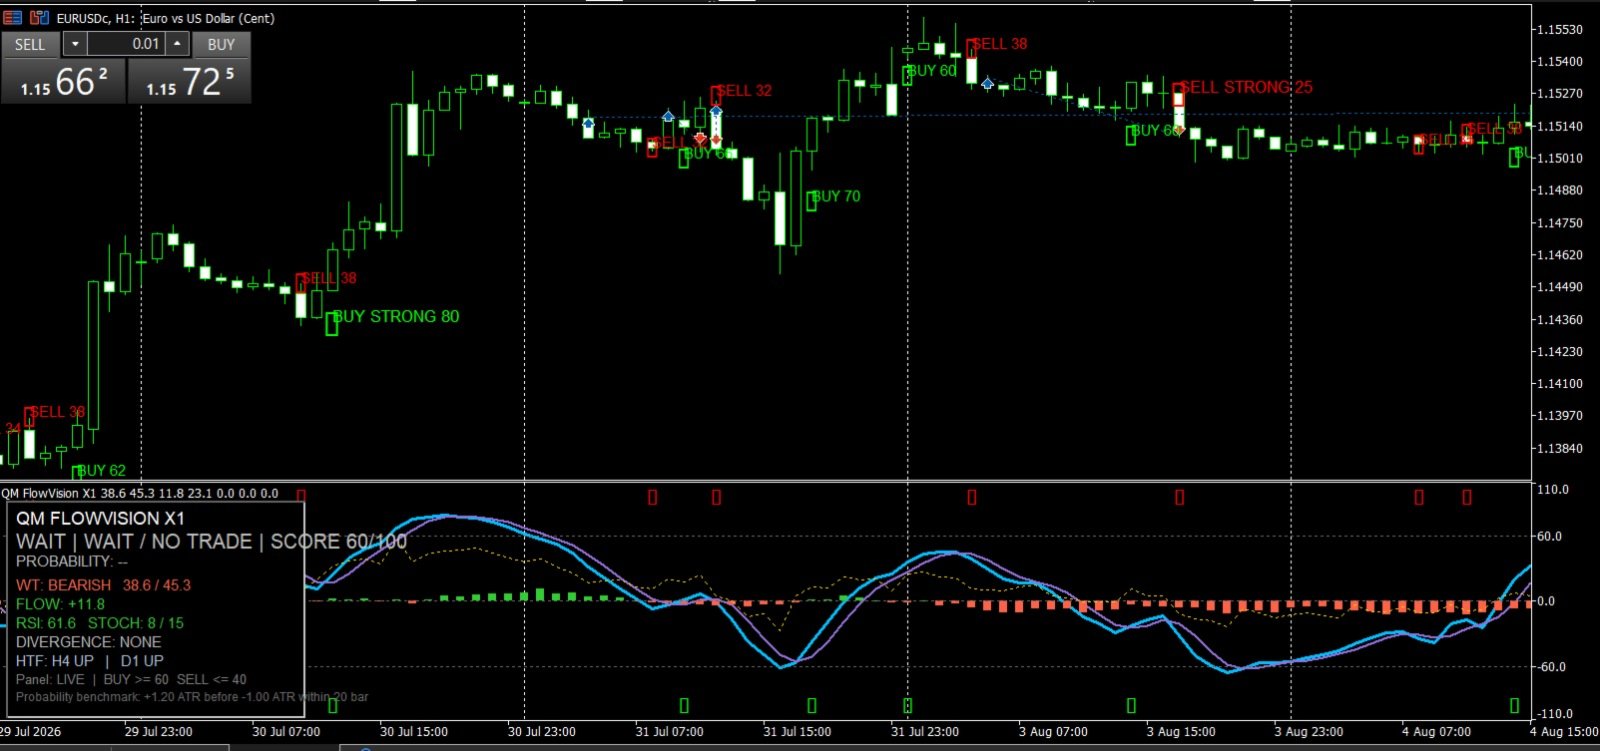
Example:

QM FLOWVISION X1

BUY | STRONG BUY | SCORE 81/100

BUY PROB: 66.4% | N=214 | EXP +0.31R | MODERATE

WT: BULLISH

FLOW: +18.2

RSI: 61.4

STOCH: 72 / 64

DIVERGENCE: BULLISH

HTF: H1 UP | H4 UP

14. BUY and SELL Signals

FlowVision does not generate a new signal simply because the score remains inside BUY or SELL territory.

The internal trigger engine evaluates events such as:

  • Entry of the score into a BUY or SELL state

  • Wave momentum crossing in a relevant zone

  • Confirmed bullish or bearish divergence

A valid BUY requires the FlowVision score to be inside BUY territory.

A valid SELL requires the FlowVision score to be inside SELL territory.

This reduces repetitive signals while the same market condition remains active.

15. Historical Chart Signals

Confirmed BUY and SELL events can be displayed directly on the main price chart.

BUY signals appear below price.

SELL signals appear above price.

Signal labels can also display the corresponding FlowVision score.

Strong signals receive additional visual emphasis.

16. Closed-Bar Signal Confirmation

Historical signal arrows and alerts are generated from confirmed closed candles.

This is designed to prevent an unfinished candle from being presented as a completed trading signal.

The live panel is different:

The panel continuously represents the current candle and can therefore change while that candle is forming.

Traders should understand the distinction between:

  • Live market analysis

  • Confirmed closed-bar signals

17. Alerts

FlowVision supports MetaTrader alerts when a confirmed BUY or SELL signal is generated.

Optional Push Notifications are also available.

Signal alerts can include:

  • Symbol

  • Direction

  • Signal strength

  • Score

  • Historical probability

  • Number of samples

  • Historical expectancy

  • Current timeframe

How to Read FlowVision

A simple way to use the indicator is to analyze four layers.

Layer 1 — Direction

Start with the current FlowVision state.

STRONG BUY / BUY
Bullish environment.

WAIT / NO TRADE
Insufficient directional agreement.

SELL / STRONG SELL
Bearish environment.

Layer 2 — Historical Probability

Check whether similar signals performed well historically.

Example:

BUY Score 72
Probability 64%
N=185

This carries more historical information than:

BUY Score 72
Probability 75%
N=8

Sample size matters.

Layer 3 — Expectancy

Check whether historical expectancy is positive.

A positive probability combined with positive expectancy represents stronger historical evidence than win rate alone.

Layer 4 — Context

Observe:

  • Wave direction

  • Money Flow

  • RSI

  • Stochastic RSI

  • Divergence

  • Higher-timeframe direction

The panel allows traders to understand why the score is bullish, neutral or bearish.

Example Bullish Reading

STRONG BUY

Score: 82/100

Historical Probability: 67%

Samples: 236

Expectancy: +0.34R

Wave: Bullish

Money Flow: Positive

RSI: Bullish

Stochastic: Bullish

H1 Context: UP

H4 Context: UP

This represents strong technical confluence combined with positive historical statistics.

Example No-Trade Reading

WAIT / NO TRADE

Score: 53/100

Wave: Bullish

Money Flow: Negative

RSI: Neutral

Stochastic: Bearish

HTF Context: Mixed

FlowVision identifies conflicting information and does not classify the market as a directional BUY or SELL condition.

Example of Technical Strength with Weak Historical Evidence

STRONG BUY

Score: 81/100

Probability: 48%

Samples: 301

Expectancy: -0.07R

The current technical structure is strongly bullish, but historically similar BUY signals did not demonstrate a positive statistical advantage under the selected ATR benchmark.

This is exactly why FlowVision keeps Score and Probability separate.

Main Inputs

Core / Wave

WT Channel Length
Controls the main Wave smoothing period.

Default: 9

WT Average Length
Controls the WaveTrend average.

Default: 12

WT Signal Length
Controls the secondary Wave signal smoothing.

Default: 3

WT Overbought
Default: 53

WT Oversold
Default: -53

Flow / RSI / Stochastic

Flow Period
Default: 34

RSI Period
Default: 14

Stochastic Period
Default: 14

Stochastic K Smooth
Default: 3

Stochastic D Smooth
Default: 3

Higher-Timeframe Context

Auto HTF
Automatically selects higher-timeframe context according to the chart timeframe.

Default: true

HTF1 / HTF2
Manual higher timeframes used when Auto HTF is disabled.

Fast EMA
Default: 20

Slow EMA
Default: 50

Signal Thresholds

Strong Buy Score
Default: 75

Buy Score
Default: 60

Sell Score
Default: 40

Strong Sell Score
Default: 25

WT Trigger Zone
Default: 25

Historical Probability Settings

Probability Lookback Bars
Default: 3000

Maximum historical search window used by the probability engine.

Forward Bars
Default: 20

Maximum number of candles evaluated after each historical signal.

ATR Period
Default: 14

Target ATR
Default: 1.20

Stop ATR
Default: 1.00

Score Tolerance
Default: 10

Controls how similar a historical signal's FlowVision score must be compared with the current score.

Minimum Display Sample
Default: 30

Used to classify very small statistical samples as insufficient.

Visual Settings

Users can enable or disable:

  • RSI display

  • Score line

  • Price-chart arrows

  • Signal text

  • Information panel

  • Historical signal display

The number of historical signal bars and maximum calculation bars can also be configured.

Alerts

Enable Alerts
Enables standard MetaTrader signal alerts.

Enable Push
Enables MetaTrader Push Notifications when configured in the terminal.

Timeframes

QM FlowVision X1 automatically recalculates when the chart timeframe changes.

The signal engine always analyzes the active chart timeframe.

Higher-timeframe context automatically adjusts when Auto HTF is enabled.

Because market behavior differs between symbols and timeframes, historical probability and expectancy should always be interpreted specifically for the currently selected symbol and timeframe.

Markets

FlowVision is designed as a multi-factor technical analysis tool and can be applied to different MetaTrader 5 symbols where sufficient historical price data is available.

Results and historical statistics can differ significantly between:

  • Forex pairs

  • Metals

  • Indices

  • Cryptocurrencies

  • Different brokers

  • Different timeframes

  • Different market conditions

Users should evaluate the indicator on the specific market and timeframe they intend to trade.

Important Information

QM FlowVision X1 is an indicator.

It does not open, manage or close trades.

It does not guarantee future market performance.

Historical probability represents the historical behavior of similar FlowVision signals under the configured ATR target, stop and evaluation horizon.

Historical statistics do not guarantee that the same behavior will occur in the future.

Probability should not be interpreted as certainty.

The live panel may change while the current candle is still forming.

Confirmed signal arrows and alerts are based on closed-bar conditions.

Trading involves financial risk. Always evaluate the method according to your own strategy, account size and risk tolerance.


Automated Trading
QM FlowVision X1 is designed for manual market analysis and does not execute trades.
Traders who prefer automated execution can use the separate QM FlowVision EA X1, an Expert Advisor from the same FlowVision product family.
The EA contains its own signal engine and does not require this indicator to be installed.
Related FlowVision products can be found among the author's products in the MQL5 Market.

Recommended First Use

For the first evaluation:

  1. Keep the default parameters.

  2. Enable Auto HTF.

  3. Open the desired symbol and timeframe.

  4. Observe the FlowVision Score.

  5. Compare Score with Historical Probability.

  6. Check the number of historical samples.

  7. Check Historical Expectancy.

  8. Observe Wave, Money Flow and higher-timeframe alignment.

  9. Use confirmed BUY and SELL signals together with your own risk-management process.

Do not interpret a single component in isolation.

The purpose of FlowVision is to combine technical information, historical behavior and market context into one visual decision-support environment.

QM FlowVision X1

See the signal. Understand the context. Measure the history.

Prodotti consigliati
High Low Open Close
Alexandre Borela
4.98 (45)
Se ti piace questo progetto, lascia una recensione a 5 stelle. Questo indicatore disegna i prezzi aperti, alti, bassi e di chiusura per i specificati periodo e può essere regolato per un determinato fuso orario. Questi sono livelli importanti guardati da molti istituzionali e professionali commercianti e può essere utile per voi per conoscere i luoghi dove potrebbero essere più attivo. I periodi disponibili sono: Giorno precedente. Settimana precedente. Mese precedente. Precedente trimestre. A
FREE
Pivot Point Fibo RSJ è un indicatore che traccia le linee di supporto e resistenza del giorno utilizzando i tassi di Fibonacci. Questo spettacolare indicatore crea fino a 7 livelli di supporto e resistenza tramite Pivot Point utilizzando i tassi di Fibonacci. È fantastico come i prezzi rispettino ogni livello di questo supporto e resistenza, dove è possibile percepire possibili punti di entrata/uscita di un'operazione. Caratteristiche Fino a 7 livelli di supporto e 7 livelli di resistenza Im
FREE
RBM Delta Gold
Renato Brendim Medici
5 (1)
Gold does not move only because of price. It moves because of aggression, imbalance, and market flow. The Delta Indicator was created to reveal exactly that. The RBM Trader Delta Indicator for XAUUSD identifies the difference between aggressive buyers and sellers, helping traders detect real market pressure before the movement becomes obvious on the chart. While most traders focus only on candles, Delta shows what is happening behind price action. This indicator was specially developed for
FREE
VolumeBasedColorsBars
Henrique Magalhaes Lopes
VolumeBasedColorsBars — Free Powerful Volume Analysis for All Traders Unlock the hidden story behind every price bar! VolumeBasedColorsBars is a professional-grade, 100% FREE indicator that colorizes your chart candles based on real, adaptive volume analysis. Instantly spot surges in market activity, identify exhaustion, and catch the moves that matter. This indicator gives you:    • Dynamic color-coded bars for instant volume context    • Adaptive thresholds based on historical, session-awar
FREE
MACD Colored ZeroLag
Farzin Sadeghi Bonjar
4.73 (11)
It is the MQL5 version of zero lag MACD that was available for MT4 here: https://www.mql5.com/en/code/9993 Also there was a colored version of it here but it had some problems: https://www.mql5.com/en/code/8703 I fixed the MT4 version which has 95 lines of code. It took me 5 days to write the MT5 version.(reading the logs and testing multiple times and finding out the difference of MT5 and MT4!) My first MQL5 version of this indicator had 400 lines of code but I optimized my own code again and n
FREE
Fibomathe
Almaquio Ferreira De Souza Junior
Fibomathe Indicator: Support and Resistance Tool for MT5 The Fibomathe Indicator is a technical analysis tool designed for MetaTrader 5 (MT5) that assists traders in identifying support and resistance levels, take-profit zones, and additional price projection areas. It is suitable for traders who use structured approaches to analyze price action and manage trades. Key Features Support and Resistance Levels: Allows users to define and adjust support and resistance levels directly on the chart.
FREE
Apex Point
Marco Engstermann
Apex Point is a trend-following indicator for MetaTrader 5, transforming complex market data into signals for traders. It displays blue dots for uptrends, red dots for downtrends, and yellow crosses at potential reversals, helping users identify momentum shifts quickly. Key features include a confirmation system requiring multiple bars (default: 3) to validate changes, reducing false signals; dynamic ATR-based offsets for adaptive trailing, with instant ratcheting in the trend direction and smo
FREE
Friend of the Trend: Your Trend Tracker Master the market with Friend of the Trend , the indicator that simplifies trend analysis and helps you identify the best moments to buy, sell, or wait. With an intuitive and visually striking design, Friend of the Trend analyzes price movements and delivers signals through a colorful histogram: Green Bars : Signal an uptrend, indicating buying opportunities. Red Bars : Alert to a downtrend, suggesting potential selling points. Orange Bars : Represent cons
FREE
Эксперт  MACD_LevelTrader MT5   создан для торговле валютной пары XAUUSD. Данная версия это наработки того, что можно извлечь  из  индикатора MACD и Moving Average.  Важно   перед тестированием изменить настройку с 1000 на 5000                       Offset in points UP from SMA200 for sell              5000                       Offset in points DOWN from SMA200 for buy        5000   Тайм фрейм  М5. Два варианта логики, П араметр  true=вход по уровню  MACD +   SMA200, false=вход по MACD  Тестиру
FREE
Pivot Points Indicator – a fast, reliable, and fully customizable pivot detection for MetaTrader 5. This indicator uses MetaTrader’s native iHighest and iLowest functions to identify pivot highs and lows by scanning for the highest and lowest prices within a user-defined window of bars. A pivot is confirmed only when the current bar is the absolute maximum or minimum within the selected range, ensuring accurate and timely signals based on robust built-in logic. Key Features No Repainting : Onc
FREE
Free automatic Fibonacci is an indicator that automatically plots a Fibonacci retracement based on the number of bars you select on the BarsToScan setting in the indicator. The Fibonacci is automatically updated in real time as new highest and lowest values appears amongst the selected bars. You can select which level values to be displayed in the indicator settings. You can also select the color of the levels thus enabling the trader to be able to attach the indicator several times with differe
FREE
Donchian Breakout And Rsi
Mattia Impicciatore
4.5 (2)
Descrizione generale Questo indicatore è una versione avanzata del classico Donchian Channel , arricchita con funzioni operative per il trading reale. Oltre alle tre linee tipiche (massimo, minimo e linea centrale), il sistema rileva i breakout e li segnala graficamente con frecce sul grafico, mostrando solo la linea opposta alla direzione del trend per semplificare la lettura. L’indicatore include: Segnali visivi : frecce colorate al breakout Notifiche automatiche : popup, push e email Filtro R
FREE
PROMETHEUS TECHNICAN VERSION Free | By THE SONS A gift from The Sons — no strings, no trial, no expiry. Every trader deserves access to professional-grade market intelligence. That belief is why Prometheus Technical Version exists, and why it costs nothing. Consider it our handshake to the trading community. What You're Getting This is not a simplified tool dressed up as a gift. Prometheus Technican Version is a fully built, institutional-quality technical analysis indicator running a dual-model
FREE
Volume profile CVD Frato
Francisco Felipe Alves Da Silva Rocha
5 (2)
Frato Volume Profile Pro v7.5 Sviluppato da Frato Academy Questo indicatore visualizza il profilo prezzo-volume per MetaTrader 5. Calcola la distribuzione del volume scambiato per livello di prezzo su un periodo configurabile e presenta i risultati direttamente sul grafico principale. Caratteristiche: Profilo di volume con gradiente di colore L'indicatore divide l'intervallo di prezzo in livelli e assegna un volume corrispondente a ciascun livello. Il colore di ogni livello varia con un grad
FREE
The   OHLC indicator   shows the current and historical values of High, Low, Open, Close and Mid for a specific time period. It can plot the current values or the values from the previous session. The indicator's range can be calculated from a daily, weekly, monthly, or user-specified session. Levels High  of the current or previous session. Low  of the current or previous session. Open  of current or previous session. Close  of the current or previous session. Midpoint  of the current or prev
FREE
Dynamic Pivot Zones
Vincent Jose Proenca
Dynamic Pivot Zones – Your Level Assistant on the Chart This indicator is a bit like a GPS for your trading . It shows you where the price likes to hang out, where it gets nervous, and where it flies through. No more calculating pivots by hand or guessing support and resistance levels. What it does: Automatically plots H1, H4, and D1 pivots . Shows support and resistance zones : R1, R2, S1, S2. Lines are colored and easy to read , so you can instantly see what’s hot or cold. Why you’ll love it:
FREE
MSX Hybrid Heiken Scalper
Som Prakash Gehlot
5 (1)
MSX Hybrid Heiken Scalper Overview MSX Hybrid Heiken Scalper is a MetaTrader 5 indicator based on a modified Heiken Ashi methodology with closed-bar smoothing. The indicator is designed to display trend direction through color-coded candles while reducing sensitivity to short-term market fluctuations. All calculations are performed using completed candles, allowing historical values to remain fixed after bar close. Features • Modified Heiken Ashi calculation • Closed-bar processing • Color-code
FREE
LT Donchian Channel
Thiago Duarte
4.86 (7)
Donchian Channel is an indicator created by Richard Donchian. It is formed by taking the highest high and the lowest low of the last specified period in candles. The area between high and low is the channel for the chosen period. Its configuration is simple. It is possible to have the average between the upper and lower lines, plus you have alerts when price hits one side. If you have any questions or find any bugs, please contact me. Enjoy!
FREE
Pin Bars MT5
Yury Emeliyanov
Main purpose:   "Pin Bars"   is designed to automatically detect pin bars on financial market charts. A pin bar is a candle with a characteristic body and a long tail, which can signal a trend reversal or correction. How it works:   The indicator analyzes each candle on the chart, determining the size of the body, tail and nose of the candle. When a pin bar corresponding to predefined parameters is detected, the indicator marks it on the chart with an up or down arrow, depending on the directi
FREE
Trade Behavior Mirror legge esclusivamente lo storico delle operazioni già chiuse del proprio conto e conta un solo schema: aprire una nuova posizione poco dopo una perdita realizzata, con un lotto superiore al proprio volume abituale. Lo strumento non prevede nulla e non dà alcun consiglio. Ogni numero nel pannello è qualcosa che è già accaduto su questo conto. Come vengono costruiti i numeri: legge fino a 31 giorni di operazioni chiuse su tutti i simboli e tutti i magic number - è una fotogra
FREE
RBM Smc
Renato Brendim Medici
RBM SMC Liquidity Hunter MT5 — Institutional Structure and Liquidity Indicator   The RBM SMC Liquidity Hunter is a professional tool developed to map Smart Money Concepts (SMC) dynamics directly on your charts. The indicator tracks market structure breaks, validates supply and demand zones using price displacement, and detects liquidity sweeps confirmed by volume, integrating all confluences into an executive on-chart dashboard.   Key Features  Market Structure Mapping (BOS / CHoCH): Automatic
FREE
Curver Arrows
Francis Dube
3.75 (4)
This indicator is a straight port of a well known MetaTrader 4 indicator that is freely available on the Internet. It does not redraw at all. It implements a type of breakout strategy. The arrows indicate market direction. Use the indicator on M15 charts and higher. The indicator draws two bands near price action and generates signals when the price closes below the lower band and also above the upper band. The indicator uses periodic highs and lows to calculate upper and lower threshold bands.
FREE
Calmer chart context, kept practical Northstar Flow Candles MT5 is a chart-window indicator that presents Heikin Ashi candles with a five-state trend context. It is designed for traders who want a quieter view of price while keeping the native chart available as an optional reference. Visual-only indicator: Northstar Flow Candles MT5 does not place trades and does not send popup, push, or email notifications. What appears on the chart Five candle states: strong bullish, bullish, balanced, bearis
FREE
Show Pips for MT5
Roman Podpora
4.5 (32)
Questo indicatore informativo sarà utile per coloro che vogliono essere sempre informati sulla situazione attuale del conto. VERSION MT 4 -   More useful indicators L'indicatore mostra dati come profitto in punti, percentuale e valuta, nonché lo spread per la coppia corrente e il tempo fino alla chiusura della barra nell'intervallo di tempo corrente. Esistono diverse opzioni per posizionare la linea delle informazioni sulla carta: A destra del prezzo (corre dietro al prezzo); Come commento (nell
FREE
MTF Lines PRO
Renato Fiche Junior
3 (2)
This indicator was developed to support multiple timeframe analysis. In the indicator settings, the user can set the color, width, and style of the horizontal lines for each timeframe. This way, when the horizontal lines are inserted into the chart, they will be plotted with the timeframe settings. MTF Lines also allows visibility control of another objets like rectangles, trend lines and texts. This is a product developed by Renato Fiche Junior and available to all MetaTrader 4 and 5 users!
FREE
MACD Enhanced
Nikita Berdnikov
4 (4)
Introducing the MACD  Enhanced – an advanced MACD (Moving Average Convergence Divergence) indicator that provides traders with extended capabilities for trend and momentum analysis in financial markets. The indicator uses the difference between the fast and slow exponential moving averages to determine momentum, direction, and strength of the trend, creating clear visual signals for potential entry and exit points. Attention! To achieve the best results, it is recommended to adapt the indicator
FREE
PZ Penta O MT5
PZ TRADING SLU
3.8 (5)
The Penta-O is a 6-point retracement harmonacci pattern which usually precedes big market movements. Penta-O patterns can expand and repaint quite a bit. To make things easier this indicator implements a twist: it waits for a donchian breakout in the right direction before signaling the trade. The end result is an otherwise repainting indicator with a very reliable trading signal. The donchian breakout period is entered as an input. [ Installation Guide | Update Guide | Troubleshooting | FAQ | A
FREE
This indicator is an automated version of the Fibonacci retracement (Fib) indicator. Deciding the best areas to use when drawing the fib can be tricky and this  indicator was made with that in mind. When you drop it on the chart it will automatically choose the best points to draw the fib with, but in case you aren't satisfied with those regions, you can adjust it as you wish.
FREE
Are you tired of drawing trendlines every time you're analyzing charts? Or perhaps you would like more consistency in your technical analysis. Then this is for you. This indicator will draw trend lines automatically when dropped on a chart. How it works Works similar to standard deviation channel found on mt4 and mt5. It has 2 parameters: 1. Starting Bar 2. Number of bars for calculation The   starting bar   is the bar which drawing of the trend lines will begin, while the   number of bars for c
FREE
Exact Neuron Genuine Algo Genius Engaged
Toha Arekaatera Akutina Gage
3.8 (5)
!! THE FIRST FREE NEURAL NETWORK EA WITH EXCELLENT AND REALISTIC RESULTS.!! Another beautiful work of art, guys you don't know the powerful creations that are created by my developer Nardus Van Staden. Check him out guys and gals, he is the real deal, an amazing person and a professional when it comes to coding and business, if you want work done!, hit him up! you can get in contact with him HERE . THE FOLLOWING PRODUCT IS A FREE VERSION OF A PAID VERSION THAT IS TO COME, PROFITS ARE GOING TO B
FREE
Gli utenti di questo prodotto hanno anche acquistato
SMART TREND TRADING SYSTEM — OFFERTA SPECIALE Il tuo sistema di trading. Il tuo EA per l’automazione. La tua formazione e il tuo supporto. Acquista Smart Trend Trading System per MT5 a 99 USD e ricevi Smart Universal Expert Advisor GRATIS per automatizzare i segnali del sistema. STTS riunisce la direzione del trend, i segnali di entrata e uscita, le zone di inversione e i livelli di prezzo importanti direttamente sul grafico. Segui il sistema manualmente oppure collega l’EA incluso per eseguire
Trend Sniper X
Sarvarbek Abduvoxobov
4.9 (39)
Trend Sniper X è un indicatore trend-following multi-timeframe per MetaTrader 5 che aiuta i trader a identificare la direzione del trend e i potenziali punti di inversione con chiarezza e precisione. per MT4: https://www.mql5.com/en/market/product/193245 Informazioni sul prezzo: Il prezzo attuale è promozionale ed è soggetto a modifiche con il rilascio di futuri aggiornamenti e nuove funzionalità. Offerta Bonus: Per ricevere GRATIS l'Auto-Trade Assistant EA per questo indicatore, invia un messa
Neuro Poseidon MT5
Daria Rezueva
4.75 (52)
Neuro Poseidon is a new indicator by Daria Rezueva. It combines precise trading signals with adaptive TP/SL levels - creating best possible trades as a result! Message me and get  Neuro Poseidon Assistant  as a gift to automize your trading process! What makes it stand out? 1. Proven profitability on all assets and timeframes 2. Only confirmed BUY and SELL signals present on the chart 3. Adaptive TP & SL levels generated by the software for each trade 4. Easy to understand - suitable for al
Zoryk Gold
Reda El Koutbane
5 (12)
ZORYK — Sistema avanzato di segnali XAUUSD per MetaTrader 5 Conosci sicuramente questa sensazione. Passi molto tempo ad analizzare l’oro. Aspetti il punto d’ingresso corretto. Finalmente apri l’operazione e il prezzo inizia immediatamente a muoversi contro di te. Chiudi troppo presto, sposti lo Stop Loss o esiti per alcuni secondi. Successivamente il mercato raggiunge esattamente l’obiettivo che avevi previsto inizialmente, ma senza di te nella posizione. Il problema non era sempre la direzione.
SuperScalp Pro
Van Minh Nguyen
4.65 (34)
SuperScalp Pro - Professional Multi-Layer Confluence Scalping System SuperScalp Pro è un indicatore avanzato per lo scalping che migliora il Supertrend classico attraverso diversi filtri intelligenti di conferma. Aiuta a identificare opportunità di Buy/Sell con una probabilità maggiore, riducendo significativamente i falsi segnali. Le frecce Buy e Sell vengono visualizzate direttamente sul grafico, mentre i livelli di Stop Loss e Take Profit basati sull’ATR vengono calcolati automaticamente in t
M1 Sniper MT5
Oleg Rodin
5 (7)
M1 SNIPER   è un sistema di indicatori di trading facile da usare. Si tratta di un indicatore a freccia progettato per l'intervallo temporale M1. L'indicatore può essere utilizzato come sistema autonomo per lo scalping sull'intervallo temporale M1 e come parte del tuo sistema di trading esistente. Sebbene questo sistema di trading sia stato progettato specificamente per il trading sull'intervallo temporale M1, può comunque essere utilizzato anche con altri intervalli temporali. Inizialmente ho p
Gann Made Easy è un sistema di trading Forex professionale e facile da usare che si basa sui migliori principi del trading utilizzando la teoria di mr. WD Gann. L'indicatore fornisce segnali ACQUISTA e VENDI accurati, inclusi i livelli di Stop Loss e Take Profit. Puoi fare trading anche in movimento utilizzando le notifiche PUSH. CONTATTAMI DOPO L'ACQUISTO PER RICEVERE GRATUITAMENTE LE ISTRUZIONI DI TRADING E OTTIMI INDICATORI EXTRA! Probabilmente hai già sentito parlare molte volte dei metodi d
Cominciamo con la verità. Nessun indicatore da solo ti renderà profittevole. Se qualcuno ti dice il contrario, ti sta vendendo un sogno. Qualsiasi indicatore che mostra frecce perfette di acquisto/vendita può essere reso impeccabile — basta ingrandire la giusta sezione della storia e catturare solo i trade vincenti. Noi non lo facciamo.  SMC Intraday Formula è uno strumento. Legge la struttura del mercato per te, identifica le zone a più alta probabilità e ti mostra esattamente come appare la t
Unix Scalper
Issam Kassas
4 (4)
UNIX SCALPER — OFFERTA SPECIALE Individua il setup. Esamina il piano. Scegli come operare. Acquista UNIX Scalper per MT5 a 99 USD e ricevi Smart Universal Expert Advisor GRATIS per automatizzarne i segnali. UNIX Scalper riunisce analisi di mercato, indicazioni BUY/SELL/WAIT e livelli Entry, Stop Loss, TP1 e TP2 in un unico pannello organizzato. Segui il piano di trading manualmente oppure collega l’EA incluso per eseguire automaticamente le operazioni secondo le impostazioni scelte. Il prezzo at
La leggenda ritorna: Entry Points Pro 10. Il rilancio del leggendario indicatore che per 3 anni è rimasto nella Top-3 del MQL5 Market. Centinaia di recensioni entusiaste (589 su due versioni), migliaia di trader lo usano ogni giorno per operare, 31.000+ download della demo   MT4+MT5 . Ho letto ogni vostra recensione degli ultimi cinque anni — e invece di promesse ho inserito nella versione 10 le risposte. Dall'autore che opera sui mercati dal 1999 e tiene all'onestà, alla propria reputazione e a
GoldenX Entry MT5
Kareem Abbas
5 (16)
GoldenX Entry è un indicatore per MT5 con un algoritmo adattivo Smart Entry Trend, un sistema di scoring dei segnali, un rilevatore del regime di mercato e un filtro di volatilità. Ogni segnale include un livello di ingresso calcolato, tre livelli di Take-Profit (TP1, TP2, TP3) e un livello di Stop-Loss. È costruito su più livelli analitici progettati per adattarsi a diverse condizioni di mercato, combinando un sistema analitico multilivello con un ottimizzatore integrato e un sistema di traccia
Reversion King Indicator
Eugen-alexandru Zibileanu
5 (9)
Un nuovo Re in città - Indicatore + Gestione ordini (TP1 + TP2 + TP3) + Invio opzionale di segnali Telegram INCLUSO (GRATIS) (SISTEMA COMPLETO DI TRADING e SEGNALI) Il nostro miglior EA per l’Oro: Gold Slayer Questo indicatore include una strategia avanzata, un sistema di trading con gestione ordini personalizzabile e un sistema mean reversion che combina estensioni di envelope, supportato da molteplici filtri intelligenti di conferma come RSI per individuare ingressi di inversione ad alta proba
Gold Entry Sniper
Tahir Mehmood
5 (20)
Gold Entry Sniper – Dashboard ATR Multi-Timeframe per Scalping e Swing Trading sull’Oro Gold Entry Sniper è un indicatore avanzato per MetaTrader 5 che offre segnali di acquisto/vendita precisi per XAUUSD e altri strumenti, basato sulla logica ATR Trailing Stop e l' analisi multi-timeframe . Caratteristiche e Vantaggi Analisi Multi-Timeframe – Visualizza trend su M1, M5, M15 in un'unica dashboard. Trailing Stop Basato su ATR – Stop dinamici che si adattano alla volatilità. Dashboard Professional
Market Structure Order Block Dashboard MT5 è un indicatore MT5 progettato per i trader che vogliono leggere la struttura di mercato e le principali zone di reazione del prezzo direttamente sul grafico. Combina BOS, ChoCH, Order Blocks, Fair Value Gaps (FVG), Liquidità, Kill Zones, Volume Profile e un pannello compatto per un'analisi rapida. Questo indicatore è rivolto ai trader che utilizzano la struttura di mercato, i concetti ICT e Smart Money come quadro decisionale. Può aiutare a individuare
Welcome to ENTRY IN THE ZONE AND SMC MULTI TIMEFRAME Entry In The Zone and SMC Multi Timeframe is a real-time market analysis tool based on Smart Money Concepts (SMC), designed to analyze market structure, price direction, and key trading zones. It supports both Single-Timeframe Analysis and Multi-Timeframe Analysis, providing a clearer view of the overall market structure across multiple timeframes, with real-time BUY / SELL signals that do not repaint. It is designed to help filter trading opp
Atomic Analyst MT5
Issam Kassas
4.46 (59)
ATOMIC ANALYST — OFFERTA SPECIALE La tua analisi di mercato. Il tuo EA per l’automazione. La tua formazione e il tuo supporto. Acquista Atomic Analyst per MT5 a 99 USD e ricevi Smart Universal Expert Advisor GRATIS per automatizzare i segnali dell’indicatore. Atomic Analyst riunisce l’azione del prezzo, la direzione del trend, i segnali di entrata e uscita, lo Stop Loss e diversi livelli di Take Profit direttamente sul grafico. Opera manualmente utilizzando la sua analisi oppure collega l’EA in
Adaptive Price Action Engine Acquista un indicatore, ricevi l'EA gratis Analisi Auto-Ottimizzata del Trend e dei Pattern Candlestick Multi-Timeframe I mercati cambiano continuamente e non tutti i pattern di Price Action hanno lo stesso valore in ogni condizione di mercato. Adaptive Price Action Engine è progettato per adattarsi alle condizioni di mercato in continua evoluzione, combinando struttura del trend, analisi Multi-Timeframe, pattern Candlestick e ottimizzazione statistica in un unico fr
Tokyo mt5 Indicator
Vasiliy Strukov
5 (1)
Il Tokyo Indicator offre una chiara panoramica visiva della direzione del trend, dei potenziali segnali di trading e delle condizioni di mercato. La sua linea di trend a gradini, codificata a colori, distingue le fasi rialziste (in blu) da quelle ribassiste (in magenta). Frecce direzionali dedicate evidenziano potenziali opportunità di acquisto e vendita al variare del trend visualizzato. Una dashboard integrata riunisce in un'unica visualizzazione pratica il segnale corrente, il bias di mercato
Currency Strength Wizard   è un indicatore molto potente che ti fornisce una soluzione all-in-one per un trading di successo. L'indicatore calcola la potenza di questa o quella coppia forex utilizzando i dati di tutte le valute su più intervalli di tempo. Questi dati sono rappresentati in una forma di indice di valuta facile da usare e linee elettriche di valuta che puoi utilizzare per vedere il potere di questa o quella valuta. Tutto ciò di cui hai bisogno è collegare l'indicatore al grafico ch
FiboSniper Pro
Van Minh Nguyen
5 (3)
FiboSniper Pro – Multi-Filter Fibonacci System with Auto SL/TP and Control Panel FiboSniper Pro è un indicatore tecnico che combina Fibonacci Envelopes dinamici con diversi filtri di conferma per generare segnali Buy e Sell selezionati. I livelli di Fibonacci vengono calcolati sulla base di Moving Average e ATR e successivamente filtrati tramite ADX, EMA, RSI, ATR, Volume, Time e struttura delle candele. L’indicatore visualizza direttamente sul grafico i livelli automatici di Stop Loss e Take Pr
Divergence Bomber
Ihor Otkydach
4.89 (94)
Ogni acquirente dell’indicatore riceverà inoltre gratuitamente: L’utilità esclusiva “Bomber Utility”, che gestisce automaticamente ogni operazione, imposta i livelli di Stop Loss e Take Profit e chiude le posizioni secondo le regole della strategia I file di configurazione (set file) per adattare l’indicatore a diversi asset I set file per configurare il Bomber Utility in tre modalità: “Rischio Minimo”, “Rischio Bilanciato” e “Strategia di Attesa” Una guida video passo-passo per installare, con
SMART PRICE ACTION CONCEPTS — OFFERTA SPECIALE Osserva la struttura. Identifica le zone. Costruisci il tuo piano di trading. Acquista Smart Price Action Concepts per MT5 a 49 USD e ricevi Smart Universal Expert Advisor GRATIS. Riunisci Smart Money Concepts (SMC), analisi in stile ICT e azione del prezzo in un grafico organizzato. Identifica la struttura del mercato, gli order block, i livelli di riferimento della liquidità e gli squilibri, poi scegli quali elementi visualizzare tramite lo Smart
Superhero
Ihor Otkydach
5 (3)
L'indicatore SUPERHERO è un sistema di trading multivaluta progettato secondo un approccio "all-inclusive". L'indicatore analizza autonomamente il mercato e fornisce segnali su quando aprire e chiudere le posizioni. Utilizza ordini Stop Loss e Take Profit. Il rapporto R:R è 1:1. Questo sistema è in grado di inviare notifiche push sul tuo smartphone, consentendoti di effettuare operazioni "in mobilità" senza dover rimanere incollato al PC. È perfetto per le società di trading proprietario. UN OMA
Volatility Master for MetaTrader is a real-time dashboard tool that scans up to  50 symbols  to identify high-volatility , trending markets instantly. With bullish/bearish signals, customizable alerts, and a user-friendly interface, it helps you avoid range-bound conditions and focus on high-probability trades. Clarity leads to confidence. Trade confidently and protect your capital effectively with this powerful dashboard. We don't offer free or bonus indicators in exchange of reviews from you.
PZ Trend Trading MT5
PZ TRADING SLU
3.8 (5)
Capture every opportunity: your go-to indicator for profitable trend trading Trend Trading is an indicator designed to profit as much as possible from trends taking place in the market, by timing pullbacks and breakouts. It finds trading opportunities by analyzing what the price is doing during established trends. [ Installation Guide | Update Guide | Troubleshooting | FAQ | All Products ] Trade financial markets with confidence and efficiency Profit from established trends without getting whips
Power Candles MT5
Daniel Stein
4.58 (12)
Power Candles V3 - Indicatore di forza ad ottimizzazione automatica Power Candles V3 trasforma la forza delle valute e degli strumenti in un piano di trading attuabile su ogni grafico a cui è collegato. Invece di limitarsi a colorare le candele, esegue un'auto-ottimizzazione in tempo reale in background e ti fornisce i migliori valori di Stop Loss, Take Profit e soglia di segnale per il simbolo che hai davanti. Basta un clic per adottarlo nel trading live: i raggi di ingresso, Stop Loss e Take P
IQ FX Gann Levels a precision trading indicator based on W.D. Gann’s square root methods . It plots real-time, non-repainting support and resistance levels to help traders confidently spot intraday and scalping opportunities with high accuracy. William Delbert Gann (W.D. Gann) was an exceptional market analyst, whose trading technique was based on a complex blend of mathematics, geometry, astrology, and ancient mathematics which proved to be extremely accurate. We don't offer free or bonus indic
Trend Catcher ind mt5
Ramil Minniakhmetov
5 (18)
INDICATORE TREND CATCHER L'indicatore Trend Catcher analizza i movimenti dei prezzi di mercato, utilizzando una combinazione di indicatori di analisi del trend proprietari dell'autore e personalizzati. Identifica la vera direzione del mercato filtrando il rumore a breve termine e concentrandosi sulla forza del momentum sottostante, sull'espansione della volatilità e sul comportamento della struttura dei prezzi. Utilizza inoltre una combinazione di indicatori personalizzati di smoothing e filtr
RelicusRoad Pro MT5
Relicus LLC
4.96 (24)
RelicusRoad Pro: Sistema Operativo Quantitativo di Mercato 70% DI SCONTO ACCESSO A VITA (TEMPO LIMITATO) - UNISCITI A 2.000+ TRADER Perché la maggior parte dei trader fallisce anche con indicatori "perfetti"? Perché operano su Singoli Concetti isolati. Un segnale senza contesto è una scommessa. Per vincere serve CONFLUENZA . RelicusRoad Pro non è un semplice indicatore. È un Ecosistema Quantitativo completo . Mappa la "Fair Value Road", distinguendo tra rumore e rotture strutturali. Smetti di in
Axiom Matrix
Issam Kassas
5 (8)
Axiom Matrix — OFFERTA SPECIALE Acquista Axiom Matrix a 49 USD e ricevi Smart Universal Expert Advisor GRATIS. Esplora il mercato. Confronta i setup. Scegli il prossimo grafico. Axiom Matrix riunisce analisi su più simboli e timeframe in una dashboard. Individua dove concentrarti senza controllare ogni grafico separatamente. Analizza l’Osservazione del mercato o i simboli scelti su più timeframe. Confronta trend, momentum, volume, volatilità e qualità del mercato. Esplora i setup con Best Axiom
Altri dall’autore
QuantMatrix Probability AI Free QuantMatrix Probability AI Free is a technical indicator for MetaTrader 5 that combines several measurements of current market conditions into three numerical estimates. The indicator uses exponential moving averages, Relative Strength Index (RSI), Average True Range (ATR) and the current price position in its calculation. These measurements are combined into a normalized market score. The resulting information is displayed on the chart as: BUY percentage SELL p
FREE
QuantMatrix Candle Patterns is a free MetaTrader 5 indicator designed to identify classic candlestick formations directly on the chart. The indicator analyzes completed candles and detects recognized bullish, bearish and neutral price-action patterns. When a valid bullish or bearish formation is confirmed, the corresponding BUY or SELL signal is displayed on the following candle . This means the signal is only generated after the source pattern has been completed. The indicator also displays a c
FREE
QuantMatrix Wick Pressure QuantMatrix Wick Pressure is a technical indicator for MetaTrader 5 that measures the relationship between upper and lower candlestick wicks and converts this information into a numerical pressure measurement. Candlestick wicks represent price movement that occurred beyond the candle body before price returned from those levels. The indicator measures this rejection behavior over consecutive candles and displays the result in a separate indicator window. Positive values
FREE
QuantMatrix Volatility Regime QuantMatrix Volatility Regime is a technical indicator for MetaTrader 5 that evaluates the current volatility of the selected symbol and timeframe. The indicator uses Average True Range (ATR) to compare current volatility with a historical baseline calculated from previous bars. Based on this comparison, the current market condition is classified into one of four volatility regimes: LOW – current volatility is below the historical baseline. NORMAL – current volatil
FREE
QuantMatrix Probability AI PRO QuantMatrix Probability AI PRO is a technical indicator for MetaTrader 5 designed to evaluate current market conditions and present them as BUY, SELL and NEUTRAL percentage estimates. The indicator combines several market measurements, including trend, momentum, volatility, price position, candlestick wick behavior and breakout conditions. It also compares the current market state with similar historical situations found in the selected symbol and timeframe. The hi
QM Candle Timing Meter
Rafael Barreto Haddad
QM Candle Timing Meter is a free MetaTrader 5 indicator designed to answer one simple question: How late am I in the current candle? A trading signal may still be technically valid while the timing of the entry has already changed significantly. For example, entering during the first minutes of an H1 candle is very different from entering when 90% of that candle has already elapsed. QM Candle Timing Meter continuously measures the temporal position of the current candle and displays this informa
FREE
QuantMatrix FXGold V8
Rafael Barreto Haddad
QuantMatrix Gold V8.4 Trading quantitativo adattivo per XAUUSD QuantMatrix Gold V8.4 è un Expert Advisor avanzato sviluppato esclusivamente per Oro (XAUUSD) . Invece di utilizzare una singola strategia fissa o una combinazione tradizionale di indicatori, QuantMatrix Gold utilizza un'architettura quantitativa orientata alla ricerca, progettata per scoprire, validare, classificare e monitorare continuamente diversi modelli di trading. Un approccio differente Approccio tradizionale: Indicatore → Se
QuantMatrix Candle Exhaustion QuantMatrix Candle Exhaustion is a technical indicator for MetaTrader 5 that identifies candles showing predefined price expansion and wick characteristics. The indicator compares the range of the current candle with the average range of previous candles. When the candle range exceeds the configured historical range threshold, its upper and lower wicks are evaluated. A bullish exhaustion marker can be displayed when an expanded bullish candle also contains the requi
QuantMatrix False Breakout Detector QuantMatrix False Breakout Detector is a technical indicator for MetaTrader 5 that identifies potential failed breakouts of recent price ranges. The indicator calculates the highest high and lowest low within a configurable historical period. It then evaluates whether the current price moves beyond one of these levels by a minimum volatility-adjusted distance and subsequently closes back inside the previous range. Average True Range (ATR) is used to adjust the
QuantMatrix Historical Move Probability QuantMatrix Historical Move Probability is a statistical indicator for MetaTrader 5 that compares the current price movement with similar movements found in the historical data of the selected symbol and timeframe. Price movements are normalized using Average True Range (ATR). This allows movements from different historical periods to be compared relative to the volatility present at each period. The indicator searches the configured historical sample for
QuantMatrix Prism Structure is a MetaTrader 5 indicator for visual analysis of market structure. It identifies confirmed swing highs and swing lows and displays structural information directly on the chart. The indicator can display higher highs, higher lows, lower highs, lower lows, structure changes, fair value gap areas and ATR based information. A chart panel summarizes the current structure state, recent structural events and relevant market information. The indicator is intended for m
QuantMatrix Volume Depth is a MetaTrader 5 indicator for visual analysis of market activity across different price levels. The indicator builds a horizontal profile across the analyzed price range and shows where trading activity has been concentrated. It displays the Point of Control, Value Area High, Value Area Low and the distribution of activity across multiple price levels. The indicator can use real volume when it is available from the symbol. When real volume is not available, tick vol
Filtro:
str8derx
79
str8derx 2026.09.03 15:03 
 

L'utente non ha lasciato alcun commento sulla valutazione.

Rispondi alla recensione