
QM FlowVision X1
- Indicateurs
-
Rafael Barreto Haddad
 Chercheur en systèmes de trading quantitatif | Créateur de QuantMatrix Research Series | MetaTrader 5
Créateur de la série de recherche QuantMatrix pour MetaTrader 5. - Version: 1.10
Visual Multi-Factor Trading Indicator with Historical Probability, Market Flow, Momentum, Divergence and Multi-Timeframe Context
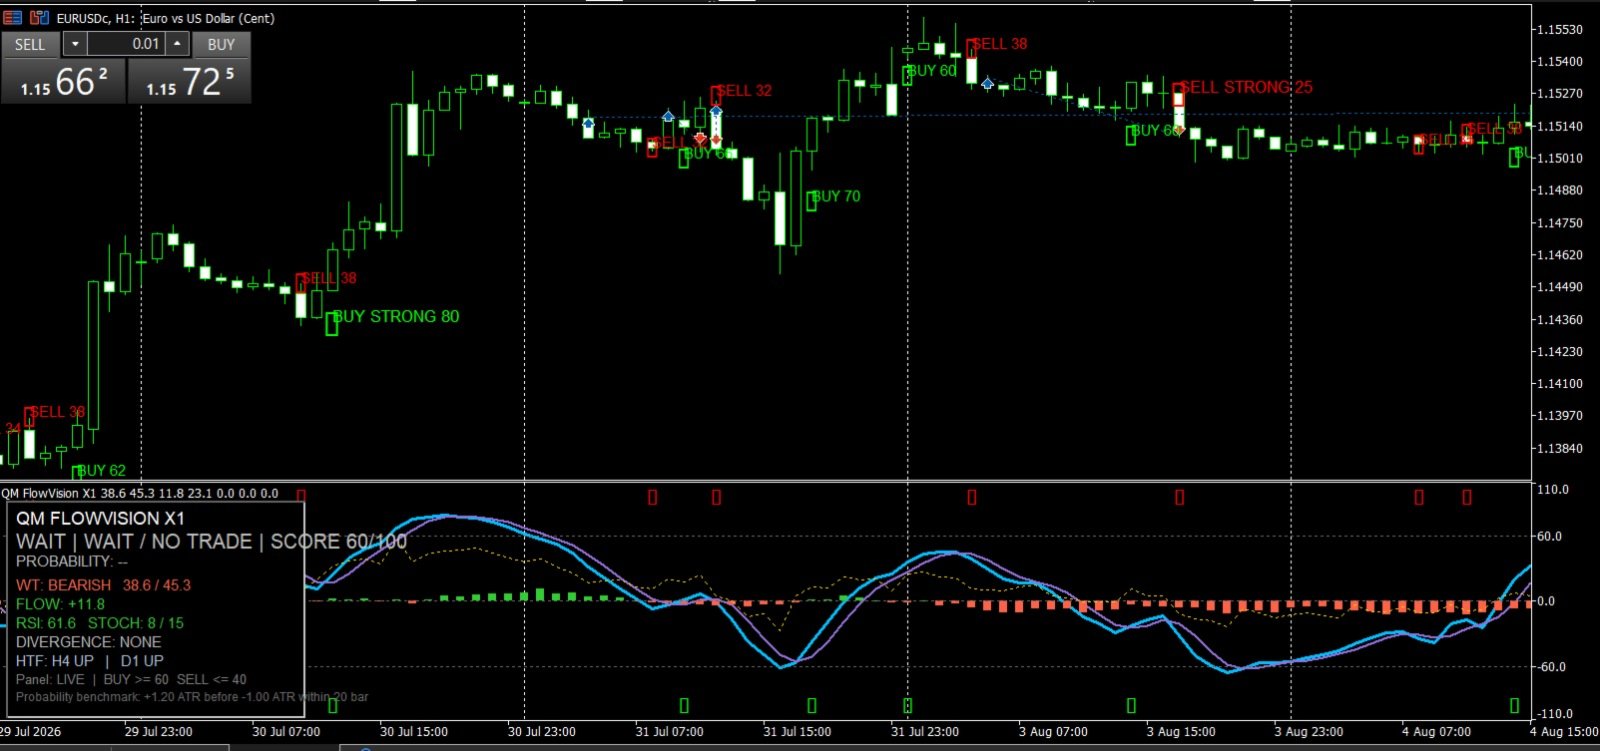
QM FlowVision X1 is a visual decision-support indicator for MetaTrader 5 designed to transform multiple market conditions into a simple and readable trading state.
Instead of displaying isolated oscillators without interpretation, FlowVision combines momentum, money flow, RSI, Stochastic RSI, divergence and higher-timeframe context into a unified 0–100 directional score.
The indicator then classifies the current market condition as:
-
STRONG BUY
-
BUY
-
WAIT / NO TRADE
-
SELL
-
STRONG SELL
In addition to the directional score, FlowVision includes a Historical Probability Engine that analyzes how similar signals behaved in the past.
This allows the trader to distinguish between two completely different concepts:
Score = how strongly the current indicators agree.
Probability = how similar historical signals actually performed.
Main Features1. Visual Wave Momentum Engine
FlowVision displays two momentum waves designed to identify changes in market direction and momentum.
The relationship between Wave 1 and Wave 2 is used as one of the main components of the directional score.
Bullish and bearish crossings can also participate in signal generation, particularly when they occur in relevant momentum zones.
2. Money FlowA visual Money Flow histogram helps identify current buying or selling pressure.
-
Green = positive flow
-
Red = negative flow
Money Flow is included directly in the FlowVision scoring model.
This helps distinguish a momentum signal supported by market pressure from one occurring against the current flow.
3. RSIFlowVision includes an RSI component as part of its multi-factor analysis.
RSI is not used as a standalone BUY or SELL system.
Instead, it contributes to the total directional score and helps identify whether momentum is strengthening, weakening or remaining neutral.
4. Stochastic RSIStochastic RSI is used as an additional momentum confirmation layer.
The relationship between its K and D components contributes to the FlowVision score.
This provides a faster momentum component alongside the slower Wave and RSI structures.
5. Divergence DetectionFlowVision automatically detects regular bullish and bearish divergences between price and the internal Wave structure.
Bullish divergence:
Price forms a lower low while the oscillator forms a higher low.
Bearish divergence:
Price forms a higher high while the oscillator forms a lower high.
Divergences are confirmed only after the required pivot structure exists.
They are therefore treated as confirmed events rather than being projected into the past before confirmation.
6. Multi-Timeframe ContextFlowVision includes two higher-timeframe context filters.
With Auto HTF enabled, the higher timeframes automatically adapt when the chart timeframe changes.
Default automatic structure:
M1–M5
-
Context 1: M15
-
Context 2: H1
M6–M30
-
Context 1: H1
-
Context 2: H4
H1–H3
-
Context 1: H4
-
Context 2: D1
H4–H12
-
Context 1: D1
-
Context 2: W1
D1
-
Context 1: W1
-
Context 2: MN1
The user can disable Auto HTF and manually select both higher timeframes.
Higher-timeframe context is determined using fast and slow EMA relationships.
7. FlowVision Score — 0 to 100The indicator combines six analysis groups into one directional score:
-
Wave momentum
-
Money Flow
-
RSI
-
Stochastic RSI
-
Divergence
-
Higher-timeframe context
The final value ranges from 0 to 100.
Default interpretation:
75–100
STRONG BUY
60–74
BUY
41–59
WAIT / NO TRADE
26–40
SELL
0–25
STRONG SELL
These thresholds can be changed in the indicator inputs.
The score represents market confluence, not historical win probability.
8. Historical Probability EngineOne of the main features of QM FlowVision X1 is its internal Historical Probability Engine.
When the current state reaches BUY or SELL territory, FlowVision searches the historical data of the current symbol and timeframe for previous signals in the same direction with a similar FlowVision score.
By default, signals are considered similar when their scores are within ±10 points of the current score.
The indicator then evaluates what happened after each historical signal.
Default benchmark:
Target: +1.20 ATR
Stop reference: -1.00 ATR
Maximum evaluation horizon: 20 candles
For a BUY signal, the historical event is considered successful when price reaches +1.20 ATR before falling -1.00 ATR.
For a SELL signal, the logic is reversed.
If both target and stop are reached inside the same candle, FlowVision applies the conservative assumption and records the event as a loss.
9. Probability Is Different from ScoreThis distinction is important.
An example:
BUY
Score: 82/100
Historical Probability: 64%
This means the current technical conditions have strong bullish confluence, while approximately 64% of the resolved similar historical BUY signals reached the configured target before the configured stop.
Another example:
STRONG BUY
Score: 87/100
Historical Probability: 46%
The technical picture may currently be strongly bullish, but historically similar signals did not produce a strong success rate.
FlowVision allows the trader to see both pieces of information instead of assuming that a high indicator score automatically represents a high statistical probability.
10. Sample SizeHistorical probability is displayed together with the number of historical observations.
The panel uses the following sample-quality classification:
INSUFFICIENT
Less than the configured minimum sample size. Default: 30 resolved samples.
LOW
30–99 resolved samples.
MODERATE
100–299 resolved samples.
HIGH
300 or more resolved samples.
This is important because a probability calculated from a very small sample should not be interpreted in the same way as a probability calculated from hundreds of historical occurrences.
FlowVision also displays:
N = resolved historical samples
U = unresolved historical samples
11. Probability SmoothingHistorical probability uses Laplace smoothing.
This reduces extreme probability readings caused by small samples.
For example, a very small group of winning observations will not immediately be displayed as an unrealistic 100% probability.
12. Historical ExpectancyFlowVision also calculates historical expectancy in R.
Example:
EXP +0.32R
indicates that the historical group of similar signals produced an average positive outcome equivalent to approximately +0.32 units of the configured risk reference.
A negative expectancy indicates that similar historical signals produced a negative average result under the current probability benchmark.
Probability and expectancy should be analyzed together.
A high win rate does not automatically mean positive expectancy.
13. Visual Trading PanelThe FlowVision panel provides an immediate overview of the market.
It displays:
-
Current market state
-
FlowVision Score
-
BUY or SELL Historical Probability
-
Historical sample size
-
Unresolved samples
-
Historical expectancy
-
Wave direction
-
Money Flow
-
RSI
-
Stochastic RSI
-
Divergence status
-
Higher-timeframe context
-
Probability benchmark
Example:
QM FLOWVISION X1
BUY | STRONG BUY | SCORE 81/100
BUY PROB: 66.4% | N=214 | EXP +0.31R | MODERATE
WT: BULLISH
FLOW: +18.2
RSI: 61.4
STOCH: 72 / 64
DIVERGENCE: BULLISH
HTF: H1 UP | H4 UP
14. BUY and SELL SignalsFlowVision does not generate a new signal simply because the score remains inside BUY or SELL territory.
The internal trigger engine evaluates events such as:
-
Entry of the score into a BUY or SELL state
-
Wave momentum crossing in a relevant zone
-
Confirmed bullish or bearish divergence
A valid BUY requires the FlowVision score to be inside BUY territory.
A valid SELL requires the FlowVision score to be inside SELL territory.
This reduces repetitive signals while the same market condition remains active.
15. Historical Chart SignalsConfirmed BUY and SELL events can be displayed directly on the main price chart.
BUY signals appear below price.
SELL signals appear above price.
Signal labels can also display the corresponding FlowVision score.
Strong signals receive additional visual emphasis.
16. Closed-Bar Signal ConfirmationHistorical signal arrows and alerts are generated from confirmed closed candles.
This is designed to prevent an unfinished candle from being presented as a completed trading signal.
The live panel is different:
The panel continuously represents the current candle and can therefore change while that candle is forming.
Traders should understand the distinction between:
-
Live market analysis
-
Confirmed closed-bar signals
FlowVision supports MetaTrader alerts when a confirmed BUY or SELL signal is generated.
Optional Push Notifications are also available.
Signal alerts can include:
-
Symbol
-
Direction
-
Signal strength
-
Score
-
Historical probability
-
Number of samples
-
Historical expectancy
-
Current timeframe
A simple way to use the indicator is to analyze four layers.
Layer 1 — Direction
Start with the current FlowVision state.
STRONG BUY / BUY
Bullish environment.
WAIT / NO TRADE
Insufficient directional agreement.
SELL / STRONG SELL
Bearish environment.
Layer 2 — Historical Probability
Check whether similar signals performed well historically.
Example:
BUY Score 72
Probability 64%
N=185
This carries more historical information than:
BUY Score 72
Probability 75%
N=8
Sample size matters.
Layer 3 — Expectancy
Check whether historical expectancy is positive.
A positive probability combined with positive expectancy represents stronger historical evidence than win rate alone.
Layer 4 — Context
Observe:
-
Wave direction
-
Money Flow
-
RSI
-
Stochastic RSI
-
Divergence
-
Higher-timeframe direction
The panel allows traders to understand why the score is bullish, neutral or bearish.
Example Bullish ReadingSTRONG BUY
Score: 82/100
Historical Probability: 67%
Samples: 236
Expectancy: +0.34R
Wave: Bullish
Money Flow: Positive
RSI: Bullish
Stochastic: Bullish
H1 Context: UP
H4 Context: UP
This represents strong technical confluence combined with positive historical statistics.
Example No-Trade ReadingWAIT / NO TRADE
Score: 53/100
Wave: Bullish
Money Flow: Negative
RSI: Neutral
Stochastic: Bearish
HTF Context: Mixed
FlowVision identifies conflicting information and does not classify the market as a directional BUY or SELL condition.
Example of Technical Strength with Weak Historical EvidenceSTRONG BUY
Score: 81/100
Probability: 48%
Samples: 301
Expectancy: -0.07R
The current technical structure is strongly bullish, but historically similar BUY signals did not demonstrate a positive statistical advantage under the selected ATR benchmark.
This is exactly why FlowVision keeps Score and Probability separate.
Main InputsCore / Wave
WT Channel Length
Controls the main Wave smoothing period.
Default: 9
WT Average Length
Controls the WaveTrend average.
Default: 12
WT Signal Length
Controls the secondary Wave signal smoothing.
Default: 3
WT Overbought
Default: 53
WT Oversold
Default: -53
Flow Period
Default: 34
RSI Period
Default: 14
Stochastic Period
Default: 14
Stochastic K Smooth
Default: 3
Stochastic D Smooth
Default: 3
Auto HTF
Automatically selects higher-timeframe context according to the chart timeframe.
Default: true
HTF1 / HTF2
Manual higher timeframes used when Auto HTF is disabled.
Fast EMA
Default: 20
Slow EMA
Default: 50
Strong Buy Score
Default: 75
Buy Score
Default: 60
Sell Score
Default: 40
Strong Sell Score
Default: 25
WT Trigger Zone
Default: 25
Probability Lookback Bars
Default: 3000
Maximum historical search window used by the probability engine.
Forward Bars
Default: 20
Maximum number of candles evaluated after each historical signal.
ATR Period
Default: 14
Target ATR
Default: 1.20
Stop ATR
Default: 1.00
Score Tolerance
Default: 10
Controls how similar a historical signal's FlowVision score must be compared with the current score.
Minimum Display Sample
Default: 30
Used to classify very small statistical samples as insufficient.
Visual SettingsUsers can enable or disable:
-
RSI display
-
Score line
-
Price-chart arrows
-
Signal text
-
Information panel
-
Historical signal display
The number of historical signal bars and maximum calculation bars can also be configured.
AlertsEnable Alerts
Enables standard MetaTrader signal alerts.
Enable Push
Enables MetaTrader Push Notifications when configured in the terminal.
QM FlowVision X1 automatically recalculates when the chart timeframe changes.
The signal engine always analyzes the active chart timeframe.
Higher-timeframe context automatically adjusts when Auto HTF is enabled.
Because market behavior differs between symbols and timeframes, historical probability and expectancy should always be interpreted specifically for the currently selected symbol and timeframe.
MarketsFlowVision is designed as a multi-factor technical analysis tool and can be applied to different MetaTrader 5 symbols where sufficient historical price data is available.
Results and historical statistics can differ significantly between:
-
Forex pairs
-
Metals
-
Indices
-
Cryptocurrencies
-
Different brokers
-
Different timeframes
-
Different market conditions
Users should evaluate the indicator on the specific market and timeframe they intend to trade.
Important InformationQM FlowVision X1 is an indicator.
It does not open, manage or close trades.
It does not guarantee future market performance.
Historical probability represents the historical behavior of similar FlowVision signals under the configured ATR target, stop and evaluation horizon.
Historical statistics do not guarantee that the same behavior will occur in the future.
Probability should not be interpreted as certainty.
The live panel may change while the current candle is still forming.
Confirmed signal arrows and alerts are based on closed-bar conditions.
Trading involves financial risk. Always evaluate the method according to your own strategy, account size and risk tolerance.
Automated Trading
QM FlowVision X1 is designed for manual market analysis and does not execute trades.
Traders who prefer automated execution can use the separate QM FlowVision EA X1, an Expert Advisor from the same FlowVision product family.
The EA contains its own signal engine and does not require this indicator to be installed.
Related FlowVision products can be found among the author's products in the MQL5 Market.
For the first evaluation:
-
Keep the default parameters.
-
Enable Auto HTF.
-
Open the desired symbol and timeframe.
-
Observe the FlowVision Score.
-
Compare Score with Historical Probability.
-
Check the number of historical samples.
-
Check Historical Expectancy.
-
Observe Wave, Money Flow and higher-timeframe alignment.
-
Use confirmed BUY and SELL signals together with your own risk-management process.
Do not interpret a single component in isolation.
The purpose of FlowVision is to combine technical information, historical behavior and market context into one visual decision-support environment.
QM FlowVision X1See the signal. Understand the context. Measure the history.
















































L'utilisateur n'a laissé aucun commentaire sur la note