QM FlowVision X1

  • 지표
  • Rafael Barreto Haddad
    Rafael Barreto Haddad
    • Rafael Haddad → QuantMatrix → quantitative trading research 에  Quantitative Trading Systems Researcher
    • 브라질
    • 1884
    퀀트 트레이딩 시스템 연구자 | QuantMatrix Research Series 개발자 | MetaTrader 5
    MetaTrader 5용 QuantMatrix Research Series의 개발자입니다.
    과거 데이터, 전략 검증 및 지속적인 모델 평가를 기반으로 정량적 트레이딩 시스템, 적응형 Expert Advisor 및 시장 분석 도구를 개발합니다.
  • 버전: 1.10
QM FlowVision X1

Visual Multi-Factor Trading Indicator with Historical Probability, Market Flow, Momentum, Divergence and Multi-Timeframe Context

QM FlowVision X1 is a visual decision-support indicator for MetaTrader 5 designed to transform multiple market conditions into a simple and readable trading state.

Instead of displaying isolated oscillators without interpretation, FlowVision combines momentum, money flow, RSI, Stochastic RSI, divergence and higher-timeframe context into a unified 0–100 directional score.

The indicator then classifies the current market condition as:

  • STRONG BUY

  • BUY

  • WAIT / NO TRADE

  • SELL

  • STRONG SELL

In addition to the directional score, FlowVision includes a Historical Probability Engine that analyzes how similar signals behaved in the past.

This allows the trader to distinguish between two completely different concepts:

Score = how strongly the current indicators agree.

Probability = how similar historical signals actually performed.

Main Features

1. Visual Wave Momentum Engine

FlowVision displays two momentum waves designed to identify changes in market direction and momentum.

The relationship between Wave 1 and Wave 2 is used as one of the main components of the directional score.

Bullish and bearish crossings can also participate in signal generation, particularly when they occur in relevant momentum zones.

2. Money Flow

A visual Money Flow histogram helps identify current buying or selling pressure.

  • Green = positive flow

  • Red = negative flow

Money Flow is included directly in the FlowVision scoring model.

This helps distinguish a momentum signal supported by market pressure from one occurring against the current flow.

3. RSI

FlowVision includes an RSI component as part of its multi-factor analysis.

RSI is not used as a standalone BUY or SELL system.

Instead, it contributes to the total directional score and helps identify whether momentum is strengthening, weakening or remaining neutral.

4. Stochastic RSI

Stochastic RSI is used as an additional momentum confirmation layer.

The relationship between its K and D components contributes to the FlowVision score.

This provides a faster momentum component alongside the slower Wave and RSI structures.

5. Divergence Detection

FlowVision automatically detects regular bullish and bearish divergences between price and the internal Wave structure.

Bullish divergence:

Price forms a lower low while the oscillator forms a higher low.

Bearish divergence:

Price forms a higher high while the oscillator forms a lower high.

Divergences are confirmed only after the required pivot structure exists.

They are therefore treated as confirmed events rather than being projected into the past before confirmation.

6. Multi-Timeframe Context

FlowVision includes two higher-timeframe context filters.

With Auto HTF enabled, the higher timeframes automatically adapt when the chart timeframe changes.

Default automatic structure:

M1–M5

  • Context 1: M15

  • Context 2: H1

M6–M30

  • Context 1: H1

  • Context 2: H4

H1–H3

  • Context 1: H4

  • Context 2: D1

H4–H12

  • Context 1: D1

  • Context 2: W1

D1

  • Context 1: W1

  • Context 2: MN1

The user can disable Auto HTF and manually select both higher timeframes.

Higher-timeframe context is determined using fast and slow EMA relationships.

7. FlowVision Score — 0 to 100

The indicator combines six analysis groups into one directional score:

  • Wave momentum

  • Money Flow

  • RSI

  • Stochastic RSI

  • Divergence

  • Higher-timeframe context

The final value ranges from 0 to 100.

Default interpretation:

75–100
STRONG BUY

60–74
BUY

41–59
WAIT / NO TRADE

26–40
SELL

0–25
STRONG SELL

These thresholds can be changed in the indicator inputs.

The score represents market confluence, not historical win probability.

8. Historical Probability Engine

One of the main features of QM FlowVision X1 is its internal Historical Probability Engine.

When the current state reaches BUY or SELL territory, FlowVision searches the historical data of the current symbol and timeframe for previous signals in the same direction with a similar FlowVision score.

By default, signals are considered similar when their scores are within ±10 points of the current score.

The indicator then evaluates what happened after each historical signal.

Default benchmark:

Target: +1.20 ATR

Stop reference: -1.00 ATR

Maximum evaluation horizon: 20 candles

For a BUY signal, the historical event is considered successful when price reaches +1.20 ATR before falling -1.00 ATR.

For a SELL signal, the logic is reversed.

If both target and stop are reached inside the same candle, FlowVision applies the conservative assumption and records the event as a loss.

9. Probability Is Different from Score

This distinction is important.

An example:

BUY
Score: 82/100
Historical Probability: 64%

This means the current technical conditions have strong bullish confluence, while approximately 64% of the resolved similar historical BUY signals reached the configured target before the configured stop.

Another example:

STRONG BUY
Score: 87/100
Historical Probability: 46%

The technical picture may currently be strongly bullish, but historically similar signals did not produce a strong success rate.

FlowVision allows the trader to see both pieces of information instead of assuming that a high indicator score automatically represents a high statistical probability.

10. Sample Size

Historical probability is displayed together with the number of historical observations.

The panel uses the following sample-quality classification:

INSUFFICIENT
Less than the configured minimum sample size. Default: 30 resolved samples.

LOW
30–99 resolved samples.

MODERATE
100–299 resolved samples.

HIGH
300 or more resolved samples.

This is important because a probability calculated from a very small sample should not be interpreted in the same way as a probability calculated from hundreds of historical occurrences.

FlowVision also displays:

N = resolved historical samples

U = unresolved historical samples

11. Probability Smoothing

Historical probability uses Laplace smoothing.

This reduces extreme probability readings caused by small samples.

For example, a very small group of winning observations will not immediately be displayed as an unrealistic 100% probability.

12. Historical Expectancy

FlowVision also calculates historical expectancy in R.

Example:

EXP +0.32R

indicates that the historical group of similar signals produced an average positive outcome equivalent to approximately +0.32 units of the configured risk reference.

A negative expectancy indicates that similar historical signals produced a negative average result under the current probability benchmark.

Probability and expectancy should be analyzed together.

A high win rate does not automatically mean positive expectancy.

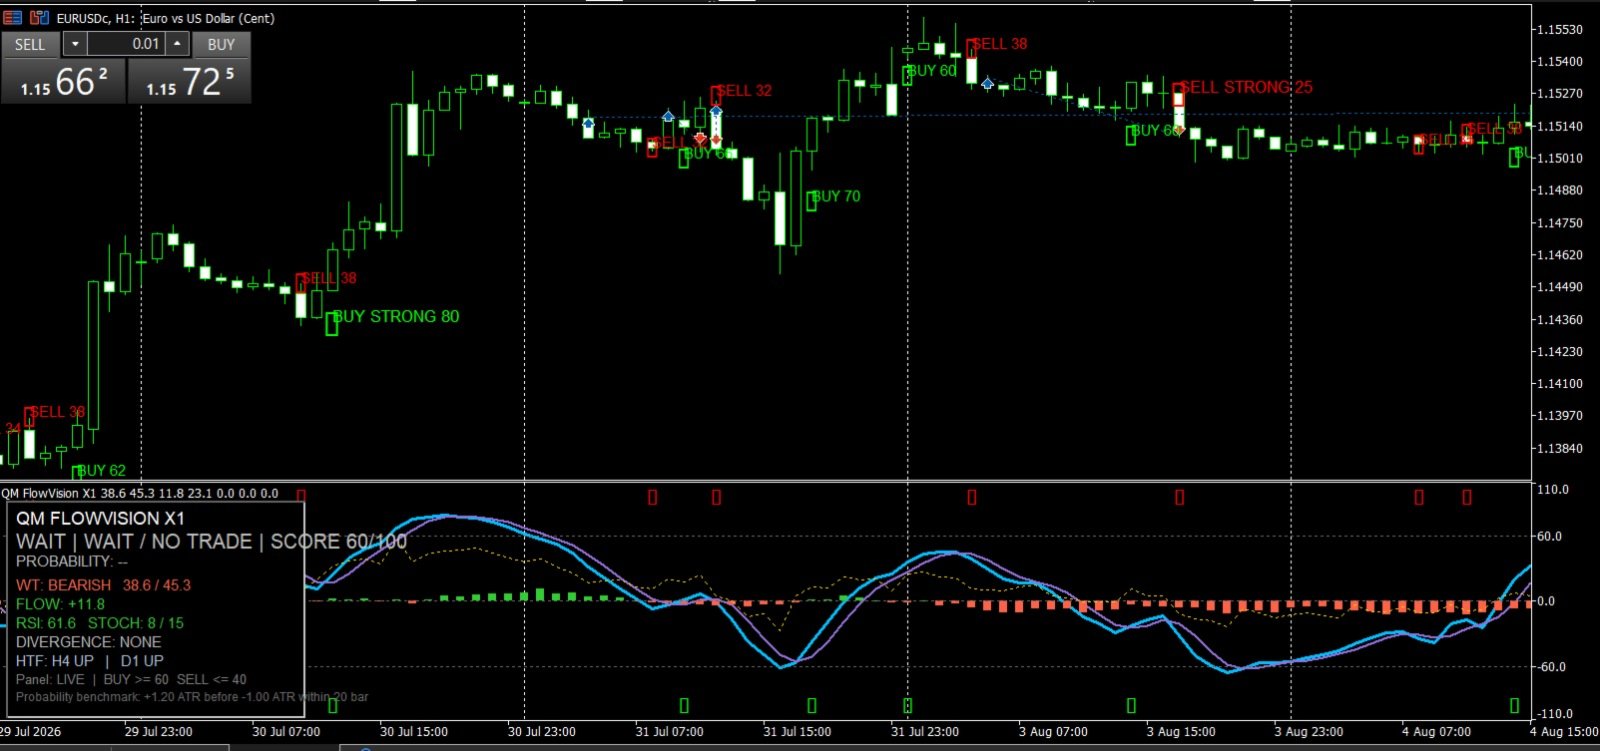
13. Visual Trading Panel

The FlowVision panel provides an immediate overview of the market.

It displays:

  • Current market state

  • FlowVision Score

  • BUY or SELL Historical Probability

  • Historical sample size

  • Unresolved samples

  • Historical expectancy

  • Wave direction

  • Money Flow

  • RSI

  • Stochastic RSI

  • Divergence status

  • Higher-timeframe context

  • Probability benchmark

Example:

QM FLOWVISION X1

BUY | STRONG BUY | SCORE 81/100

BUY PROB: 66.4% | N=214 | EXP +0.31R | MODERATE

WT: BULLISH

FLOW: +18.2

RSI: 61.4

STOCH: 72 / 64

DIVERGENCE: BULLISH

HTF: H1 UP | H4 UP

14. BUY and SELL Signals

FlowVision does not generate a new signal simply because the score remains inside BUY or SELL territory.

The internal trigger engine evaluates events such as:

  • Entry of the score into a BUY or SELL state

  • Wave momentum crossing in a relevant zone

  • Confirmed bullish or bearish divergence

A valid BUY requires the FlowVision score to be inside BUY territory.

A valid SELL requires the FlowVision score to be inside SELL territory.

This reduces repetitive signals while the same market condition remains active.

15. Historical Chart Signals

Confirmed BUY and SELL events can be displayed directly on the main price chart.

BUY signals appear below price.

SELL signals appear above price.

Signal labels can also display the corresponding FlowVision score.

Strong signals receive additional visual emphasis.

16. Closed-Bar Signal Confirmation

Historical signal arrows and alerts are generated from confirmed closed candles.

This is designed to prevent an unfinished candle from being presented as a completed trading signal.

The live panel is different:

The panel continuously represents the current candle and can therefore change while that candle is forming.

Traders should understand the distinction between:

  • Live market analysis

  • Confirmed closed-bar signals

17. Alerts

FlowVision supports MetaTrader alerts when a confirmed BUY or SELL signal is generated.

Optional Push Notifications are also available.

Signal alerts can include:

  • Symbol

  • Direction

  • Signal strength

  • Score

  • Historical probability

  • Number of samples

  • Historical expectancy

  • Current timeframe

How to Read FlowVision

A simple way to use the indicator is to analyze four layers.

Layer 1 — Direction

Start with the current FlowVision state.

STRONG BUY / BUY
Bullish environment.

WAIT / NO TRADE
Insufficient directional agreement.

SELL / STRONG SELL
Bearish environment.

Layer 2 — Historical Probability

Check whether similar signals performed well historically.

Example:

BUY Score 72
Probability 64%
N=185

This carries more historical information than:

BUY Score 72
Probability 75%
N=8

Sample size matters.

Layer 3 — Expectancy

Check whether historical expectancy is positive.

A positive probability combined with positive expectancy represents stronger historical evidence than win rate alone.

Layer 4 — Context

Observe:

  • Wave direction

  • Money Flow

  • RSI

  • Stochastic RSI

  • Divergence

  • Higher-timeframe direction

The panel allows traders to understand why the score is bullish, neutral or bearish.

Example Bullish Reading

STRONG BUY

Score: 82/100

Historical Probability: 67%

Samples: 236

Expectancy: +0.34R

Wave: Bullish

Money Flow: Positive

RSI: Bullish

Stochastic: Bullish

H1 Context: UP

H4 Context: UP

This represents strong technical confluence combined with positive historical statistics.

Example No-Trade Reading

WAIT / NO TRADE

Score: 53/100

Wave: Bullish

Money Flow: Negative

RSI: Neutral

Stochastic: Bearish

HTF Context: Mixed

FlowVision identifies conflicting information and does not classify the market as a directional BUY or SELL condition.

Example of Technical Strength with Weak Historical Evidence

STRONG BUY

Score: 81/100

Probability: 48%

Samples: 301

Expectancy: -0.07R

The current technical structure is strongly bullish, but historically similar BUY signals did not demonstrate a positive statistical advantage under the selected ATR benchmark.

This is exactly why FlowVision keeps Score and Probability separate.

Main Inputs

Core / Wave

WT Channel Length
Controls the main Wave smoothing period.

Default: 9

WT Average Length
Controls the WaveTrend average.

Default: 12

WT Signal Length
Controls the secondary Wave signal smoothing.

Default: 3

WT Overbought
Default: 53

WT Oversold
Default: -53

Flow / RSI / Stochastic

Flow Period
Default: 34

RSI Period
Default: 14

Stochastic Period
Default: 14

Stochastic K Smooth
Default: 3

Stochastic D Smooth
Default: 3

Higher-Timeframe Context

Auto HTF
Automatically selects higher-timeframe context according to the chart timeframe.

Default: true

HTF1 / HTF2
Manual higher timeframes used when Auto HTF is disabled.

Fast EMA
Default: 20

Slow EMA
Default: 50

Signal Thresholds

Strong Buy Score
Default: 75

Buy Score
Default: 60

Sell Score
Default: 40

Strong Sell Score
Default: 25

WT Trigger Zone
Default: 25

Historical Probability Settings

Probability Lookback Bars
Default: 3000

Maximum historical search window used by the probability engine.

Forward Bars
Default: 20

Maximum number of candles evaluated after each historical signal.

ATR Period
Default: 14

Target ATR
Default: 1.20

Stop ATR
Default: 1.00

Score Tolerance
Default: 10

Controls how similar a historical signal's FlowVision score must be compared with the current score.

Minimum Display Sample
Default: 30

Used to classify very small statistical samples as insufficient.

Visual Settings

Users can enable or disable:

  • RSI display

  • Score line

  • Price-chart arrows

  • Signal text

  • Information panel

  • Historical signal display

The number of historical signal bars and maximum calculation bars can also be configured.

Alerts

Enable Alerts
Enables standard MetaTrader signal alerts.

Enable Push
Enables MetaTrader Push Notifications when configured in the terminal.

Timeframes

QM FlowVision X1 automatically recalculates when the chart timeframe changes.

The signal engine always analyzes the active chart timeframe.

Higher-timeframe context automatically adjusts when Auto HTF is enabled.

Because market behavior differs between symbols and timeframes, historical probability and expectancy should always be interpreted specifically for the currently selected symbol and timeframe.

Markets

FlowVision is designed as a multi-factor technical analysis tool and can be applied to different MetaTrader 5 symbols where sufficient historical price data is available.

Results and historical statistics can differ significantly between:

  • Forex pairs

  • Metals

  • Indices

  • Cryptocurrencies

  • Different brokers

  • Different timeframes

  • Different market conditions

Users should evaluate the indicator on the specific market and timeframe they intend to trade.

Important Information

QM FlowVision X1 is an indicator.

It does not open, manage or close trades.

It does not guarantee future market performance.

Historical probability represents the historical behavior of similar FlowVision signals under the configured ATR target, stop and evaluation horizon.

Historical statistics do not guarantee that the same behavior will occur in the future.

Probability should not be interpreted as certainty.

The live panel may change while the current candle is still forming.

Confirmed signal arrows and alerts are based on closed-bar conditions.

Trading involves financial risk. Always evaluate the method according to your own strategy, account size and risk tolerance.


Automated Trading
QM FlowVision X1 is designed for manual market analysis and does not execute trades.
Traders who prefer automated execution can use the separate QM FlowVision EA X1, an Expert Advisor from the same FlowVision product family.
The EA contains its own signal engine and does not require this indicator to be installed.
Related FlowVision products can be found among the author's products in the MQL5 Market.

Recommended First Use

For the first evaluation:

  1. Keep the default parameters.

  2. Enable Auto HTF.

  3. Open the desired symbol and timeframe.

  4. Observe the FlowVision Score.

  5. Compare Score with Historical Probability.

  6. Check the number of historical samples.

  7. Check Historical Expectancy.

  8. Observe Wave, Money Flow and higher-timeframe alignment.

  9. Use confirmed BUY and SELL signals together with your own risk-management process.

Do not interpret a single component in isolation.

The purpose of FlowVision is to combine technical information, historical behavior and market context into one visual decision-support environment.

QM FlowVision X1

See the signal. Understand the context. Measure the history.

추천 제품
High Low Open Close
Alexandre Borela
4.98 (45)
이 프로젝트를 좋아한다면 5 스타 리뷰를 남겨주세요. 이 지표는 열리고, 높은, 낮은 및 마감 가격을 지정합니다. 기간과 그것은 특정한 시간대를 위해 조정될 수 있습니다. 이들은 많은 기관 및 전문가에 의해 보는 중요한 수준입니다 상인은 당신이 더 많은 것일 수있는 장소를 알고 도움이 될 수 있습니다 이름 * 사용 가능한 기간: 이전 날. 이전 주. 지난 달. 이전 분기. 이전 연도. 또는: 현재 날. 현재 주. 현재 달. 현재 분기. 현재 년.
FREE
Pivot Point Fibo RSJ
JETINVEST
4.41 (22)
피봇 포인트 Fibo RSJ는 피보나치 비율을 사용하여 당일의 지지선과 저항선을 추적하는 지표입니다. 이 멋진 지표는 피보나치 비율을 사용하여 피벗 포인트를 통해 최대 7단계의 지지와 저항을 생성합니다. 가격이 작업의 가능한 진입/종료 지점을 인식할 수 있는 이 지원 및 저항의 각 수준을 어떻게 존중하는지 환상적입니다. 특징 최대 7단계 지원 및 7단계 저항 레벨의 색상을 개별적으로 설정 입력 피벗 유형 피벗 피보 RSJ1 = 피보 비율 1 계산 피벗 피보 RSJ2 = 피보 비율 2 계산 피벗 Fibo RSJ3 = Fibo 비율 3 계산 피벗 피보 클래식 = 클래식 피벗 계산 최소 피벗 수준 피벗 3 레벨 피벗 4 레벨 피벗 5 레벨 6단계 피벗 피벗 7 레벨 여전히 질문이 있는 경우 다이렉트 메시지로 저에게 연락하십시오: https://www.mql5.com/ko/users/robsjunqueira/
FREE
RBM Delta Gold
Renato Brendim Medici
5 (1)
Gold does not move only because of price. It moves because of aggression, imbalance, and market flow. The Delta Indicator was created to reveal exactly that. The RBM Trader Delta Indicator for XAUUSD identifies the difference between aggressive buyers and sellers, helping traders detect real market pressure before the movement becomes obvious on the chart. While most traders focus only on candles, Delta shows what is happening behind price action. This indicator was specially developed for
FREE
VolumeBasedColorsBars
Henrique Magalhaes Lopes
VolumeBasedColorsBars — Free Powerful Volume Analysis for All Traders Unlock the hidden story behind every price bar! VolumeBasedColorsBars is a professional-grade, 100% FREE indicator that colorizes your chart candles based on real, adaptive volume analysis. Instantly spot surges in market activity, identify exhaustion, and catch the moves that matter. This indicator gives you:    • Dynamic color-coded bars for instant volume context    • Adaptive thresholds based on historical, session-awar
FREE
MACD Colored ZeroLag
Farzin Sadeghi Bonjar
4.73 (11)
It is the MQL5 version of zero lag MACD that was available for MT4 here: https://www.mql5.com/en/code/9993 Also there was a colored version of it here but it had some problems: https://www.mql5.com/en/code/8703 I fixed the MT4 version which has 95 lines of code. It took me 5 days to write the MT5 version.(reading the logs and testing multiple times and finding out the difference of MT5 and MT4!) My first MQL5 version of this indicator had 400 lines of code but I optimized my own code again and n
FREE
Fibomathe
Almaquio Ferreira De Souza Junior
Fibomathe Indicator: Support and Resistance Tool for MT5 The Fibomathe Indicator is a technical analysis tool designed for MetaTrader 5 (MT5) that assists traders in identifying support and resistance levels, take-profit zones, and additional price projection areas. It is suitable for traders who use structured approaches to analyze price action and manage trades. Key Features Support and Resistance Levels: Allows users to define and adjust support and resistance levels directly on the chart.
FREE
Apex Point
Marco Engstermann
Apex Point is a trend-following indicator for MetaTrader 5, transforming complex market data into signals for traders. It displays blue dots for uptrends, red dots for downtrends, and yellow crosses at potential reversals, helping users identify momentum shifts quickly. Key features include a confirmation system requiring multiple bars (default: 3) to validate changes, reducing false signals; dynamic ATR-based offsets for adaptive trailing, with instant ratcheting in the trend direction and smo
FREE
Friend of the trend
Anderson De Assis
Friend of the Trend: Your Trend Tracker Master the market with Friend of the Trend , the indicator that simplifies trend analysis and helps you identify the best moments to buy, sell, or wait. With an intuitive and visually striking design, Friend of the Trend analyzes price movements and delivers signals through a colorful histogram: Green Bars : Signal an uptrend, indicating buying opportunities. Red Bars : Alert to a downtrend, suggesting potential selling points. Orange Bars : Represent cons
FREE
Эксперт  MACD_LevelTrader MT5   создан для торговле валютной пары XAUUSD. Данная версия это наработки того, что можно извлечь  из  индикатора MACD и Moving Average.  Важно   перед тестированием изменить настройку с 1000 на 5000                       Offset in points UP from SMA200 for sell              5000                       Offset in points DOWN from SMA200 for buy        5000   Тайм фрейм  М5. Два варианта логики, П араметр  true=вход по уровню  MACD +   SMA200, false=вход по MACD  Тестиру
FREE
Pivot Points Indicator – a fast, reliable, and fully customizable pivot detection for MetaTrader 5. This indicator uses MetaTrader’s native iHighest and iLowest functions to identify pivot highs and lows by scanning for the highest and lowest prices within a user-defined window of bars. A pivot is confirmed only when the current bar is the absolute maximum or minimum within the selected range, ensuring accurate and timely signals based on robust built-in logic. Key Features No Repainting : Onc
FREE
Free automatic Fibonacci is an indicator that automatically plots a Fibonacci retracement based on the number of bars you select on the BarsToScan setting in the indicator. The Fibonacci is automatically updated in real time as new highest and lowest values appears amongst the selected bars. You can select which level values to be displayed in the indicator settings. You can also select the color of the levels thus enabling the trader to be able to attach the indicator several times with differe
FREE
Donchian Breakout And Rsi
Mattia Impicciatore
4.5 (2)
개요 이 지표는 클래식 돈치안 채널(Donchian Channel) 의 향상된 버전으로, 실전 트레이딩을 위한 다양한 기능이 추가되었습니다. 표준 세 개의 선(상단, 하단, 중앙선) 외에도 브레이크아웃 을 감지하여 차트에 화살표로 시각적으로 표시하며, 차트를 깔끔하게 보기 위해 현재 추세 방향의 반대 라인만 표시 합니다. 지표 기능: 시각적 신호 : 브레이크아웃 시 컬러 화살표 표시 자동 알림 : 팝업, 푸시 알림, 이메일 RSI 필터 : 시장의 상대 강도를 기반으로 신호 검증 사용자 맞춤 설정 : 색상, 선 두께, 화살표 코드, RSI 임계값 등 동작 원리 돈치안 채널은 다음을 계산합니다: 상단선 : 최근 N개의 종가 완료 캔들에서 가장 높은 고가 하단선 : 최근 N개의 종가 완료 캔들에서 가장 낮은 저가 중앙선 : 고가와 저가의 평균값 상방 브레이크아웃 은 종가가 상단선을 돌파할 때 발생하며, 하방 브레이크아웃 은 종가가 하단선 아래로 내려갈 때 발생합니다. 이 지표는: 세 개의
FREE
Prometheus Analyst
Humphrey Mangera
PROMETHEUS TECHNICAN VERSION Free | By THE SONS A gift from The Sons — no strings, no trial, no expiry. Every trader deserves access to professional-grade market intelligence. That belief is why Prometheus Technical Version exists, and why it costs nothing. Consider it our handshake to the trading community. What You're Getting This is not a simplified tool dressed up as a gift. Prometheus Technican Version is a fully built, institutional-quality technical analysis indicator running a dual-model
FREE
Volume profile CVD Frato
Francisco Felipe Alves Da Silva Rocha
5 (2)
Frato Volume Profile Pro v7.5 Frato Academy 개발 이 지표는 MetaTrader 5용 가격-거래량 프로필을 표시합니다. 설정 가능한 기간 동안 가격 레벨별 거래량 분포를 계산하고 결과를 메인 차트에 직접 표시합니다. 주요 기능: 색상 그라데이션을 사용한 거래량 프로필 이 지표는 가격 범위를 레벨로 나누고 각 레벨에 해당하는 거래량을 할당합니다. 각 레벨의 색상은 거래량에 따라 연속적인 그라데이션으로 변합니다. 낮은 거래량 레벨은 차가운 색조(진한 파란색)를, 높은 거래량 레벨은 따뜻한 색조(노란색)를 나타냅니다. 최고 거래량 레벨인 POC(Point of Control)는 시각적으로 강조 표시됩니다. 참조선: POC, VAH, VAL 이 지표는 자동으로 세 개의 수평선을 그립니다. - POC(Point of Control): 최고 거래량 레벨 - VAH(Value Area High): 가치 영역의 상한선 - VAL(Value Area Low
FREE
The   OHLC indicator   shows the current and historical values of High, Low, Open, Close and Mid for a specific time period. It can plot the current values or the values from the previous session. The indicator's range can be calculated from a daily, weekly, monthly, or user-specified session. Levels High  of the current or previous session. Low  of the current or previous session. Open  of current or previous session. Close  of the current or previous session. Midpoint  of the current or prev
FREE
Dynamic Pivot Zones
Vincent Jose Proenca
Dynamic Pivot Zones – Your Level Assistant on the Chart This indicator is a bit like a GPS for your trading . It shows you where the price likes to hang out, where it gets nervous, and where it flies through. No more calculating pivots by hand or guessing support and resistance levels. What it does: Automatically plots H1, H4, and D1 pivots . Shows support and resistance zones : R1, R2, S1, S2. Lines are colored and easy to read , so you can instantly see what’s hot or cold. Why you’ll love it:
FREE
MSX Hybrid Heiken Scalper
Som Prakash Gehlot
5 (1)
MSX Hybrid Heiken Scalper Overview MSX Hybrid Heiken Scalper is a MetaTrader 5 indicator based on a modified Heiken Ashi methodology with closed-bar smoothing. The indicator is designed to display trend direction through color-coded candles while reducing sensitivity to short-term market fluctuations. All calculations are performed using completed candles, allowing historical values to remain fixed after bar close. Features • Modified Heiken Ashi calculation • Closed-bar processing • Color-code
FREE
LT Donchian Channel
Thiago Duarte
4.86 (7)
Donchian Channel is an indicator created by Richard Donchian. It is formed by taking the highest high and the lowest low of the last specified period in candles. The area between high and low is the channel for the chosen period. Its configuration is simple. It is possible to have the average between the upper and lower lines, plus you have alerts when price hits one side. If you have any questions or find any bugs, please contact me. Enjoy!
FREE
Pin Bars MT5
Yury Emeliyanov
Main purpose:   "Pin Bars"   is designed to automatically detect pin bars on financial market charts. A pin bar is a candle with a characteristic body and a long tail, which can signal a trend reversal or correction. How it works:   The indicator analyzes each candle on the chart, determining the size of the body, tail and nose of the candle. When a pin bar corresponding to predefined parameters is detected, the indicator marks it on the chart with an up or down arrow, depending on the directi
FREE
Trade Behavior Mirror는 오직 자신의 계좌에서 이미 청산된 거래 이력만 읽어서, 손실이 확정된 직후에 평소보다 큰 랏으로 새 포지션을 여는 패턴 하나만을 셉니다. 이 도구는 아무것도 예측하지 않고 아무런 조언도 하지 않습니다. 패널에 나오는 모든 숫자는 이 계좌에서 이미 일어난 일입니다. 숫자가 만들어지는 방식: 모든 종목과 모든 매직 넘버를 대상으로 최대 31일치 청산된 거래를 읽습니다 - 이는 차트의 종목만이 아니라 계좌 전체에 대한 그림입니다. 오늘 이전 30일 동안의 일별 신규 진입 건수의 중앙값과, 그 진입들의 랏 크기 중앙값을 계산합니다. 평균이 아니라 중앙값을 쓰는 이유는, 유난히 큰 거래 하나가 전체 기준을 왜곡하지 않도록 하기 위해서입니다. 이 30일 구간 안에 진입이 5건 미만이면 공정한 기준을 세우기에 이력이 충분하지 않다고 보고, 너무 적은 데이터로 만든 숫자 대신 "Collecting history"를 표시합니다. 핵심 집계는 패널에서 En
FREE
RBM Smc
Renato Brendim Medici
RBM SMC Liquidity Hunter MT5 — Institutional Structure and Liquidity Indicator   The RBM SMC Liquidity Hunter is a professional tool developed to map Smart Money Concepts (SMC) dynamics directly on your charts. The indicator tracks market structure breaks, validates supply and demand zones using price displacement, and detects liquidity sweeps confirmed by volume, integrating all confluences into an executive on-chart dashboard.   Key Features  Market Structure Mapping (BOS / CHoCH): Automatic
FREE
Curver Arrows
Francis Dube
3.75 (4)
This indicator is a straight port of a well known MetaTrader 4 indicator that is freely available on the Internet. It does not redraw at all. It implements a type of breakout strategy. The arrows indicate market direction. Use the indicator on M15 charts and higher. The indicator draws two bands near price action and generates signals when the price closes below the lower band and also above the upper band. The indicator uses periodic highs and lows to calculate upper and lower threshold bands.
FREE
Calmer chart context, kept practical Northstar Flow Candles MT5 is a chart-window indicator that presents Heikin Ashi candles with a five-state trend context. It is designed for traders who want a quieter view of price while keeping the native chart available as an optional reference. Visual-only indicator: Northstar Flow Candles MT5 does not place trades and does not send popup, push, or email notifications. What appears on the chart Five candle states: strong bullish, bullish, balanced, bearis
FREE
Show Pips for MT5
Roman Podpora
4.5 (32)
이 정보 표시기는 계정의 현재 상황을 항상 알고 싶어하는 사람들에게 유용합니다. VERSION MT 4 -   More useful indicators 표시기는 포인트, 백분율, 통화 단위의 이익뿐만 아니라 현재 쌍의 스프레드와 현재 기간에서 막대가 마감될 때까지의 시간과 같은 데이터를 표시합니다. 차트에 정보선을 배치하는 데는 여러 가지 옵션이 있습니다. 가격 오른쪽(가격보다 뒤에 있음) 코멘트(차트의 왼쪽 상단) 화면의 선택된 모서리에 있습니다. 정보 구분 기호를 선택할 수도 있습니다. | / \ # 이 표시기는 사용하기 쉽고 매우 유익합니다. 설정에서 불필요한 정보 항목을 비활성화할 수 있습니다. 설정 외모의 종류       - 정보 라인 표시 유형. 세 가지 옵션이 있습니다: 가격을 따르세요       - 가격을 따르세요. 댓글로       - 코멘트로; 화면의 선택된 모서리에서       - 화면의 선택한 모서리에 있습니다. 첨부용 그래프 코너       - 화면의 선택한
FREE
MTF Lines PRO
Renato Fiche Junior
3 (2)
This indicator was developed to support multiple timeframe analysis. In the indicator settings, the user can set the color, width, and style of the horizontal lines for each timeframe. This way, when the horizontal lines are inserted into the chart, they will be plotted with the timeframe settings. MTF Lines also allows visibility control of another objets like rectangles, trend lines and texts. This is a product developed by Renato Fiche Junior and available to all MetaTrader 4 and 5 users!
FREE
MACD Enhanced
Nikita Berdnikov
4 (4)
Introducing the MACD  Enhanced – an advanced MACD (Moving Average Convergence Divergence) indicator that provides traders with extended capabilities for trend and momentum analysis in financial markets. The indicator uses the difference between the fast and slow exponential moving averages to determine momentum, direction, and strength of the trend, creating clear visual signals for potential entry and exit points. Attention! To achieve the best results, it is recommended to adapt the indicator
FREE
PZ Penta O MT5
PZ TRADING SLU
3.8 (5)
The Penta-O is a 6-point retracement harmonacci pattern which usually precedes big market movements. Penta-O patterns can expand and repaint quite a bit. To make things easier this indicator implements a twist: it waits for a donchian breakout in the right direction before signaling the trade. The end result is an otherwise repainting indicator with a very reliable trading signal. The donchian breakout period is entered as an input. [ Installation Guide | Update Guide | Troubleshooting | FAQ | A
FREE
This indicator is an automated version of the Fibonacci retracement (Fib) indicator. Deciding the best areas to use when drawing the fib can be tricky and this  indicator was made with that in mind. When you drop it on the chart it will automatically choose the best points to draw the fib with, but in case you aren't satisfied with those regions, you can adjust it as you wish.
FREE
Trendline mt5 indicator
David Muriithi
4 (2)
Are you tired of drawing trendlines every time you're analyzing charts? Or perhaps you would like more consistency in your technical analysis. Then this is for you. This indicator will draw trend lines automatically when dropped on a chart. How it works Works similar to standard deviation channel found on mt4 and mt5. It has 2 parameters: 1. Starting Bar 2. Number of bars for calculation The   starting bar   is the bar which drawing of the trend lines will begin, while the   number of bars for c
FREE
Exact Neuron Genuine Algo Genius Engaged
Toha Arekaatera Akutina Gage
3.8 (5)
!! THE FIRST FREE NEURAL NETWORK EA WITH EXCELLENT AND REALISTIC RESULTS.!! Another beautiful work of art, guys you don't know the powerful creations that are created by my developer Nardus Van Staden. Check him out guys and gals, he is the real deal, an amazing person and a professional when it comes to coding and business, if you want work done!, hit him up! you can get in contact with him HERE . THE FOLLOWING PRODUCT IS A FREE VERSION OF A PAID VERSION THAT IS TO COME, PROFITS ARE GOING TO B
FREE
이 제품의 구매자들이 또한 구매함
SMART TREND TRADING SYSTEM — 특별 혜택 트레이딩 시스템, 자동매매 EA, 교육과 지원을 하나로. MT5용 Smart Trend Trading System을 99 USD에 구매하고, 시스템의 신호를 자동매매에 활용할 수 있는 Smart Universal Expert Advisor를 무료로 받으세요 . STTS는 추세 방향, 진입·청산 신호, 반전 구간, 주요 가격 수준을 차트에 모아 보여줍니다. 시스템을 참고해 수동으로 거래하거나, 포함된 EA를 연결하여 선택한 설정에 따라 자동으로 거래를 실행할 수 있습니다. 현재 가격인 99 USD는 앞으로 이루어지는 30건의 구매에 적용됩니다. 이후 가격은 149 USD로 인상됩니다. 전체 패키지 구성 구매 시 다음 항목이 포함됩니다. • MT5용 Smart Trend Trading System. • Smart Universal Expert Advisor — 무료. • 전체 STTS PDF 사용자 설명서. • STTS
Trend Sniper X
Sarvarbek Abduvoxobov
4.9 (39)
Trend Sniper X 는 트레이더가 추세 방향과 잠재적 반전 지점을 명확하고 정확하게 포착할 수 있도록 도와주는 MetaTrader 5용 멀티 타임프레임 추세 추종 지표입니다. MT4용: https://www.mql5.com/en/market/product/193245 가격 정보: 현재 가격은 프로모션 할인가이며, 향후 업데이트 및 새로운 기능이 출시됨에 따라 변동될 수 있습니다. 보너스 혜택: 본 지표 전용 무료 자동매매 Assistant EA를 받으시려면 구매 후 작성자에게 메시지를 보내주시기 바랍니다. Code2Profit 채널 멀티 타임프레임 분석으로 시장을 마스터하세요! Trend Sniper X로 승률을 극대화하는 방법: 핵심 규칙 및 세션 팁 기술 사양 플랫폼 MetaTrader 5 지표 유형 멀티 타임프레임 추세 지표 운용 타임프레임 모든 차트 타임프레임 지원, 독립적으로 선택 가능한 상위 타임프레임(M1–MN1) 주요 상품 외환, 금(XAUUSD) 및 기타 C
Neuro Poseidon MT5
Daria Rezueva
4.75 (52)
Neuro Poseidon is a new indicator by Daria Rezueva. It combines precise trading signals with adaptive TP/SL levels - creating best possible trades as a result! Message me and get  Neuro Poseidon Assistant  as a gift to automize your trading process! What makes it stand out? 1. Proven profitability on all assets and timeframes 2. Only confirmed BUY and SELL signals present on the chart 3. Adaptive TP & SL levels generated by the software for each trade 4. Easy to understand - suitable for al
Zoryk Gold
Reda El Koutbane
5 (12)
ZORYK — MetaTrader 5용 XAUUSD 전문 신호 및 트레이드 플래닝 시스템 이런 경험이 있을 것입니다. 골드를 분석하고 진입을 기다린 뒤 마침내 포지션을 열었지만 가격이 곧바로 반대 방향으로 움직입니다. 너무 일찍 청산하거나 Stop Loss를 옮기거나 몇 초 동안 망설입니다. 그 후 시장은 내가 없이도 처음 예상했던 목표까지 정확히 움직입니다. 문제는 항상 방향이 아니었습니다. 진짜 문제는 불확실성이었습니다. 정확한 진입 위치를 몰랐습니다. 어느 지점에서 원래의 트레이드 아이디어가 무효가 되는지 몰랐습니다. 가까운 수익을 확보해야 할지 더 큰 움직임을 기다려야 할지 판단하기 어려웠습니다. 현재 setup이 정말 강한지 아니면 단지 새로운 거래를 억지로 찾고 있는지도 확신하기 어려웠습니다. 골드는 매우 빠르게 움직입니다. 명확한 계획이 없다면 좋은 분석도 몇 초 만에 나쁜 결정으로 바뀔 수 있습니다. ZORYK는 이 문제를 해결하기 위해 개발되었습니다.
SuperScalp Pro
Van Minh Nguyen
4.65 (34)
SuperScalp Pro - Professional Multi-Layer Confluence Scalping System SuperScalp Pro는 클래식 Supertrend에 여러 지능형 확인 필터를 추가한 고급 스캘핑 지표입니다. 더 높은 확률의 Buy/Sell 거래 기회를 식별하는 데 도움을 주며, 잘못된 신호를 크게 줄이는 데 도움을 줍니다. 명확한 Buy 및 Sell 화살표가 차트에 직접 표시되며, ATR 기반 Stop Loss 및 Take Profit 수준이 실시간으로 자동 계산됩니다. 구매 후 설정 방법 및 권장 구성에 대한 안내가 필요하시면 저에게 문의해 주세요. SuperScalp Pro Auto Trader를 사용하여 신호를 쉽게 자동화할 수 있습니다: [Auto Trader] 권장 설정 파일 다운로드: [Set File] 전체 문서는 제품 블로그에서 확인할 수 있습니다: [User Guide] 업데이트를 확인하려면 공식 채널에 참여하세요: [Official C
M1 Sniper MT5
Oleg Rodin
5 (7)
M1 SNIPER 는 사용하기 쉬운 거래 지표 시스템입니다. M1 시간대에 맞춰 설계된 화살표 지표입니다. 이 지표는 M1 시간대 스캘핑을 위한 단독 시스템으로 사용할 수 있으며, 기존 거래 시스템의 일부로도 사용할 수 있습니다. 이 거래 시스템은 M1 시간대 거래용으로 특별히 설계되었지만, 다른 시간대에도 사용할 수 있습니다. 원래는 XAUUSD와 BTCUSD 거래를 위해 이 방법을 설계했지만, 다른 시장 거래에도 유용하다는 것을 알게 되었습니다. 이 지표의 신호는 추세 방향과 반대로 거래될 수 있습니다. 저는 지표의 신호를 활용하여 양방향으로 거래할 수 있도록 돕는 특별한 거래 기법을 알려드립니다. 이 방법은 특별한 동적 지지선과 저항선 가격 영역을 활용하는 것을 기반으로 합니다. 구매하시면 M1 SNIPER 화살표 지표를 바로 다운로드하실 수 있습니다. 또한, 아래 스크린샷에 표시된 Apollo Dynamic SR 지표는 M1 SNIPER 도구를 사용하는 모든 사용자에게 무료로
Gann Made Easy MT5
Oleg Rodin
5 (10)
Gann Made Easy 는 mr.의 이론을 사용하여 최고의 거래 원칙을 기반으로 하는 전문적이고 사용하기 쉬운 Forex 거래 시스템입니다. W.D. 간. 이 표시기는 Stop Loss 및 Take Profit Levels를 포함하여 정확한 BUY 및 SELL 신호를 제공합니다. PUSH 알림을 사용하여 이동 중에도 거래할 수 있습니다. 구매 후 거래 방법 안내 및 유용한 추가 지표를 무료로 받으시려면 저에게 연락주세요! 아마도 Gann 거래 방법에 대해 이미 여러 번 들었을 것입니다. 일반적으로 Gann의 이론은 초보자 거래자뿐만 아니라 이미 거래 경험이 있는 사람들에게도 매우 복잡한 것입니다. Gann의 거래 방식은 이론적으로 적용하기 쉽지 않기 때문입니다. 나는 그 지식을 연마하고 Forex 지표에 최고의 원칙을 적용하기 위해 몇 년을 보냈습니다. 표시기는 적용하기가 매우 쉽습니다. 차트에 첨부하고 간단한 거래 권장 사항을 따르기만 하면 됩니다. 지표는 지속적으로 시장 분석
SMC Intraday Formula
Kareem Abbas
5 (25)
먼저 솔직하게 말하겠습니다. 어떤 인디케이터도 단독으로 당신을 수익성 있게 만들어주지 않습니다. 누군가 그렇게 말한다면, 그는 당신에게 꿈을 파는 것입니다. 완벽한 매수/매도 화살표를 보여주는 모든 인디케이터는 완벽하게 보이도록 만들 수 있습니다 — 단지 올바른 과거 구간을 확대하고 승리한 거래만 캡처하면 됩니다. 우리는 그렇게 하지 않습니다.  SMC Intraday Formula는 도구입니다. 시장 구조를 읽고, 가장 높은 확률의 가격 구간을 표시하며, 현재 스마트 머니의 흐름이 어떻게 보이는지 아주 단순한 언어로 보여줍니다. 최종 결정은 여전히 당신이 합니다. 실행도 당신이 합니다. 하지만 이제는 희망이 아니라 정확성으로 거래하게 됩니다. 우리는 이 인디케이터를 지난 약 3년 동안 골드(XAUUSD) 및 주요 외환 통화쌍의 데이 트레이딩 스캘핑에 사용해 왔습니다. M1, M5, M15, M30에서 우리의 핵심 도구입니다. 이 도구는 미래를 예측하려 하지 않습니다 — 지금 형성
Unix Scalper
Issam Kassas
4 (4)
UNIX SCALPER — 특별 혜택 매매 기회를 찾고, 거래 계획을 확인하고, 실행 방법을 선택하세요. MT5용 UNIX Scalper를 99 USD에 구매하면 신호 자동매매에 사용할 수 있는 Smart Universal Expert Advisor를 무료로 받으실 수 있습니다. UNIX Scalper는 시장 분석, BUY/SELL/WAIT 판단, Entry, Stop Loss, TP1 및 TP2 가격 수준을 하나의 정돈된 패널에 제공합니다. 거래 계획에 따라 수동으로 매매하거나, 포함된 EA를 연결하여 선택한 설정에 따라 자동으로 실행할 수 있습니다. 현재 가격인 99 USD는 앞으로 30건의 구매에 적용됩니다. 이후 가격은 149 USD로 인상됩니다. 전체 패키지 구성 구매 시 다음 항목이 포함됩니다. • MT5용 UNIX Scalper. • Smart Universal Expert Advisor — 무료. • UNIX Scalper 전체 PDF 사용자 매뉴얼. • UNIX
Entry Points Pro for MT5
Yury Orlov
4.52 (151)
전설이 돌아왔습니다: Entry Points Pro 10. MQL5 마켓 Top-3 자리를 3년간 지켜온 전설적인 지표의 재출시입니다. 수백 개의 호평 리뷰(두 버전 합산 589개), 매일 이 지표로 거래하는 수천 명의 트레이더, 31,000회 이상의 데모 다운로드   MT4+MT5 . 지난 5년간 여러분이 남긴 리뷰를 하나도 빠짐없이 읽었고, 약속 대신 그 답을 버전 10에 담았습니다. 1999년부터 시장에서 활동하며 정직함과 자신의 평판, 그리고 고객을 소중히 여기는 개발자가 만들었습니다. Entry Points Pro의 진입 시그널은 절대 리페인팅되지 않습니다. 그리고 이번에는 개발자의 말뿐이 아니라 검증 가능한 사실입니다: 확정 시그널은 캔들 종가에서만 표시되며, 자동화 테스트에서 리페인팅 0건 이 확인되었습니다(EURUSD, XAUUSD, BTCUSD에서 2,486,568회의 불변조건 검사 — 위반 0건). 검증 방법은 공개되어 있으니 전략 테스터에서 직접 재현해 보실 수
GoldenX Entry MT5
Kareem Abbas
5 (16)
GoldenX Entry는 MT5용 인디케이터로, 적응형 Smart Entry Trend 알고리즘, 신호 스코어링 시스템, 시장 레짐 감지 기능, 그리고 변동성 필터를 포함합니다. 각 신호에는 계산된 진입 레벨, 3개의 익절(TP1, TP2, TP3) 레벨, 그리고 손절(Stop-Loss) 레벨이 포함됩니다. 이 인디케이터는 다양한 시장 환경에 적응하도록 설계된 다중 분석 레이어 구조 위에 구축되어 있으며, 내장 최적화기와 통계 추적 시스템을 결합합니다. 또한 Risk-to-Reward(RR) 지표와 과거 거래 행동 기반의 정량 분석을 제공합니다. 시작은 간단합니다 — 선택한 타임프레임에서 최적화기를 실행한 뒤 차트에서 바로 인디케이터를 사용하면 됩니다. 핵심 기능 GoldenX Entry는 하나의 차트에서 신호 엔진, 트레이드 관리 기능, 그리고 과거 통계 추적을 통합합니다: - 내장 최적화기: 최적화기는 차트에서 원클릭으로 실행됩니다. 200개의 파라미터 조합을 두 단계 탐색
Reversion King Indicator
Eugen-alexandru Zibileanu
5 (9)
새로운 왕의 등장 - 인디케이터 + 주문 관리 표시(TP1 + TP2 + TP3) + 선택형 텔레그램 시그널 전송 기능 포함 (무료) (완전한 트레이딩 및 시그널 시스템) 골드를 위한 최고의 EA: Gold Slayer 이 인디케이터는 고급 전략, 사용자 지정 가능한 주문 관리 시스템, 그리고 엔벨로프 확장을 결합한 평균 회귀(mean reversion) 시스템을 포함하고 있습니다. 또한 RSI와 같은 여러 지능형 확인 필터를 통해 높은 확률의 반전 진입 구간을 포착하여 BUY 및 SELL 시그널을 제공합니다. 단순히 거래 방법만 배우는 것이 아니라, 여러 포지션을 효과적으로 관리하고 이전에 수익 중인 오픈 포지션으로 손실 거래를 커버하는 방법까지 익힐 수 있습니다. M5 전용으로 설계 및 최적화되었으며, 유동성이 풍부해 시그널이 더 깔끔하고 신뢰도 높은 BTCUSD와 XAUUSD에서 뛰어난 성능을 발휘합니다. 이 인디케이터는 ATR 기반으로 자동 계산된 진입가, 손절가, 익절가와
Gold Entry Sniper
Tahir Mehmood
5 (20)
Gold Entry Sniper – 골드 스캘핑 & 스윙 트레이딩을 위한 전문 다중 시간 프레임 ATR 대시보드 Gold Entry Sniper 는 XAUUSD 및 기타 종목에 대해 정확한 매수/매도 신호 를 제공하는 고급 MetaTrader 5 지표입니다. ATR 트레일링 스톱 로직 과 다중 시간 프레임 분석 을 기반으로 설계되어 스캘핑과 스윙 트레이딩 모두에 적합합니다. 주요 기능 및 장점 다중 시간 프레임 분석 – M1, M5, M15 추세를 한눈에 확인. ATR 기반 트레일링 스톱 – 변동성에 따라 자동 조정. 전문 차트 대시보드 – 신호 상태, ATR 레벨, 회귀선, 매매 방향 표시. 명확한 매수/매도 마커 – 자동 화살표와 텍스트 라벨. 종료 알림 & 거래 관리 – 수익 보호를 위한 자동 종료 감지. 완전 사용자 설정 가능 – 대시보드 위치, 색상, ATR/회귀선 파라미터 조정. 골드(XAUUSD) 최적화 – M1~M15 스캘핑에 완벽, 외환/지수/암호화폐에도 적용 가능.
Market Structure Order Block Dashboard MT5는 시장 구조와 주요 가격 반응 구역을 차트에서 직접 읽고자 하는 트레이더를 위해 설계된 MT5 지표입니다. BOS, ChoCH, 오더 블록, Fair Value Gap (FVG), 유동성, Kill Zones, Volume Profile 그리고 빠른 분석을 위한 콤팩트한 대시보드를 결합합니다. 이 지표는 시장 구조, ICT 및 Smart Money 개념을 의사결정 프레임워크로 사용하는 트레이더를 대상으로 합니다. 추세 지속, 가능한 반전, 가격 불균형, 유동성 타겟 및 관심 구역을 보다 체계적으로 식별하는 데 도움을 줄 수 있습니다. 구매자를 위한 포함 리소스 구매 후 MQL5 개인 메시지로 요청하시면 완전한 PDF 사용 설명서와 파라미터 설정 팁을 제공해 드립니다. MQL5 개인 메시지를 통한 직접 기술 지원. 1.20 버전은 두 가지 주요 추가 기능을 제공합니다: Pending BOS / Pending
Welcome to ENTRY IN THE ZONE AND SMC MULTI TIMEFRAME Entry In The Zone and SMC Multi Timeframe is a real-time market analysis tool based on Smart Money Concepts (SMC), designed to analyze market structure, price direction, and key trading zones. It supports both Single-Timeframe Analysis and Multi-Timeframe Analysis, providing a clearer view of the overall market structure across multiple timeframes, with real-time BUY / SELL signals that do not repaint. It is designed to help filter trading opp
Atomic Analyst MT5
Issam Kassas
4.46 (59)
ATOMIC ANALYST — 특별 혜택 시장 분석 도구, 자동매매 EA, 교육과 지원을 하나로. MT5용 Atomic Analyst를 99 USD에 구매하고, 지표의 신호를 자동매매에 활용할 수 있는 Smart Universal Expert Advisor를 무료로 받으세요 . Atomic Analyst는 가격 움직임 분석, 추세 방향, 진입·청산 신호, 손절 수준, 여러 익절 수준을 차트에 모아 보여줍니다. 분석을 참고해 수동으로 거래하거나, 포함된 EA를 연결하여 선택한 설정에 따라 자동으로 거래를 실행할 수 있습니다. 현재 가격인 99 USD는 앞으로 이루어지는 30건의 구매에 적용됩니다. 이후 가격은 149 USD로 인상됩니다. 전체 패키지 구성 구매 시 다음 항목이 포함됩니다. • MT5용 Atomic Analyst. • Smart Universal Expert Advisor — 무료. • 전체 Atomic Analyst PDF 사용자 설명서. • Atomic Ana
Adaptive Price Action Engine 지표를 구매하면 EA(자동매매 프로그램)가 무료 멀티 타임프레임 기반 자기 최적화 추세 & 캔들 패턴 분석 시스템 시장은 끊임없이 변화하며, 모든 Price Action 패턴이 모든 시장 환경에서 동일한 가치를 가지는 것은 아닙니다. Adaptive Price Action Engine 은 변화하는 시장 환경에 적응할 수 있도록 설계되었으며, 추세 구조, 멀티 타임프레임 분석, 캔들 패턴 및 통계적 최적화 를 하나의 분석 프레임워크로 결합합니다. 두 가지 적응형 모드 Dual Alpha Trend Mode 낮은 타임프레임과 높은 타임프레임에서 적합한 Alpha Trend 파라미터를 자동으로 탐색하여, 최근 시장 움직임에 맞춰 추세 분석을 조정합니다. Candlestick + Alpha Mode Alpha Trend를 통한 시장 국면 분석과 22개의 상승 및 하락 캔들 패턴 을 결합합니다. 모든 패턴을 동일하게 취급하는 대신, 다양
Tokyo mt5 Indicator
Vasiliy Strukov
5 (1)
Tokyo Indicator는 추세 방향, 잠재적 거래 신호 및 시장 상황을 명확하고 시각적으로 보여줍니다. 색상으로 구분된 계단식 추세선은 강세 구간(파란색)과 약세 구간(자홍색)을 명확히 구별해 줍니다. 추세가 전환될 때 나타나는 방향성 화살표는 잠재적인 매수 및 매도 기회를 강조하여 보여줍니다. 통합 대시보드는 현재 신호, 시장 성향(bias), 모멘텀, 변동성, 신호 품질 등의 정보를 한눈에 파악할 수 있도록 구성되어 있습니다. 이를 통해 트레이더는 별도의 패널을 오갈 필요 없이 가격 움직임(price action)과 지표의 데이터를 동시에 분석할 수 있습니다. 깔끔한 차트 화면과 간결한 시장 개요를 제공하는 Tokyo Indicator는 체계적인 추세 분석과 거래 결정을 지원합니다. 모든 시간대와 다양한 자산(특히 금)에서 활용할 수 있습니다. 추세 방향, 잠재적 거래 신호 및 시장 상황을 명확하고 시각적으로 보여줍니다. 색상으로 구분된 계단식 추세선은 강세 구간(파란색)
통화 강도 마법사는 성공적인 거래를 위한 올인원 솔루션을 제공하는 매우 강력한 지표입니다. 표시기는 여러 시간 프레임의 모든 통화 데이터를 사용하여 이 또는 해당 외환 쌍의 힘을 계산합니다. 이 데이터는 특정 통화의 힘을 확인하는 데 사용할 수 있는 사용하기 쉬운 통화 지수 및 통화 전력선의 형태로 표시됩니다. 필요한 것은 거래하려는 차트에 표시기를 부착하는 것뿐입니다. 표시기는 거래하는 통화의 실제 강세를 보여줍니다. 지표는 또한 추세와 거래할 때 유리하게 사용할 수 있는 구매 및 판매 거래량 압력의 극한값을 보여줍니다. 지표는 또한 피보나치에 기반한 가능한 대상을 보여줍니다. 표시기는 PUSH 알림을 포함한 모든 유형의 알림을 제공합니다. 구매 후 연락주세요. 나는 당신과 거래 팁을 공유하고 당신에게 무료로 훌륭한 보너스 지표를 줄 것입니다! 나는 당신에게 행복하고 유익한 거래를 기원합니다!
FiboSniper Pro
Van Minh Nguyen
5 (3)
FiboSniper Pro – Multi-Filter Fibonacci System with Auto SL/TP and Control Panel FiboSniper Pro는 동적 Fibonacci Envelopes와 여러 확인 필터를 결합하여 선별된 Buy 및 Sell 신호를 생성하는 기술적 지표입니다. Fibonacci 레벨은 Moving Average와 ATR을 기반으로 계산된 후 ADX, EMA, RSI, ATR, Volume, Time 및 Candle 구조를 통해 필터링됩니다. 이 지표는 ATR 기반의 자동 Stop Loss 및 Take Profit 레벨을 차트에 직접 표시하며, 빠른 설정 조정을 위한 인터랙티브 Control Panel을 제공합니다. 구매 후 권장 설정 파일과 자세한 사용 방법을 받으려면 저에게 문의해 주세요. Auto Trader X를 사용하여 FiboSniper Pro 신호를 자동화할 수 있습니다: [Auto Trader X] User Guide 및 Se
Divergence Bomber
Ihor Otkydach
4.89 (94)
이 지표를 구매하신 분께는 다음과 같은 혜택이 무료로 제공됩니다: 각 거래를 자동으로 관리하고, 손절/익절 수준을 설정하며, 전략 규칙에 따라 거래를 종료하는 전용 도우미 툴 "Bomber Utility" 다양한 자산에 맞게 지표를 설정할 수 있는 셋업 파일(Set Files) "최소 위험", "균형 잡힌 위험", "관망 전략" 모드로 설정 가능한 Bomber Utility의 셋업 파일 이 전략을 빠르게 설치, 설정, 시작할 수 있도록 돕는 단계별 영상 매뉴얼 주의: 위의 모든 보너스를 받기 위해서는 MQL5 개인 메시지 시스템을 통해 판매자에게 연락해 주세요. 독창적인 커스텀 지표인 “Divergence Bomber(다이버전스 봄버)”를 소개합니다. 이 지표는 MACD 다이버전스(괴리) 전략을 기반으로 한 올인원(All-in-One) 거래 시스템입니다. 이 기술 지표의 주요 목적은 가격과 MACD 지표 간의 다이버전스를 감지하고, **향후 가격이 어느 방향으로 움직일지를 알려주
SMART PRICE ACTION CONCEPTS — 특별 혜택 구조를 확인하고, 구간을 파악하고, 거래 계획을 세우세요. MT5용 Smart Price Action Concepts를 49 USD에 구매하면 Smart Universal Expert Advisor를 무료로 받으실 수 있습니다. Smart Money Concepts(SMC), ICT 방식의 분석, 가격 행동 분석을 하나의 정돈된 차트에서 활용하세요. 시장 구조, 오더 블록, 유동성 참고 수준과 불균형을 파악하고, Smart Panel에서 표시할 요소를 선택할 수 있습니다. 현재 가격인 49 USD는 앞으로 30건의 구매에 적용됩니다. 이후 가격은 100 USD로 인상됩니다. 전체 패키지 구성 • MT5용 Smart Price Action Concepts. • Smart Universal Expert Advisor — 무료 보너스. • 전체 PDF 사용자 매뉴얼 및 공식 온라인 강좌. • 단계별 설치 및 설정 안내.
Superhero
Ihor Otkydach
5 (3)
SUPERHERO 지표는 “올인원” 방식으로 설계된 다중 통화 거래 시스템입니다. 이 지표는 시장을 독자적으로 분석하여 포지션을 개설하고 청산할 시점에 대한 신호를 제공합니다. 손절매(Stop Loss) 및 익절(Take Profit) 주문을 활용하며, 위험 대비 수익 비율(R:R)은 1:1입니다. 이 시스템은 스마트폰으로 푸시 알림을 전송할 수 있으므로, PC에 묶여 있을 필요 없이 “이동 중에도” 매매를 할 수 있습니다. 이는 자체 거래 전문 회사에 안성맞춤입니다. 모든 고객님께 드리는 특별 혜택: 이 지표를 구매하시는 모든 분께는 제가 특별히 준비한 유틸리티를 선물로 드릴 예정이며, 이 유틸리티는 다음과 같은 기능을 제공합니다: 손절매 및 익절 주문을 자동으로 설정합니다 가격이 목표 수준에 도달하면 자동으로 포지션을 청산합니다 미결제 주문 거래를 지원합니다 평균화 거래 모드를 지원합니다 이 훌륭하고 매우 편리한 유틸리티를 선물로 받고 싶으시다면, SUPERHERO 지표를 구매하
Volatility Master for MetaTrader is a real-time dashboard tool that scans up to  50 symbols  to identify high-volatility , trending markets instantly. With bullish/bearish signals, customizable alerts, and a user-friendly interface, it helps you avoid range-bound conditions and focus on high-probability trades. Clarity leads to confidence. Trade confidently and protect your capital effectively with this powerful dashboard. We don't offer free or bonus indicators in exchange of reviews from you.
PZ Trend Trading MT5
PZ TRADING SLU
3.8 (5)
Capture every opportunity: your go-to indicator for profitable trend trading Trend Trading is an indicator designed to profit as much as possible from trends taking place in the market, by timing pullbacks and breakouts. It finds trading opportunities by analyzing what the price is doing during established trends. [ Installation Guide | Update Guide | Troubleshooting | FAQ | All Products ] Trade financial markets with confidence and efficiency Profit from established trends without getting whips
Power Candles MT5
Daniel Stein
4.58 (12)
Power Candles V3 - 자체 최적화 강도 지표 파워 캔들 V3는 적용된 모든 차트에서 통화 및 상품의 강세를 실행 가능한 거래 계획으로 전환합니다. 단순히 캔들에 색상을 입히는 대신, 백그라운드에서 실시간 자동 최적화를 수행하여 현재 보고 있는 종목에 대한 최적의 손절매, 익절 및 신호 임계값을 제공합니다. 한 번의 클릭으로 실시간 거래에 적용할 수 있으며, 진입점, 손절매 및 익절 선이 정확한 가격에 맞춰 차트에 표시되고, 방향과 함께 알림이 발령됩니다. 이 도구는 Stein Investments 에코시스템의 일부입니다. 18개 이상의 도구와 함께 당신의 1대1 AI 트레이딩 멘토 Max.  항상 대기 중, 모든 인디케이터를 깊이 있게 이해, 무언가를 차근차근 생각해보고 싶은 순간에 도움을 줍니다.  https://stein.investments 에서 만나보세요 매 종가 바마다 3,000회 이상의 트레이딩 시뮬레이션. 9가지 강도 상태. 2가지 전략을 병렬로 테스트.
IQ FX Gann Levels a precision trading indicator based on W.D. Gann’s square root methods . It plots real-time, non-repainting support and resistance levels to help traders confidently spot intraday and scalping opportunities with high accuracy. William Delbert Gann (W.D. Gann) was an exceptional market analyst, whose trading technique was based on a complex blend of mathematics, geometry, astrology, and ancient mathematics which proved to be extremely accurate. We don't offer free or bonus indic
Trend Catcher ind mt5
Ramil Minniakhmetov
5 (18)
트렌드 캐처 인디케이터 트렌드 캐처 인디케이터는 개발자가 자체 개발한 맞춤형 적응형 트렌드 분석 지표들을 조합하여 시장 가격 움직임을 분석합니다. 단기적인 노이즈를 제거하고 근본적인 모멘텀 강도, 변동성 확대, 가격 구조 움직임에 집중하여 진정한 시장 방향을 파악합니다. 또한 이동 평균, RSI, 변동성 필터와 같은 맞춤형 지표들을 활용하여 가격을 평활화하고 트렌드를 필터링합니다. 실제 운영 모니터링 및 기타 제품은 다음 링크에서 확인하실 수 있습니다:   https://www.mql5.com/en/users/mechanic/seller 텔레그램에서는 EA나 설정 파일을 판매하지 않습니다. 사기이니 주의하세요. 모든 설정 파일은 블로그에서 무료로 제공됩니다. 중요! 구매 후 즉시 연락 주시면 사용 방법 및 보너스를 드립니다!
RelicusRoad Pro MT5
Relicus LLC
4.96 (24)
RelicusRoad Pro: 퀀트 시장 운영 체제 70% 할인 평생 이용권 (한정 시간) - 2,000명 이상의 트레이더와 함께하세요 왜 대부분의 트레이더는 "완벽한" 지표를 가지고도 실패할까요? 진공 상태에서 단일 개념 만으로 거래하기 때문입니다. 문맥 없는 신호는 도박입니다. 지속적인 승리를 위해서는 컨플루언스(중첩) 가 필요합니다. RelicusRoad Pro는 단순한 화살표 지표가 아닙니다. 완전한 퀀트 시장 생태계 입니다. 독점적인 변동성 모델링을 사용하여 가격이 이동하는 "공정 가치 로드"를 매핑하고, 단순 노이즈와 실제 구조적 돌파를 구분합니다. 추측은 그만두세요. 기관급 로드 로직으로 거래를 시작하세요. 핵심 엔진: "Road" 알고리즘 시스템의 중심에는 시장 상황에 실시간으로 적응하는 동적 변동성 채널인 Road Algo 가 있습니다. 세이프 라인(평형) 과 가격이 수학적으로 반전될 가능성이 높은 확장 레벨 을 투영합니다. Simple Road: 일반적인 시장을 위
Axiom Matrix
Issam Kassas
5 (8)
Axiom Matrix — 특별 혜택 Axiom Matrix을 49 미국 달러에 구매하고 Smart Universal Expert Advisor를 무료로 받으세요. 시장을 탐색하세요. 기회를 비교하세요. 다음 차트를 선택하세요. Axiom Matrix는 여러 종목과 시간대의 분석을 하나의 대시보드에 모읍니다. 모든 차트를 따로 확인하지 않고 집중할 시장을 찾으세요. 종합시세 또는 선택한 종목을 여러 시간대에서 탐색. 추세, 모멘텀, 거래량, 변동성 및 시장 품질 정보 비교. Best Axiom Pick, 신호 상태 및 클릭 가능한 셀로 거래 조건 확인. Axiom Matrix는 분석 대시보드이며 거래를 실행하지 않습니다. 패키지 구성 Axiom Matrix Smart Universal Expert Advisor PDF 사용 설명서와 온라인 강좌. 설정 안내와 구매자 커뮤니티 이용 혜택. Smart Universal Expert Advisor는 별도의 보너스입니다. 이 제품의 직접적인
제작자의 제품 더 보기
QuantMatrix Probability AI Free QuantMatrix Probability AI Free is a technical indicator for MetaTrader 5 that combines several measurements of current market conditions into three numerical estimates. The indicator uses exponential moving averages, Relative Strength Index (RSI), Average True Range (ATR) and the current price position in its calculation. These measurements are combined into a normalized market score. The resulting information is displayed on the chart as: BUY percentage SELL p
FREE
QuantMatrix Candle Patterns is a free MetaTrader 5 indicator designed to identify classic candlestick formations directly on the chart. The indicator analyzes completed candles and detects recognized bullish, bearish and neutral price-action patterns. When a valid bullish or bearish formation is confirmed, the corresponding BUY or SELL signal is displayed on the following candle . This means the signal is only generated after the source pattern has been completed. The indicator also displays a c
FREE
QuantMatrix Wick Pressure
Rafael Barreto Haddad
QuantMatrix Wick Pressure QuantMatrix Wick Pressure is a technical indicator for MetaTrader 5 that measures the relationship between upper and lower candlestick wicks and converts this information into a numerical pressure measurement. Candlestick wicks represent price movement that occurred beyond the candle body before price returned from those levels. The indicator measures this rejection behavior over consecutive candles and displays the result in a separate indicator window. Positive values
FREE
QuantMatrix Volatility Regime QuantMatrix Volatility Regime is a technical indicator for MetaTrader 5 that evaluates the current volatility of the selected symbol and timeframe. The indicator uses Average True Range (ATR) to compare current volatility with a historical baseline calculated from previous bars. Based on this comparison, the current market condition is classified into one of four volatility regimes: LOW – current volatility is below the historical baseline. NORMAL – current volatil
FREE
QuantMatrix Probability AI PRO QuantMatrix Probability AI PRO is a technical indicator for MetaTrader 5 designed to evaluate current market conditions and present them as BUY, SELL and NEUTRAL percentage estimates. The indicator combines several market measurements, including trend, momentum, volatility, price position, candlestick wick behavior and breakout conditions. It also compares the current market state with similar historical situations found in the selected symbol and timeframe. The hi
QM Candle Timing Meter
Rafael Barreto Haddad
QM Candle Timing Meter is a free MetaTrader 5 indicator designed to answer one simple question: How late am I in the current candle? A trading signal may still be technically valid while the timing of the entry has already changed significantly. For example, entering during the first minutes of an H1 candle is very different from entering when 90% of that candle has already elapsed. QM Candle Timing Meter continuously measures the temporal position of the current candle and displays this informa
FREE
QuantMatrix FXGold V8
Rafael Barreto Haddad
QuantMatrix FX+Gold V8.4 Adaptive Quantitative Trading for Forex & Gold QuantMatrix FX+Gold V8.4 is an advanced multi-asset Expert Advisor developed for Forex and Gold (XAUUSD) . Instead of relying on a single fixed trading strategy or a conventional combination of indicators, QuantMatrix uses a research-driven architecture designed to discover, validate, rank and continuously monitor multiple trading models derived from the historical behavior of each market. The central idea is simple: The mar
QuantMatrix Candle Exhaustion QuantMatrix Candle Exhaustion is a technical indicator for MetaTrader 5 that identifies candles showing predefined price expansion and wick characteristics. The indicator compares the range of the current candle with the average range of previous candles. When the candle range exceeds the configured historical range threshold, its upper and lower wicks are evaluated. A bullish exhaustion marker can be displayed when an expanded bullish candle also contains the requi
QuantMatrix False Breakout Detector QuantMatrix False Breakout Detector is a technical indicator for MetaTrader 5 that identifies potential failed breakouts of recent price ranges. The indicator calculates the highest high and lowest low within a configurable historical period. It then evaluates whether the current price moves beyond one of these levels by a minimum volatility-adjusted distance and subsequently closes back inside the previous range. Average True Range (ATR) is used to adjust the
QuantMatrix Historical Move Probability QuantMatrix Historical Move Probability is a statistical indicator for MetaTrader 5 that compares the current price movement with similar movements found in the historical data of the selected symbol and timeframe. Price movements are normalized using Average True Range (ATR). This allows movements from different historical periods to be compared relative to the volatility present at each period. The indicator searches the configured historical sample for
QuantMatrix Prism Structure is a MetaTrader 5 indicator for visual analysis of market structure. It identifies confirmed swing highs and swing lows and displays structural information directly on the chart. The indicator can display higher highs, higher lows, lower highs, lower lows, structure changes, fair value gap areas and ATR based information. A chart panel summarizes the current structure state, recent structural events and relevant market information. The indicator is intended for m
QuantMatrix Volume Depth
Rafael Barreto Haddad
QuantMatrix Volume Depth is a MetaTrader 5 indicator for visual analysis of market activity across different price levels. The indicator builds a horizontal profile across the analyzed price range and shows where trading activity has been concentrated. It displays the Point of Control, Value Area High, Value Area Low and the distribution of activity across multiple price levels. The indicator can use real volume when it is available from the symbol. When real volume is not available, tick vol
필터:
str8derx
79
str8derx 2026.09.03 15:03 
 

사용자가 평가에 대한 코멘트를 남기지 않았습니다

리뷰 답변