PulseAlgo
- Индикаторы
-
Hicham Mahmoud Almoustafa
 Certainly, it seems that you are interested in the field of forex and want to direct this interest towards examining the work of experts in the field. This interest reflects a desire to learn and develop skills in a specific area and a drive to master it well. Additionally, studying the work of
 - Версия: 4.10
PulseAlgo v4 — Smart Signal Indicator for MetaTrader 5
Overview
PulseAlgo is a professional-grade chart indicator designed for traders who demand clean, high-probability signals without the guesswork. The toolkit combines multiple layers of analysis into a single, unified system that adapts automatically to whatever timeframe you trade.
Every signal on your chart has been filtered through a multi-stage confirmation engine. No single indicator triggers an entry alone. Instead, the system requires agreement across trend, momentum, and strength analysis before plotting any arrow. The result is fewer signals, but significantly higher quality.
All internal parameters have been pre-optimized per timeframe through extensive quantitative testing across thousands of market conditions. You do not need to adjust or configure anything — simply attach the indicator and trade.
What Makes PulseAlgo Different
Most indicators give you one thing: a line, an arrow, or a histogram. PulseAlgo gives you a complete visual trading environment.
Signal Quality Over Quantity
The built-in confirmation engine eliminates the majority of false signals before they reach your chart. Every entry arrow you see has already passed through multiple independent checks that must all agree on direction. This means you spend less time filtering noise and more time executing.
True Multi-Timeframe Awareness
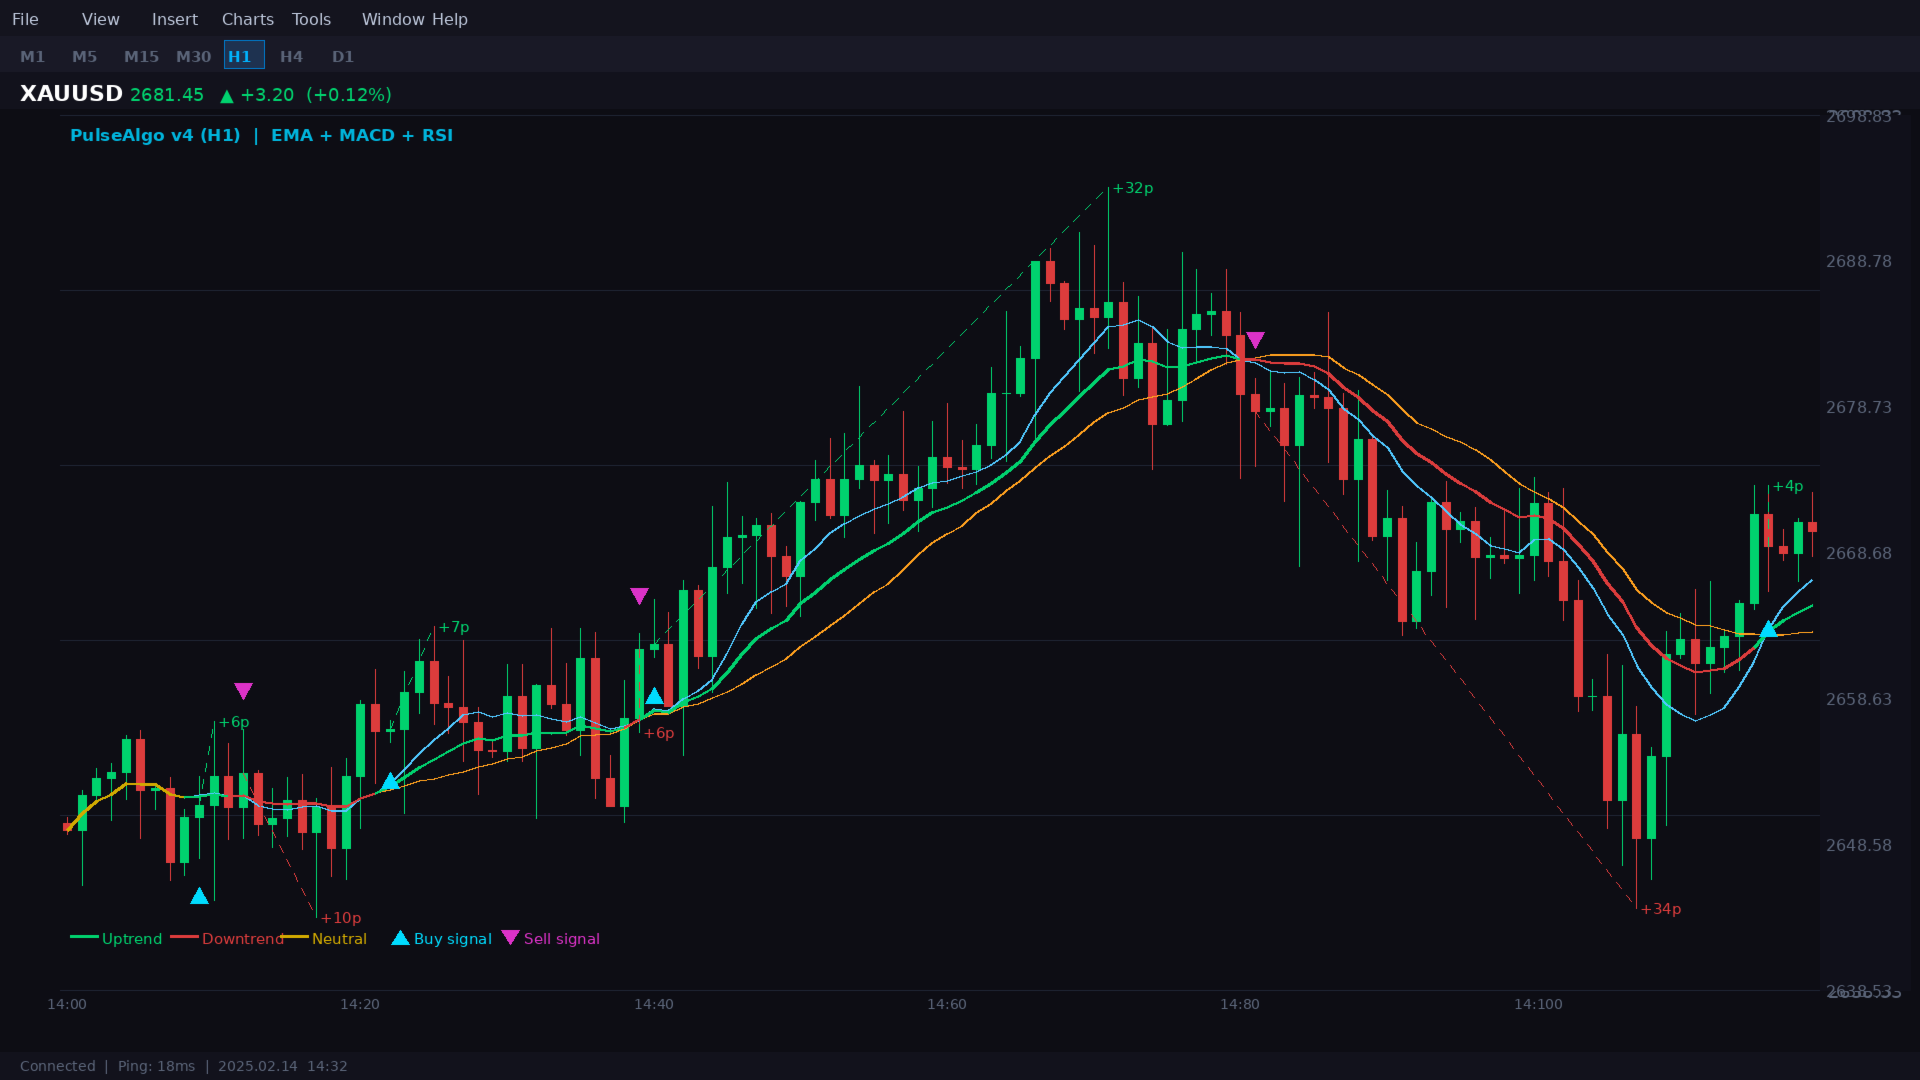
PulseAlgo does not use one-size-fits-all settings. Each timeframe operates with its own internally optimized configuration, calibrated to match the unique rhythm and volatility profile of that timeframe. When you switch from M5 to H1, the indicator silently adjusts its entire analysis engine — no manual input required.
Institutional Session Mapping
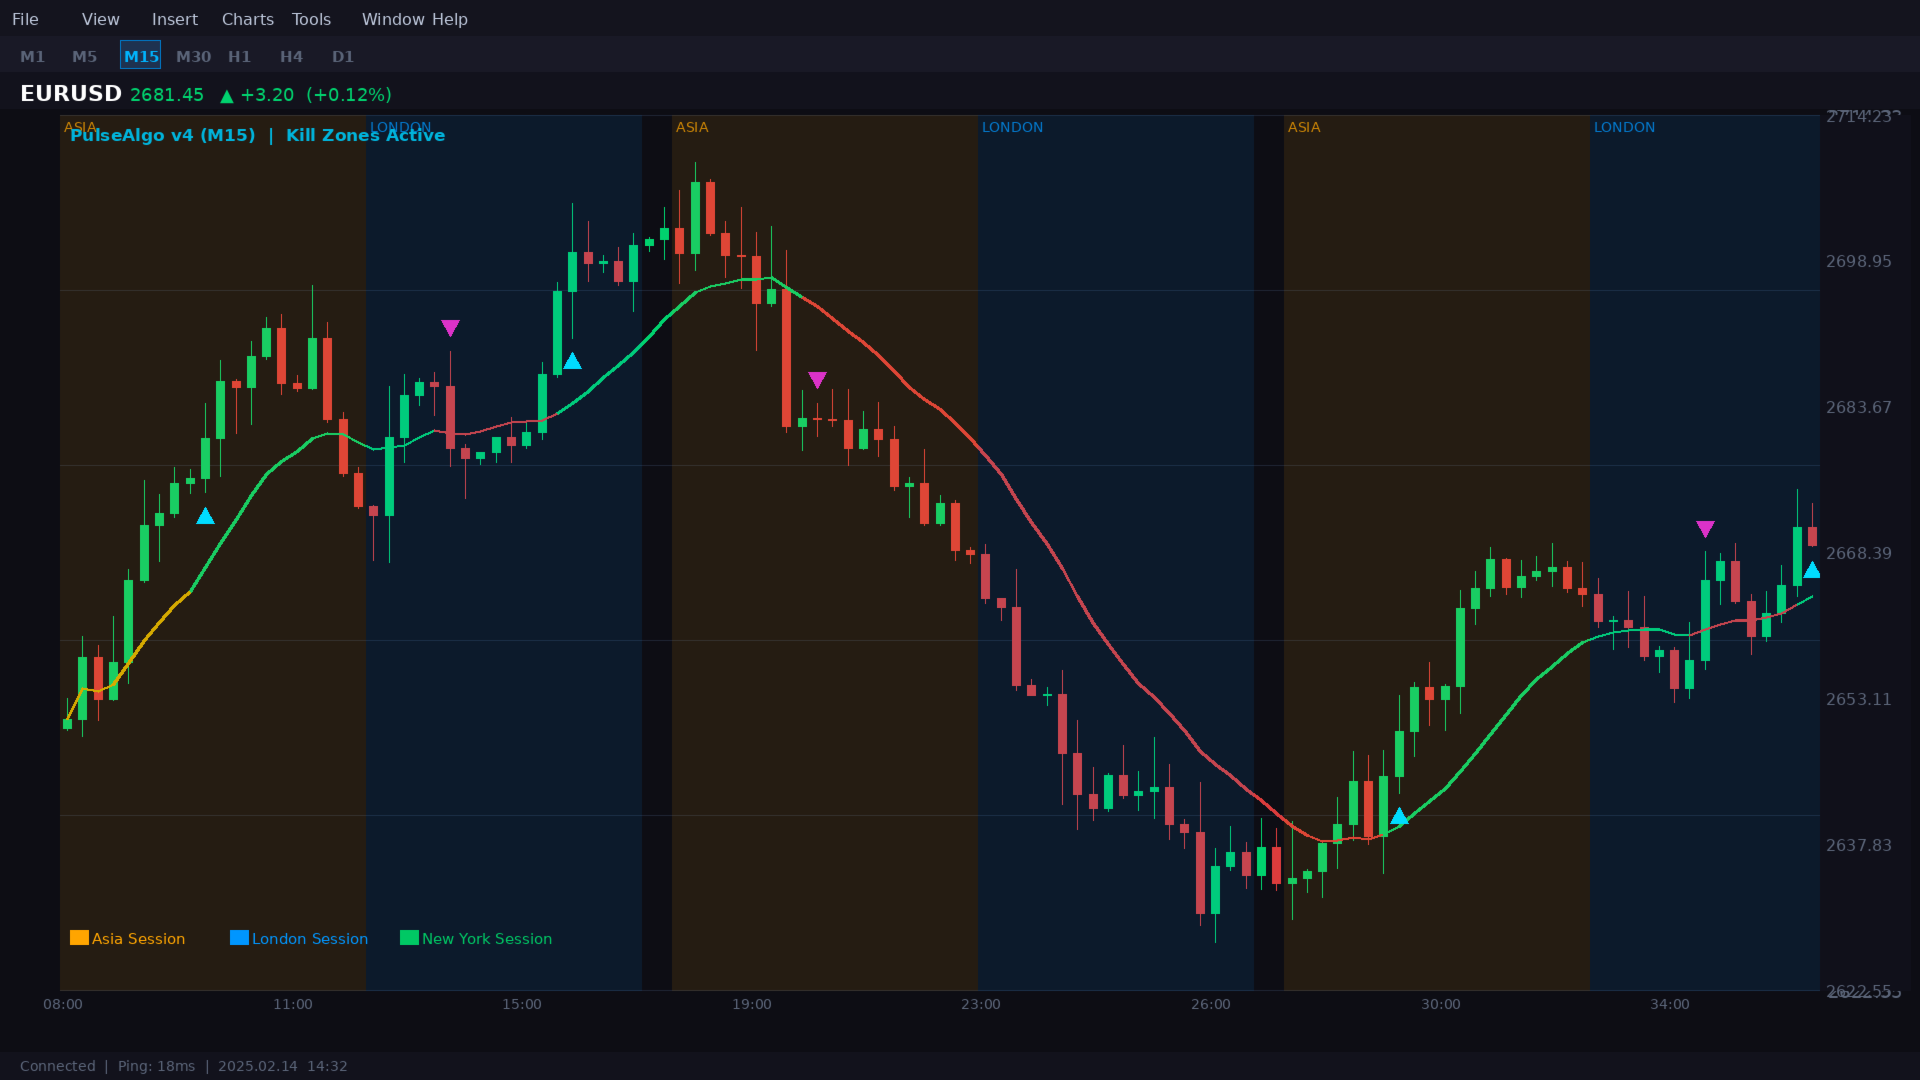
Professional traders know that price behaves differently depending on which financial center is active. PulseAlgo maps three key trading sessions directly onto your chart with color-coded zones, so you always know whether you are trading during Asia, London, or New York hours. These zones are fully customizable in color and transparency.
Visual Components
Adaptive Trend Ribbon
A dynamic trend line runs through the center of price action, changing color in real time. Green indicates bullish momentum, red indicates bearish momentum, and gold signals a transitional or neutral phase. The ribbon provides instant visual context before you even look at a signal.
Confirmed Entry Arrows
Buy and sell arrows appear only after the full confirmation sequence completes. Arrows are intelligently offset from the candle body to avoid visual clutter and make identification effortless, even on busy charts.
Auto Take-Profit Tracking
From each confirmed entry, a dotted line extends to the best price achieved during that trade — the highest high for buys, the lowest low for sells. This gives you an immediate visual record of how much profit each signal captured, both for current and historical trades.
Live Performance Dashboard
A compact on-chart panel displays real-time statistics for the previous month across all six supported timeframes. At a glance, you can see total trades, win rate, and cumulative winning pips — updated automatically every hour. The current timeframe is highlighted for quick reference.
Supported Timeframes
M1, M5, M15, M30, H1, H4
Each timeframe has been individually profiled and optimized. The indicator automatically detects your chart timeframe and applies the correct internal configuration.
Alert System
Never miss a signal, even when you are away from your screen. The alert system fires precisely once per confirmed signal — no repeating alerts, no spam. Three delivery methods are available and can be used individually or together:
- MetaTrader popup alert
- Mobile push notification
- Email notification
Customizable Settings
While the core strategy engine is pre-configured and locked for optimal performance, you retain full control over the visual experience:
- Enable or disable individual confirmation filters
- Show or hide kill zone session boxes
- Customize session colors and transparency
- Adjust the number of session days displayed
- Choose TP line colors for buy and sell
- Position the dashboard in any chart corner
- Set dashboard offset for perfect placement
How to Use
1. Download and install the indicator in your MetaTrader 5 Indicators folder.
2. Open any chart with a supported timeframe (M1 through H4).
3. Drag the indicator onto the chart. No configuration is needed.
4. Watch for confirmed entry arrows. Green arrows indicate buy opportunities, magenta arrows indicate sell opportunities.
5. Use the dotted TP line as a visual guide for potential profit targets.
6. Monitor the dashboard for ongoing performance across all timeframes.
Who Is This For
- Day traders looking for clean signals on lower timeframes (M5, M15, M30)
- Swing traders who prefer higher-probability setups on H1 and H4
- Traders who want a single indicator instead of stacking multiple tools
- Anyone frustrated with indicators that repaint or generate excessive false signals
Risk Disclaimer
Past performance is not indicative of future results. All performance statistics shown in the dashboard and referenced in testing are based on historical data analysis. Trading foreign exchange, gold, and other financial instruments involves substantial risk and may not be suitable for all investors. You should carefully consider your financial situation and risk tolerance before trading. This indicator is an analytical tool only and does not constitute investment advice, a recommendation, or a solicitation to buy or sell any financial instrument. The developer assumes no liability for trading losses incurred while using this product. Always apply proper risk management and never risk more than you can afford to lose.


Excellent work! Thank you very much!