Смотри обучающее видео по маркету на YouTube
Как купить торгового робота или индикатор
Запусти робота на
виртуальном хостинге
виртуальном хостинге
Протестируй индикатор/робота перед покупкой
Хочешь зарабатывать в Маркете?
Как подать продукт, чтобы его покупали
Технические индикаторы для MetaTrader 4 - 86
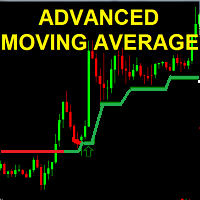
the Advanced MOVING AVERAGE indicator This is a formula of moving average based on support and resistance levels Two Colors indicator : UP trend --> Green Down trend -->Red Arrows UP/Down are shown for trend reversal indication ALERTS and mobile Push NOTIFICATIONS Simple Strategy : BUY on price over new green line Sell on price under new red line
Works on any TIMEFRAME MAin Input for calculation : index = 20.. 50..100..500 ... 1000 (Lower time frame -> Hig

TWO PAIRS SQUARE HEDGE METER INDICATOR Try this brilliant 2 pairs square indicator It draws a square wave of the relation between your two inputs symbols when square wave indicates -1 then it is very great opportunity to SELL pair1 and BUY Pair2 when square wave indicates +1 then it is very great opportunity to BUY pair1 and SELL Pair2 the inputs are : 2 pairs of symbols then index value : i use 20 for M30 charts ( you can try other values : 40/50 for M15 , : 30 for M30 , : 10 for H1 ,
---> Check all the other products <---
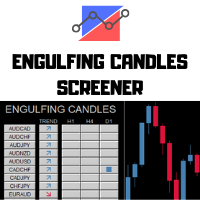
The Engulfing Candles Screener is a deeply customizable dashboard.
You can chose a trend filter, using 2 EMAs, with custom periods applied on a custom TimeFrames Then you can choose 3 timeframes to search, any TimeFrame is suitable and the screener will find the engulfing candles in the selected timeframe. 3 Timeframes to scan All the major forex pairs and crosses - up to 28 symbols Deeply Customizable
How to setup the screener:
Let the crosses visib

Индикатор показывает ключевые объёмы, подтверждённые движением цены.
Индикатор позволяет анализировать объёмы по направлению, по частоте появления, по их значению.
Есть 2 режима работы: с учётом тренда и без учёта тренда (если параметр Period_Trend = 0, то тренд не учитывается; если параметр Period_Trend больше нуля, то в объёмах учитывается тренд).
Индикатор не перерисовывается .
Настройки History_Size - размер рассчитываемой истории. Period_Candle - период волатильности. Mult_RS - коэф

With this indicator, you can easily make price regions in all time zones. In addition, with the automatic supply demand finder, you can ensure that the new regions are found automatically. You can increase your transaction quality by reaching more accurate operations with this auxiliary Tool and indicator.
I share your trial version of EURUSD for free with you. If you want to buy the working version in all parities, you can contact me. +New version Gap Bar Add ( Press G keyboard ) +Redsword P

OscillatorMotion - индикатор выполнен в виде осциллятора и показывает направление движения цены. Для удобства пользования и более точной настройки индикатора можно изменять период, количество предыдущих свечей или баров, которое индикатор берет для анализа. Так же есть функции alert и push-уведомлений. Индикатор работает на любой валютной паре и на любом таймфрейме. Входные параметры: period - количество предыдущих баров для анализа AlertSignal - включить функцию да/нет PushSignal - включить фун
Индикатор разработан для Рынков форекс Алгоритм основан на Moving average и нескольких фильтрах. Когда входить в сделки Синяя стрелка это сигнал на покупку Красная стрелка это сигнал на продажу Рекомендуемые параметры установлены по умолчанию Бля фильтрации сигналов можно использовать Moving average Period 30 Method linear Weighted Apply High Так же можно использовать Alligator, Bollinger bands, RSI...

MostTransactions - индикатор анализирует какие транзакции преобладают на рынке в данный момент покупки или продажи. Как правило если большинство трейдеров продает, то цена идет вверх, если преобладают покупки, то цена идет вниз. Таким образом крупные игроки заставляют обычных трейдеров терпеть убытки. Этот индикатор призван решить данную проблему. Если количество сделок на покупку превышает определенное среднее значение, то на графике появляется зеленая точка и следует ожидать движения вниз, есл

ANDREW’S PITCHFORK TRADING STRATEGY Essentially, Andrew’s Pitchfork is a tool for drawing price channels. While two lines surrounding price are usually enough to draw a channel, the Pitchfork has an extra line. It is the median line or the handle of the Pitchfork. The median line is central to this trading method. This is why Andrew’s Pitchfork is also known as the Median Line Method. TRADING RULES There are many ways to trade using Andrew’s Pitchfork but the basic idea is that pr
Scalp and Swing Signals (MT4 Indicator) Non-Repainting MT4 Signals: Pinpoint Reversals & Trend Following for Any Market! The "Scalp and Swing Signals" indicator is a cutting-edge trading tool meticulously developed for MetaTrader 4 (MT4) . This versatile forex indicator empowers traders to capture highly accurate entry signals at the top and bottom of trend cycles, making it perfect for both scalping strategies and swing trading opportunities. Its robust algorithm delivers non-repainting signal

The principle of this indicator is very simple: detecting the trend with Moving Average, then monitoring the return point of graph by using the crossing of Stochastic Oscillator and finally predicting BUY and SELL signal with arrows, alerts and notifications. The parameters are fixed and automatically calculated on each time frame. Example: If you install indicator on EURUSD, timeframe M5: the indicator will detect the main trend with the Moving Average on this timeframe (for example the Moving

Индикатор показывает канал регрессии, в расчете которого используется золоте сечение Фибоначчи Уровни строятся не как графические объекты, а используют индикаторные буферы - это позволяет использовать данный индикатор в советниках Вблизи границ канала наиболее вероятны коррекции и развороты цены Позволяет вести трендовую и контр трендовую торговлю внутри канала Наклон канала показывает направленность рынка, а его ширина - текущую волатильность Работает на всех таймфреймах, на любых валютных пара
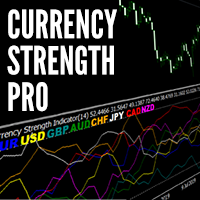
The Currency Strength Meter is the easiest way to identify the strongest and weakest currencies in the market. It works by applying clever calculations to 28 Forex pairs to establish which currencies are the driving force behind price action. By trading strength against weakness, we can greatly increase our chances of success and find some of the highest probability trends to trade. Technical Information
The strength meter uses the relative strength meter which is applied to all 8 major currenc

The principle of this indicator is very simple: detecting the trend with Moving Average, then monitoring the return point of graph by using the crossing of Stochastic Oscillator and finally predicting BUY and SELL signal with arrows, alerts and notifications. The parameters are fixed and automatically calculated on each time frame. Example: If you install indicator on EURUSD, timeframe M5: the indicator will detect the main trend with the Moving Average on this timeframe (for example the Moving

BPS Panel
Breakout Pro Scalper Solution Panel
This indicator is part of the RPTrade Pro Solutions systems. BPS Panel is a daily trend indicator using Price Action, Dynamic Support and Resistances. It's designed to be used by anyone, even the absolute beginner in trading can use it. NEVER repaints . Indications are given from close to close . Designed to be used alone , no other indicators are required. Gives you the trend and potential Take Profit at the beginning of the day.
How doe
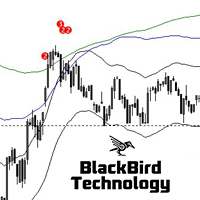
Multi MA Band Signal Indicator is a no-nonsense, no delay, no repaint indicator !
Moving Average bands together with a RSI filter is a 'simple', but very powerful and reliable signal.
Five "moving average bands" generate the signals. By default : MA25, 50, 100, 200 and 400. This can be changed in the parameters as well as the MA mode and the MA band deviation. The signal indicates the number of moving average bands that are crossed. The higher the value the stronger the signal. Two signal lev

Scalping Line - это усовершенствованная средняя которую мы создали для применения в своей торговой стратегии. Суть нашей торговой стратегии заключается в том, чтобы открывать сделку на покупку, когда линия синего цвета, а цена опускается ниже линии. Или открывать сделку на продажу, когда цена поднимается выше линии, а цвет линии красного цвета. Таким образом мы открываем сделки когда цена на небольшое расстояние идет в противоположенную от общего тренда сторону. Закрываем сделку при получении м

Это торговая система построена на рыночных импульсах разной сложности.
Для формирования сигнала, индикатор использует моменты, когда направление импульса и необходимого участка тенденции совпадают. А также индикатор учитывает волатильность рынка в текущий момент. Метки Stop_Loss можно установить с параметром "0" или "1", тогда Stop_Loss будет учитывать волатильность на рынке.
Метки Take_Profit можно установить с параметром "0", тогда Take_Profit будет учитывать волатильность на рынке.
Индикатор для бинарных опционов и скальпинга на рынках форекс рекомендуемое время експирации 1-2 свечи таймфреймы до M30 сигналы когда появится синяя точка это сигнал на покупку когда появится красная точка это сигнал на продажу сигналы появляются вместе со свечой сигналы не исчезают индикатор разработан на эксклюзивном алгоритме такого вы не встретите нигде рекомендуется избегать торговли во время выхода сильных новостей
The brand new trading indicator Trendline Tunnel is presented by KING.Ai. This indicator were built base on the the theory of Latest Up and Down Trend line . Latest Trend are difficult can by seen by human eye. Indicator can help to identical the Trend . KING.Ai Forex trader mainly use this strategy to "See Through" market . We do believe that it is a powerful method to show the latest trend and do the breakout trade strategy . General speaking, Trendline Tunnel have following using: Method
Trend Direction Estimation * Please use the free demo before renting or buying. This indicator works in all kinds of frames and presents you the trend in the time period you choose. This trial period (Rental for 1 month) offered for promotion is valid for a limited number of copies. At the end of the trial period, longer term rental and unlimited purchase options will also be opened in it's new prices. My expert advisor work is continuing for the strategies I have been developing for the Trend

Trend Direction Arrows * Please use the free demo before renting or buying. This indicator works in all kinds of frames and presents you the trend in the time period you choose. You can try to enter the bars in the bars where the arrows are formed or it helps you to understand the trend direction in the time period you look at. This trial period (Rental for 1 month) offered for promotion is valid for a limited number of copies. At the end of the trial period, longer term rental and unlimited pu

Описание
ABC Trend Levels - индикатор, который идентифицирует на рынке тренды и важные трендовые уровни поддержки и сопротивления.
Рекомендации
Вы можете использовать данный индикатор для определения тренда и соответственно для определения направления открытия позиции или закрытия противоположной позиции.
Параметры
===== _INDICATOR_SETTINGS_ ===== - настройки расчета индикатора Maximum History Bars - максимальное количество баров истории для расчета индикатора. Average True Range Period -
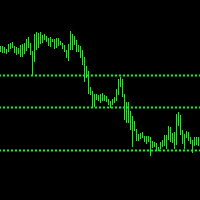
Описание
ABC Trend Levels Pro - индикатор, который идентифицирует на рынке тренды и важные трендовые уровни поддержки и сопротивления.
Рекомендации
Вы можете использовать данный индикатор для определения тренда и соответственно для определения направления открытия позиции или закрытия противоположной позиции.
Параметры
===== _INDICATOR_SETTINGS_ ===== - настройки расчета индикатора Maximum History Bars - максимальное количество баров истории для расчета индикатора. Average True Range Perio

Fourteen plus nine What is it for? Applying Tom DeMark’s TD Sequential serves the purpose of identifying a price point where an uptrend or a downtrend exhausts itself and reverses. . What are the main components of TD Sequential? TD Sequential has two parts – TD Setup and TD Countdown. The first phase of TD Sequential starts with a TD Setup and is completed with a 9 count. When the 9 count is completed, it is at that point, a price pause, price pullback, or reversal is likely. It is also at tha

Индикатор Unexpected на удивление прост в использовании. Вы оцените простоту индикатора в первые же дни торговли. Если правильно определить начало тренда, результат сделки буде соответственный. Торговля на основе показателей тренда самая простая и, зачастую, самая эффективная. Если же вы используете в качестве базы живой график бинарных опционов, шансы на успех становятся еще выше.
Данный индикатор может отследить устойчивое движение цены в определенном направлении. При этом само движение мож
Mean Reversion Probability indicator is a tool based on a mathematical theory of mean reversion . As the markets very often shows the behavior of diverging from its mean, up to a certain distance, and then start to converge its mean again. This is a very well known phenomenon in stochastic processes and the price series is also a stochastic variable so we apply certain mathematical and statistical procedures to estimate the turning point .
Using Mean Reversion indicator, traders could potentiall
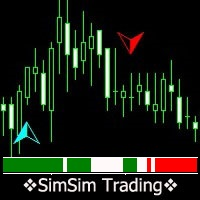
Индикатор просчитывает и суммирует данные от 25-и стандартных индикаторов. В результате расчета получаем текущий уровень сигнала. Во входных параметрах указываем минимальный уровень сигнала. Этот уровень отображается в виде гистограммы (основной индикатор ) и стрелки индикатора (второй индикатор). Положительные значения сигнала говорят о возможной покупке, отрицательные о продаже. В индикаторе реализована система тестирования, которую можно опробовать, скачав демонстрационную версию. И основно
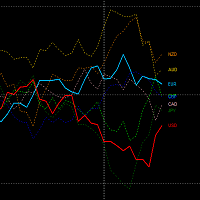
Отслеживайте относительную силу валют с точностью и простотой Этот индикатор позволяет анализировать относительную силу отдельных валют в реальном времени в рамках всей валютной корзины, предоставляя вам стратегическое преимущество в идентификации торговых возможностей. Основные преимущества: Мгновенный анализ силы валют : Просмотр силы валют прост и интуитивен, что позволяет быстро выявлять ключевые различия и использовать возможности. Три режима отображения : Настройте отображение, выбрав один

The principle of this indicator is very simple: detecting the trend with Moving Average, then monitoring the return point of graph by using the crossing of Stochastic Oscillator and finally predicting BUY and SELL signal with arrows, alerts and notifications. The parameters are fixed and automatically calculated on each time frame. Example: If you install indicator on EURUSD, timeframe M5: the indicator will detect the main trend with the Moving Average on this timeframe (for example the Moving

Индикатор разработан для бинарных опционов и коротко срочных сделок на форекс В ходить в сделку когда появился сигнал синяя стрелка вверх покупать красная стрелка в низ сигнал на продажу Для форекс входить по сигналу выходить по противоположному сигналу или тейкпрофиту Для бинарных опционов Входить на 1 свечу эсли сделка зашла в минус ставим догон на следующей свечи Работает на всех таймфреймах Если применить фильтра На пример Rsi получится хорошая надёжная стратегия.. Алгоритм находится на ста

This indicator will draw monthly, weekly, and daily pivot. Pivot line will be calculated automatically again when the period ends. Auto Pivot Metatrader 4 Indicator The Auto Pivot indicator for Metatrader 4 automatically updates the pivot point (PP), support (S1,S2,S3) and resistance levels (r1,r2,r3) every day. Price above the pivot point means positive while price below the pivot point means negative. S3 indicates extremely oversold while price above resistance r3 means extremely overbought.

Индикатор. "Индикаторные Волны ".
Используя 23-и стандартных индикатора и авторский алгоритм, рассчитываются уровни покупок (от 0 до +100) и продаж (от 0 до -100).
Далее используя рассчитанные уровни, "Индикатор Волны" рисует волну с 21 средними скользящими.
Номер волны равен периоду усреднения, рассчитанных уровней.
Волны 1 - 7 быстрые скользящие средние
Волны с 8 -14 средние скользящие средние
Волны с 15-21 медленные скользящие средние
Глядя на фигуры, которые рисует ин

Trend Flasher
Trend is your friend is the age old saying quote in trading arena, there are though many ways to gauge the trend and its direction, more scientific measure and logically meaningful will be an ATR break outs to identify and spot the trend and its acceleration, so we created this easy to use trend identification panel and optimized super trend based multi time frame panel entry system to aid and help the traders to make their trading decision.
Unique Features of Trend Flasher
1. H
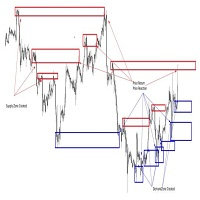
While most traders use various technical indicators, the price action is basically determined by the buying and selling activity. This is how support and resistance levels, which are commonly used terms in technical analysis is formed.
Traders know that when price reaches a support level, price can bounce off this support. This is also known as a level where this is high demand. A high demand area forms when there are more buyers than sellers.
In trading, investors tend to buy at the support
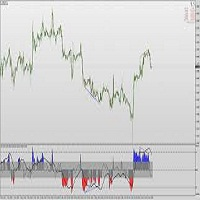
The "Preface" Input-
Broker time is required by the code that features PivotsTz and vLines. When data feed is live the broker time is available. When data feed is not live it is not available. The purpose of this "Preface" section is to find and input the Clock location that has the same time as the broker server. Then, even without live data feed we will still have the equivalent of the broker server time to work with, generated by the Clock, and the PivotsTz

Принцип построения линий индикатора и их смысл . Индикатор Signal Channel использует робастный метод фильтрации основанный на двух скользящих медианах применимых к ценам High и Low, т.е. линиях <High> и <Low>, где <..> - знак линейного усреднения, которые сдвигаются на определенные величины при восходящем тренде и на противоположны величины при нисходящем тренде, что позволяет получить узкий канал, приблизительно очерчивающий каждый бар. Острые изломы линий такого канала по

Pivots MT4 - Простой и удобный индикатор уровней pivot , рассчитывает уровни по методам Classic , Fibonacci , DeMark , Camarilla , WooDie , Central Pivot Range . Индикатор выгодно отличается следующим
Рассчитывает уровни pivot по методам Classic , Fibonacci , DeMark , Camarilla , WooDie , Central Pivot Range ; Выводит на графике текущие уровни и уровни на предыдущих периодах; Выводит на графике выбранные метод и период, названия уровней и их ценовые значения. Параметры Pivot Method - Выпа

StepOscillator - необычный осциллятор, выполнен в виде ступенчатой линии в отдельном окне индикатора. Кроме того, что линия меняет цвет при смене направления движения цены, что является сигналом к покупке или продаже, так же о силе тренда можно судить по размеру ступеньки, чем она выше, тем сильнее тренд. Кода ситуация на рынке близка к смене направления движения, линия индикатора становится практически плоской. Входные параметры: Price - цена по которой ведет расчет индикатор AlertsMessage - вк
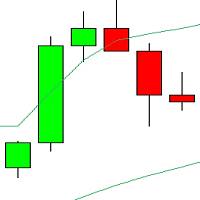
Indicator will send alerts when price has opened and closed outside bollinger bands. THIS INDICATOR SCANS EVERY PAIR ON SIDE OF MARKET WATCH SO YOU DON'T MISS A TRADE! Indicator has pop up alert for all currency pairs in your watch list. It is set up to notify you if price is outside of M15, H1, H4 automatically. This is great for seeing if market is a critical levels and at a possible reversal point.

This indicator is to follow the trend. When the closing price breaks the trend line, it may mean that the trend has to be reversed. It is cashing well in the trend. It has only two parameter settings. Parameter setting: deviation:15 "deviation" is Follow the distance between the current high and low points. depth:24 "depth" is Depth of high and low points. This is just the default parameter, you can optimize it in use.

Currency Strength Meter - это самый простой способ определить сильные и слабые валюты. Этот индикатор показывает относительную силу 8 основных валют: AUD, CAD, CHF, EUR, GBP, JPY, NZD, USD.
По умолчанию значение силы нормализовано в диапазоне от 0 до 100 для алгоритма RSI: Значение выше 60 означает сильную валюту; Значение ниже 40 означает слабую валюту;
Индикатор создан и оптимизирован для его внешнего использования в советниках и внутри пользовательских индикаторах. Для непосредственного ис

Profit Percent Series 2 The scanner dashboard available here (for Free) : And read detailed information about MA Confluence here: https://www.mql5.com/en/blogs/post/747474
Here's a post about Common Settings for all Profit Percent Series Indicators: https://www.mql5.com/en/blogs/post/747456
Strategy: Main Signal Indicators (Any One): MA Cross (In-built) or Hull, OBV Cross, Heiken Ashi Cross Validation Indicators (Preferably less than 3): OBV (with Min Distance), Heiken Ashi, ADX, SuperTren

Общая информация
Индикатор определяет участки флетового и трендового состояний рынка путем сравнения средней и текущей волатильностей. Участки флета - прямоугольники заданного пользователем цвета. По ним легко определить максимум и минимум участка, а также его высоту в пунктах. Начало каждого из участков тренда маркируются стрелкой, указывающей направление тренда.
Настроечные параметры 1. Averaging period - период расчета средней волатильности 2. Color of flat region - цвет прямоугольника для

Display the date, time and price according to the movement of the mouse cursor on the chart This is useful for discretionary trading.
It is an indispensable tool for verifying and studying past market prices and trades. Large and easy-to-read characters It is easy to see even if your eyesight is weak.
Also, you can tell the date and price to YouTube and webinar viewers in an easy-to-understand manner. Characteristic Date,Time and Price are displayed. The value follows the movement of the mouse.

Kumo Breakout Indicator is a trading system based on Ichimoku Kumo levels.
Parameters
Trader can set Ichimoku parameters like: Tenkan-Sen (tk) Kijun-Sen (kj) Sekou-Span-A (ku) that are the classic parameters allowed on Ichimoku indicator on Metatrader.
Other interesting parameters: "Configure Alerts" PopUpAlert= true or false PushAlert=true or false Mail= true or false and personalized texts for eMails: TextMailUp1="WP Buy "; TextMailUp2="WP Buy write here your text"; TextMailUp3=""; TextM
Select the strongest and weakest combination of 28 currencies. You can enter the market before the trend starts or wait for the price to reverse. The specific operation depends on yourself. Can be used in combination with other strategies and indicators. For example, my other indicator of reverse trend line. https://www.mql5.com/en/market/product/51046 Wish you make money in the market. If you have any questions in use, please contact me.

Most accurate Pattern indicator on this market. It search triangles, wedges, channels (next patterns and autoscanner in plan) Works on Forex, Commodities, Indicies, Stocks, Crypto, ... on all timeframes and on every brooker.
If you want this and all my other products for FREE , create account here and then write me and I will send you all my actual and future product for FREE + VIP on my http://discord.io/reitakfx
For more info join to http://discord.io/reitakfx where you can get info
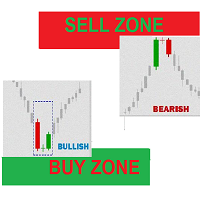
Buy Sell Zones Simple indicator for moving BUY / Sell Zones and Buy / Sell Signals generated with indicator moving Buy and Sell zones : Closest zone is wide and clear : Red for Sell zone , Green for Buy zone >>> old far zones are in bold lines :::BUY Zones (GREEN) appear only in UP Trend and disappear in DOWN Trend :::SELL Zones (RED) appear only in DOWN Trend and disappear in UP Trend input parameters ::: index bars : bars range for zone calculation levels : number of zones Up move/Down mov

Индикатор работает на обсчитывание ценовой дельты. Максимально вероятно определяет направление рынка. Работает в двух режимах, расчёт по каждой свече и суммарный расчёт группы свечей. Применяется для МТ4 , работает на всех инструментах. Не требует ни каких настроек. Прост в использовании для всех даже новичков. Оценку рынка можно производить на всех таймфреймах от 1 минуты и выше. Инструкция по использованию в видео. Текущие вопросы можно обсудить в телеграмм чате, ссылка под видео. Всем удачи и

The principle of this indicator is very simple: detecting the trend with Moving Average, then monitoring the return point of graph by using the crossing of Stochastic Oscillator and finally predicting BUY and SELL signal with arrows, alerts and notifications. The parameters are fixed and automatically calculated on each time frame. Example: If you install indicator on EURUSD, timeframe M5: the indicator will detect the main trend with the Moving Average on this timeframe (for example the Moving

Стрелочный индикатор Alive Trend показывает потенциальные точки входа в рынок в виде стрелок соответствующего цвета: стрелки вверх (синие) предлагают открыть покупку, стрелки вниз (красные) – продажу. Alive Trend визуально «разгружает» ценовой график и экономит время анализа: нет сигнала – нет сделки, если появился обратный сигнал, то текущую сделку стоит закрыть. Предполагается вход на следующем баре после указателя, но могут быть и нестандартные рекомендации для каждой стратегии свои.
Именно

Индикатор Blue Eagle подает сигналы о смене тренда, показывая сигналы. Высокая вероятность успешного тренда, его можно использовать с оптимальным коэффициентом риска к прибыли. Индикатор не перерисовывается и не запаздывает, можно использовать как для пипсовки на мелких периодах, так и для долгосрочной торговли.
Индикатор Blue Eagle предназначен для анализа движений цен с заданной амплитудой, отображая только самые важные развороты, что значительно облегчает оценку графиков. Стрелки показываю
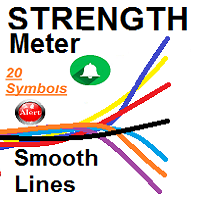
Currencies Strongest Weakest SMOOTH STRENGTH METER INDICATOR (SMOOTH LINE) it draws Currencies TREND Volatility Power / Strength lines : - Detects the 2 highly TRENDED Volatile pairs ( will be the Bold Lines ) - A very Helpful Indicator - It draws smooth lines for up to 20 currencies pairs representing Volatility strength and power - First it indicates the most powerful trended direction pairs : Strongest / Weaker - MAIN FUNCTION :it gives indication of the UP trend mos

Добро пожаловать в индикатор моего счетчика валюты
Простое введение:
Этот индикатор может помочь вам увидеть силу каждой валюты в отдельности.
Как вы знаете, когда GBPUSD растет, это означает, что GBP набирает силу или USD ослабевает, но вы не можете понять, в чем причина этого движения, это было о GBP? или речь шла о долларах?
Чтобы определить мощность фунта стерлингов, этот индикатор проверит все пары, содержащие фунт стерлингов, и определит их движения, и, наконец, вычислит среднюю мощность

Индикатор ищет уровни поддержки и сопротивления, определяя важные ценовые уровни. Параметры индикатора: Mode - метод определения уровней: 1) High_Low - по теням, 2) Open_Close - по цене открытия и закрытия;
Period_ - период индикатора, внутри которого ищется важный ценовой уровень (например, если стоит 12 - ищет уровень внутри 12 баров, сдвигаясь каждый раз на бар вперёд); Touches - количество касаний цены; BreakAlert - выдавать алерт при обнаружении уровня;
NewLevelAlert - выдавать алерт при о

Moving Averages Of Rsi This indicator shows you Average of Relative Strenght Index. You can use this indicator for your own experts with iCustom() RSI is in the buffer ( 0 ) and moving average is in the buffer ( 1 ) there are afew parameters for using this indicator on different currencies and different time frames. you can test it and optimize it . Input Parameters: RsiPeriod: default is 14 SignalMaPeriod : default is 28 SignalMAMode : default is SSMA

Moving Averages Of Cci This indicator shows you Average of Commodity Channel Index. You can use this indicator for your own experts with iCustom() CCI is in the buffer ( 0 ) and moving average is in the buffer ( 1 ) there are afew parameters for using this indicator on different currencies and different time frames. you can test it and optimize it . Input Parameters: CciPeriod: default is 14 SignalMaPeriod : default is 28 SignalMAMode : default is SSMA

MA Multi-Currencies Multi-Timeframes Histogram BUY/SELL Indicator up to 6 currencies on time calculations based on 6 time frames : M5, M15, M30, H1, H4, D1 Trading Strategies: **TREND shifts to UP trend when Green point appears after Red and Gray points -> Close SELL positions then add new BUY positions on new Green points **TREND shifts to DOWN trend when Red point appears after Green and Gray points -> Close BUY positions then add new SELL positions on new Red points ** Close BUY position

BeST_ Elliot Wave Oscillator Strategies is an MT4 indicator which by default is the difference of two SMAs displayed as a histogram fluctuating around zero while a Signal Line generates Entry Signals either in a Reverse or in a Normal Mode and it is a very powerful tool that very often exploits huge market movements. Signal Line comes in 2 types: Advanced Get Type – like the corresponding one used in the homonym analysis package Mov. Average Type – as a Moving Average of the Elliot Oscillator I

This incredible indicator allows you to overlay many moving averages to create a ribbon-like pattern. You can now easily visualize trend strength and determine pivot points by simply looking at the ribbon. Fully customizable Supports Simple , Exponential , Smoothed , and Linear Weighted moving average types Ability to use typical and median and weighted prices as input. Draw up to 32 (user-settable) moving average plots, with customizable period spacing (use length and start settings) Enable or
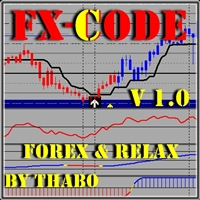
Please contact me or send me a message after you have purchased the FX-CODE This systems supports technical traders fundamental traders sentimental traders NON repaint entry with trend entry confirmations. this is a build up system so please contact me for more indicators to add THE FX-CODE V1.0 is one of the Forex & Relax Strategy systems, and it’s made to fit any kind of trader from newbie to professional. This system can suet any style of trading fundamental or technical all you have t
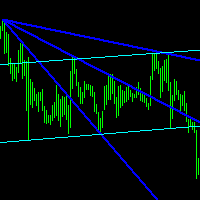
Описание
Reverse Rayer - индикатор, который рисует лучи по наклонным трендовым уровням
Рекомендации
Вы можете использовать данный индикатор для определения тренда и соответственно для определения направления открытия позиции или закрытия противоположной позиции.
Параметры
===== _INDICATOR_SETTINGS_ ===== - настройки расчета индикатора Maximum History Bars - максимальное количество баров истории для расчета индикатора. Average True Range Period - период индикатора ATR (используется для р
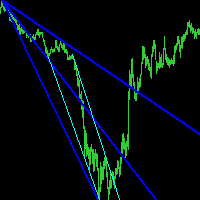
Описание
Reverse Rayer Pro - индикатор, который рисует лучи по наклонным трендовым уровням
Рекомендации
Вы можете использовать данный индикатор для определения тренда и соответственно для определения направления открытия позиции или закрытия противоположной позиции.
Параметры
===== _INDICATOR_SETTINGS_ ===== - настройки расчета индикатора Maximum History Bars - максимальное количество баров истории для расчета индикатора. Average True Range Period - период индикатора ATR (используется д

Heikin-Ashi charts , developed by Munehisa Homma in the 1700s. Munehisa Honma was a rice merchant from Sakata, Japan who traded in the Dojima Rice market in Osaka during the Tokugawa Shogunate. He is considered to be the father of the candlestick chart. Th e man who invented the use of candlestick charts for finding and profiting from chart patterns.He was a billionaire trader on those days if we compared his net-worth with todays dollar . Heikin Ashi Scanner is an Multi-Currency and Multi

The principle of this indicator is very simple: detecting the trend with Moving Average, then monitoring the return point of graph by using the crossing of Stochastic Oscillator and finally predicting BUY and SELL signal with arrows, alerts and notifications. The parameters are fixed and automatically calculated on each time frame. Example: If you install indicator on EURUSD, timeframe M5: the indicator will detect the main trend with the Moving Average on this timeframe (for example the Moving

Permite ver el horario comprendido entre la hora inicial que indique el usuario y la hora final, de esa manera, si el usuario desea ver sobre el grafico una sesion de trabajo, solo tiene que indicar la hora incial y la hora final de la sesion que desee.
Esto permite que el usuario identifique con mayor facilidad el horario que comprenda la sesion de trabajo que el usuario desee vigilar, o trabajar, o simplemente tener como referencia.

El Fibonacci automatico de Grupo Bazan Inversores, permite al usuario que lo utiliza, ver desplegado de manera automatica los niveles Fibonacci de los periodos que el mismo usuario haya seleccionado.
Esto permimte que el usuario no tenga que seleccionar el Fibonacci de la plataforma de metatrader 4 para colocar manualmente la figura, pudiendose concentrar exclusivamente en su analisis u operativa.

This indicator includes: Currency Strength Meter My currency strength meter gives you a quick visual guide to which currencies are currently strong, and which ones are weak. The meter measures the strength of all forex cross pairs and applies calculations on them to determine the overall strength for each individual currency. Live Heat Map — Multiple time frame Heat Map makes it easy to spot strong and weak currencies in real-time. Get an overview of how world currencies are traded against each
The brand new trading indicator using TRIX strategy is exclusive presented by KING.Ai. Exclusive Functions including Mobile Push Notification . This indicator with Three-mode alerts is developed by KING.Ai ONLY. It is probably impossible that you could find a TRIX indicator like this one. It is very difficult for you to trade with the Trix strategy as there is limited time for traders to monitor every currency. However, the Trix strategy is very profitable especially using in DAY CHAT. It
А знаете ли вы, почему MetaTrader Market - лучшее место для продажи торговых стратегий и технических индикаторов? Разработчику у нас не нужно тратить время и силы на рекламу, защиту программ и расчеты с покупателями. Всё это уже сделано.
Вы упускаете торговые возможности:
- Бесплатные приложения для трейдинга
- 8 000+ сигналов для копирования
- Экономические новости для анализа финансовых рынков
Регистрация
Вход
Если у вас нет учетной записи, зарегистрируйтесь
Для авторизации и пользования сайтом MQL5.com необходимо разрешить использование файлов Сookie.
Пожалуйста, включите в вашем браузере данную настройку, иначе вы не сможете авторизоваться.