LT Support and Resistance Generator
- 지표
-
Thiago Duarte
 안녕하세요! 제 이름은 Thiago(영어 이름 James)이며, 프로그래머입니다.
저는 2016년부터 시장 업계에 활동해 왔으며 브라질인입니다.
저는 시장 애호가 커뮤니티인 Litoral Trading의 창립자이자 관리자입니다.
2019년 3월부터 MQL5 프로그래밍을 해오고 있으며, MT5에 집중하여 여러분의 성장을 돕고 있습니다.
여행을 좋아하고, 두 바퀴 탈것을 사랑합니다.
여러분의 전략을 자동화하고 싶으신가요? 견적을 위해 연락해 주세요!
우리의 페이지: - 버전: 1.0
- 활성화: 5
LT Support Resistance - 지지와 저항을 100% 자동으로 식별 수동으로 지지와 저항선을 그리느라 귀중한 시간을 낭비하는 데 지치셨나요? 아니면 매번 중요한 레벨을 놓쳐서 답답하셨나요? LT Support Resistance는 이러한 번거로운 작업을 없애기 위해 개발되었습니다. 여러 타임프레임(시간족)을 동시에 분석하여, 거래 중인 자산의 가장 중요한 구역을 자동으로 식별하고 차트에 표시해 줍니다.
== 중요 레벨의 스마트 자동화 ==
주관적이고 시간이 오래 걸리는 수동 라인 작도 대신, 본 지표는 과거 가격 데이터를 분석하여 유의미한 반전 포인트를 식별하고, 가격이 '실제'로 신뢰하고 반응하는 지지 및 저항선을 그려줍니다. 그 결과 데이터에 기반한 객관적이고 신속한 분석이 가능해집니다.
== 주요 특징 ==
-
100% 자동 감지: 수동 분석 없이도 지지/저항 레벨 식별
-
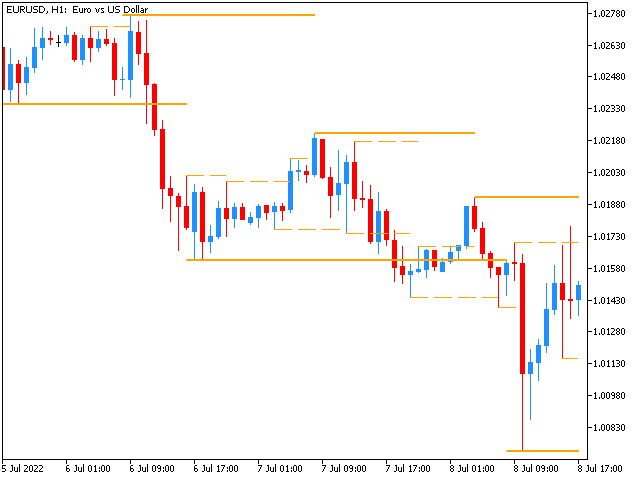
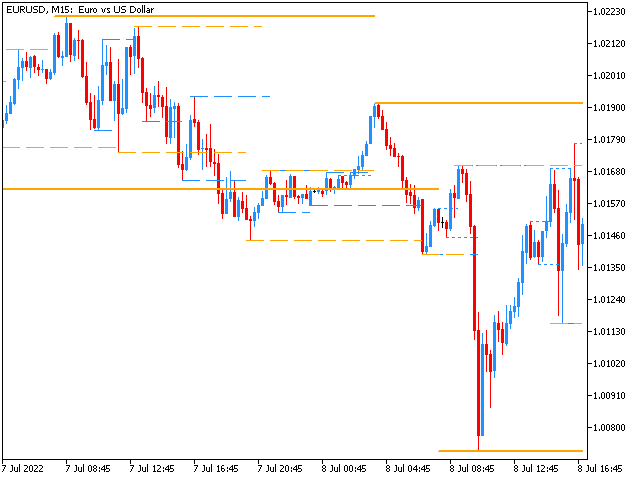
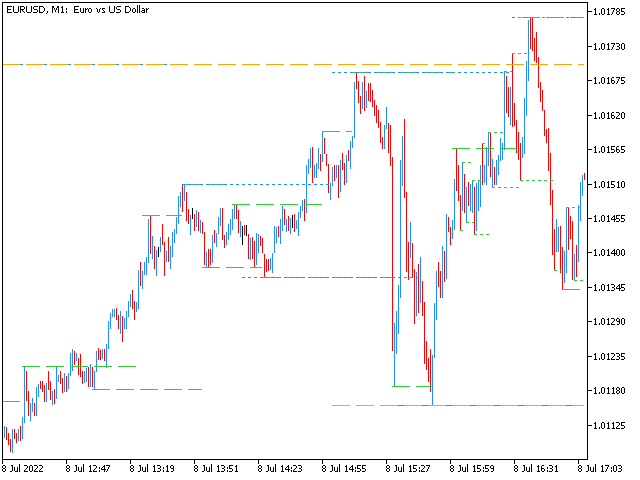
멀티 타임프레임(MTF): M5 차트에서 H1, H4, D1, W1 레벨을 동시에 시각화
-
스마트 알림: 가격이 레벨을 터치, 돌파 또는 해당 구간에서 횡보할 때 알림 제공
-
동적 구역(Zones): 단순한 '선'이 아닌 '매물대(구역)'를 생성하여 실제 프라이스 액션(Price Action) 반영
-
모든 자산 호환: 외환(Forex), 지수, 주식, 암호화폐, 원자재
-
완벽한 비주얼 커스텀: 색상, 스타일, 두께, 투명도 등 자유롭게 설정 가능
== 작동 모드 ==
-
터치(Touch): 가격이 레벨에 '터치'할 때 알림 수신
-
돌파(Breakout): 가격이 레벨을 '돌파'할 때 알림 수신 (돌파 트레이더에게 적합)
-
동시 적용(Both): 터치와 돌파를 결합하여 극대화된 범용성 제공
== 가장 이상적인 활용 사례 ==
-
클래식 기술적 분석 트레이더: 지지와 저항을 객관적으로 명확하게 식별
-
스윙 트레이더: 중장기 포지션을 위해 고점과 저점을 정밀하게 타겟팅
-
데이 트레이더: MTF 기능을 활용하여 상위 시간족의 확정 신호를 바탕으로 하위 시간족에서 진입 동기화
-
스캘퍼: 하위 구역들을 자동 익절(Target) 및 손절(Stop-loss) 기준으로 활용
== 작동 원리 ==
지표가 가격 이력 속에서 중요한 고점과 저점을 모두 매핑하고, 각 주요 구역에 수평선을 그려줍니다. 가격이 이 레벨들에 가까워지면 정확하게 대응할 수 있도록 자동 알림을 보냅니다.
== 호환성 ==
M1부터 월봉(Monthly)에 이르기까지 모든 타임프레임에서 완벽하게 작동합니다. 최고의 신뢰성을 보장하기 위해 엄격한 가격 패턴 인식 연산을 기반으로 합니다.
== 고객 지원 ==
질문이나 제안 사항이 있으신가요? 언제든 문의해 주세요! 저희는 고객님의 성공을 위해 최선을 다하고 있습니다. MQL5.com 채팅이나 댓글 탭을 이용해 주시기 바랍니다.
주의: 100% 완벽한 지표는 존재하지 않습니다. 항상 올바른 리스크 관리를 실천하세요.