MetaTrader 5용 기술 지표 - 35

Get ALERTS for break of your TRENDLINES, SUPPORT LINES, RESISTANCE LINE, ANY LINE!!
1. Draw a line on the chart (Trend, support, resistance, whatever you like) and give it a name (e.g. MY EURUSD line) 2. Load the Indicator and input the Line Name the same name in Indicator INPUT so system knows the name of your line (= MY EURUSD line) 3. Get Alerts when Price breaks the line and closes Works on All Time frames and charts LEAVE A COMMENT AND IF THERE IS ENOUGH INTEREST I WILL WRITE AN EA WHICH W
FREE

Korean (한국어) ICT_SuperTrend 는 트레이더가 시장의 전체 흐름을 한눈에 파악할 수 있도록 설계된 "올인원" 도구입니다. 주요 장점은 다음과 같습니다: 하이브리드 트레이딩 시스템 **추세 추종(Trend Following)**과 **스마트 머니 컨셉 / ICT(가격 구조)**의 결합이 가장 큰 장점입니다. SuperTrend: 시장의 주요 방향(매수/매도)을 알려줍니다. ICT 컨셉: 지지/저항선과 같은 구조적 핵심 지점을 식별합니다. 명확한 진입 및 청산 시점 화살표 신호 가 추세 변화를 명확히 알려줍니다. SuperTrend 라인 은 동적 지지/저항 역할을 하며, 수익을 확정하기 위한 **트레일링 스톱(Trailing Stop)**으로 활용하기 좋습니다. 자동 유동성 레벨 탐색 (Liquidity Levels) 주요 **스윙 하이/로우(Swing Highs/Lows)**를 자동으로 스캔합니다. BSL (매수 측 유동성): 상단 저항. SSL (매도 측 유동성):

VR Cub 은 고품질 진입점을 얻는 지표입니다. 이 지표는 수학적 계산을 용이하게 하고 포지션 진입점 검색을 단순화하기 위해 개발되었습니다. 지표가 작성된 거래 전략은 수년 동안 그 효율성을 입증해 왔습니다. 거래 전략의 단순성은 초보 거래자라도 성공적으로 거래할 수 있다는 큰 장점입니다. VR Cub은 포지션 개시 지점과 이익 실현 및 손절매 목표 수준을 계산하여 효율성과 사용 편의성을 크게 높입니다. 간단한 거래 규칙을 이해하려면 아래 전략을 사용한 거래 스크린샷을 살펴보세요. 설정, 세트 파일, 데모 버전, 지침, 문제 해결 등은 다음에서 얻을 수 있습니다. [블로그]
다음에서 리뷰를 읽거나 작성할 수 있습니다. [링크]
버전 [MetaTrader 4] 진입점 계산 규칙 포지션 개설 진입점을 계산하려면 VR Cub 도구를 마지막 최고점에서 마지막 최저점까지 늘려야 합니다. 첫 번째 지점이 두 번째 지점보다 빠른 경우, 거래자는 막대가 중간선 위에서 마감될 때까지 기다립니다

The Williams Conditional Range (WCR) is a technical analysis indicator used to determine the oversold / overbought condition of the market by examining the position of the closing price in a given range formed by the extremes in the past and looking for divergences that indicate the likelihood of a reversal. It allows you to assess whether buyers or sellers have had a stronger influence on the price over a certain period of time, and to suggest further developments. The indicator is easy to inte
FREE

The purpose of using Smart money index (SMI) or smart money flow index is to find out investors sentiment. The index was constructed by Don Hays and measures the market action. The indicator is based on intra-day price patterns. The beginning of the trading day is supposed to represent the trading by retail traders. The majority of retail traders overreact at the beginning of the trading day because of the overnight news and economic data. There is also a lot of buying on market orders and shor
FREE

Unlock Consistent Results with the MACD Indicator Across Multiple Markets Experience the power of our advanced MACD indicator, designed to deliver reliable buy and sell signals on a wide range of trading pairs and timeframes. Whether you trade forex, stocks, or cryptocurrencies, our indicator adapts seamlessly to your strategy. Multi-Chart Compatibility: The MACD indicator works effortlessly across various currency pairs, stocks, and assets, providing clear entry and exit signals on every chart.
FREE

TickVelocity with Smart Alert : Real-Time Buyer vs Seller Speed Dominance **️ Discover the raw energy of the market with the TickVelocity with Smart Alert indicator. Go beyond standard volume and price action to measure the speed and momentum of price changes, revealing the true underlying dominance of buyers or sellers in real-time. This essential tool provides a clear, separate-window view of market dynamics and features a sophisticated Smart Alert System to catch explosive moves early!
FREE

An efficient, on-chart button panel that lets you switch symbols instantly. Features auto-sync with Market Watch, custom grids, and a highly customizable UI.
Stop wasting screen space with the bulky standard Market Watch window. On Chart Watchlist places a sleek, customizable dashboard directly on your chart, allowing you to scan markets and switch symbols with a single click. Designed for manual traders, scalpers, and anyone who needs to navigate multiple pairs quickly, this tool keeps yo
FREE

QuantumAlert CCI Navigator is a free indicator available for MT4/MT5 platforms, its work is to provide "alerts" when the market is inside "overbought and oversold" regions in the form of "buy or sell" signals. This indicator comes with many customization options mentioned in the parameter section below, user can customise these parameters as needful. Join our MQL5 group , where we share important news and updates. You are also welcome to join our private channel as well, contact me for the pri
FREE

STRAT Price Action Scanner – See the setup, size the risk, place the trade. Important
To place trades directly from the Trade Assistant panel, you must also install the STRAT Price Action Trade Manager EA (check the comment section) on the same terminal. The indicator sends the trade instructions; the EA is the component that actually places and manages the orders. Installation Instruction (please read) Guide to the STRAT Trading Strategy Why STRAT? Most price action trading is
FREE

The ONLY RSI Indicator You'll Ever Need - Works with ANY Broker, ANY Symbol! Finally, an RSI indicator that automatically adapts to YOUR broker's symbol naming conventions! Whether you trade Forex, Gold, Bitcoin, or Stock Indices - this universal indicator detects and monitors related symbols automatically. KEY FEATURES & BENEFITS UNIVERSAL COMPATIBILITY Auto-Detects Broker Patterns : Works with ANY broker suffix (.m, .pro, .raw, etc.) All Asset Classes : Forex, Metals (Gold/Silver), Crypto,
FREE

BinaWin NoTouch is an indicator that sends an alert signal when the trade is in the right position to wait for the breakdown of a side market.
It is specially designed to trade under the “No Touch” strategy of the Binary.Com platform with synthetic indexes N.10, N.25, N.50, N.75 and N.100
Similarly, trading can be done with the conventional CALL and PUT strategy of any Binary Options platform.
Requirements to use the indicator:
1. Have an account at Binary.Com
2. Configure the Binary.Com d
FREE

A stochastic oscillator is a momentum indicator comparing a particular closing price of a security to a range of its prices over a certain period of time. The sensitivity of the oscillator to market movements is reducible by adjusting that time period or by taking a moving average of the result. It is used to generate overbought and oversold trading signals, utilizing a 0-100 bounded range of values. This indicator show 8 stochastic on one chart.
FREE

Name: Dynamic Fibo Retracement Short Description: An intelligent tool that automates the plotting of Fibonacci Retracement levels to help you effortlessly identify key potential support and resistance zones. Full Description: Tired of manually drawing Fibonacci lines for every new market swing? The Dynamic Fibo Retracement indicator automates this crucial process for you. It intelligently scans a user-defined number of past bars to find the most recent significant high and low, then instantly pl
FREE

StrikeZone Macd Atr 는 전통적인 MACD 오실레이터를 ATR 기반으로 스케일링하여 시장 변동성에 적응하도록 설계된 고급 분석형 지표입니다.
일반 MACD가 가지는 고질적인 문제인 “변동성 무시”를 해결하고, 상승·하락 추세의 힘을 더 명확하고 직관적으로 시각화합니다. 핵심 기능 1. ATR 기반 스케일링 MACD MACD – Signal 값을 ATR 비율로 조정하여, 변동성이 큰 구간에서 과도한 신호 발생을 줄이고 변동성이 낮은 구간에서는 미세한 추세 변화를 강조합니다. 2. 색상 기반 신호선 (Fast Line) Fast 신호선은 두 가지 색상으로 표시됩니다. 녹색(Dark Green) → 골든 크로스 영역 빨간색(Red) → 데드 크로스 영역 색의 변화만으로 현재 모멘텀이 어느 쪽에 유리한지 즉시 파악할 수 있습니다. 3. 양/음수 히스토그램 분리 표시 오실레이터 값이 0 위·아래에 있을 때 Up/Down 히스토그램으로 시각화하여
추세 방향을 더 쉽게 확인할 수
FREE

Market Time Watch A clean, lightweight and essential time-tracking tool for every trader Market Time Watch is a professional on-chart time display designed for traders who need an accurate real-time clock and precise candle timing while analyzing the markets. This tool helps you instantly see current local time , server time , and candle countdown directly on your chart without any clutter or heavy UI components. Whether you scalp fast markets, swing-trade sessions, or simply need a clean time r
FREE

실제 팽이 표시기
해머나 도지나 널 캔들스틱과 다른 팽이의 진정한 의미인 균형잡힌 몸체와 심지 높이 비율로 차트에서 정확한 팽이를 감지합니다.
이 지표는 차트에서 발견된 팽이의 수에 날개 아이콘을 표시합니다.
설정에는 다음이 포함됩니다.
Number of Bars : 막대 수에 대한 검색 조정
아이콘 색상 : 아이콘 색상 변경
아이콘 코드 : 아이콘에 대한 wingdings 코드 변경 실제 팽이 표시기
해머나 도지나 널 캔들스틱과 다른 팽이의 진정한 의미인 균형잡힌 몸체와 심지 높이 비율로 차트에서 정확한 팽이를 감지합니다.
이 지표는 차트에서 발견된 팽이의 수에 날개 아이콘을 표시합니다.
설정에는 다음이 포함됩니다.
Number of Bars : 막대 수에 대한 검색 조정
아이콘 색상 : 아이콘 색상 변경
아이콘 코드 : 아이콘에 대한 wingdings 코드 변경
FREE
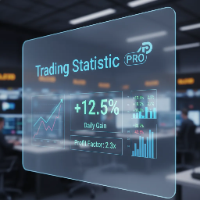
The statistical indicator for the metatrader 5 TradingStatisticPro collects statistical data on your trade, which makes it easier to assess the effectiveness of trading, the profit received and the risks. The indicator is compactly placed in the corner of the main chart of the terminal and displays the following information: 1. The profit earned. 2. Maximum drawdown. 3. The recovery factor. 4. Profit factor. 5. The ratio of profitable and unprofitable transactions (winrate). 6. Average profit a
FREE

Indicator introduction:
The indicator is calculated by volumes and prices, It is a single side indicator, only has up arrow signals. It is better to use it in conjunction with other trend indicators, and you need to find the most efficient time to use it in order to acquire a high winning probability. The indicator can send emails, alerts and notifications to you when the indicator before k line has an up arrow. The indicator's parameters can be changed, including the computation period of the
FREE

According to Bill Williams' trading strategy described in the book "Trading Chaos: Maximize Profits with Proven Technical Techniques" the indicator displays the following items in a price chart: 1.Bearish and bullish divergent bars: Bearish divergent bar is colored in red or pink (red is a stronger signal). Bullish divergent bar is colored in blue or light blue color (blue is a stronger signal). 2. "Angulation" formation with deviation speed evaluation. 3. The level for placing a pending order (

Asia Range STDV I ndicator
This Indicator is designed not only to identify the Asia session trading range and Standard Deviation levels but also to assist traders in creating a systematic entry and exit strategy based on the higher timeframe daily trend . The indicator supports both bullish and bearish scenarios, allowing traders to focus on key moments when the Asia range's high or low is "swept" (broken) in line with the confirmed trend. Strategy Overview: 1. Confirming the Daily Trend (Bul
FREE

Description Overview : Session Sentinel Pro is a lightweight, chart-based indicator that watches your account equity live and presents a clear view of daily trading performance. It provides closed and floating P&L, session and per-day maximum drawdown, symbol-level breakdowns, and automatically persists daily summaries to the MT5 Files folder so you can review recent performance across days.
Why it helps : The indicator helps traders stay disciplined by clearly showing intraday performance, max
FREE

Accuracy M1 Scalper MT5 - High-Frequency Precision Signals Accuracy M1 Scalper is a high-performance indicator developed specifically for traders operating on lower timeframes (M1 and M5). In the scalping environment, every second counts; therefore, this algorithm has been optimized to offer ultra-fast visual execution without overloading your terminal's CPU.
The indicator uses a mathematical model based on price momentum and adaptive volatility, identifying micro-trends before the explosive m
FREE

인디케이터: Currency Strength Meter Pro 시장 전반 시각화 (Market Breadth Visualization) 장점: 복잡한 차트 대신 깔끔한 "대시보드" 형태로 표시하여, 어떤 통화쌍이 강세인지 약세인지 한눈에 파악할 수 있습니다. 이점: 차트를 하나씩 확인하는 시간을 줄이고 매매할 통화쌍을 빠르게 결정할 수 있습니다. 자동 순위 및 정렬 (Auto-Ranking & Sorting) 장점: "수평 순위" 모드를 통해 "가장 강한" 통화쌍부터 "가장 약한" 통화쌍까지 자동으로 정렬합니다. 이점: 일간/주간/월간의 승자(Winners)와 패자(Losers)를 즉시 식별할 수 있어 상대 강도 전략에 유리합니다. 스마트 통화 로직 (Smart Currency Logic) 장점: 기준 통화(Base Currency)의 위치가 다른 쌍(예: EURUSD vs USDJPY)을 스마트하게 처리하여, 메인 통화의 강세 방향에 맞춰 값을 자동으로 "반전"시킵니다. 이점: 통

Simple Super Trend indicator for MetaTrader 5. A trend indicator similar to moving averages. Use it for entry and exit signals. It gives accurate signals on precise time. Works as a Trailing SL/TP. This indicator can also be used on multiple timeframes where you place it on a larger timeframe then go to a lower timeframe. Super Trend needs to be used in conjunction with other indicators like rsi, Parabolic SAR, MACD, etc to receive filtered signals.

Moving Average Crossover with Alert is a indicator that can show buy and sell arrow types of alerts supported by the platform based on the crossover of two moving averages according to the parameters given by the trader. You can change inputs by yourself. This indicator only show the arrows to buy or sell to execute the trade you have to do it by yourself. For more information see the screenshot.

거래를 다음 단계로 끌어올릴 강력한 지표를 찾고 계십니까? MQL5에서 RSI(상대 강도 지수), 이동 평균 및 Heiken-Ashi 지표의 장점을 결합한 고유한 RSI 기반 지표만 있으면 됩니다.
당사의 지표는 지연 없이 실시간 데이터를 제공하므로 정보에 입각한 거래 결정을 자신 있게 내릴 수 있습니다. 초보자부터 전문가까지 모든 수준의 트레이더에게 적합합니다.
사용자 지정 가능한 설정 및 매개 변수를 사용하여 거래 스타일 및 기본 설정에 맞게 지표를 쉽게 조정할 수 있습니다. 데이 트레이더이든 장기 투자자이든 RSI 기반 지표는 추세 반전을 식별하고 수익을 극대화하는 데 도움이 될 수 있습니다.
우리의 숙련된 개발자 팀은 비교할 수 없는 정확성과 성능을 제공하는 지표를 만들기 위해 끊임없이 노력했습니다. RSI, 이동 평균 및 Heiken-Ashi 지표를 결합하여 게임에서 앞서 나가고자 하는 트레이더를 위한 진정한 강국을 만들었습니다.
RSI, 이동 평균 및 Heiken

MT4 버전 https://www.mql5.com/en/market/product/139061 MT5 버전 https://www.mql5.com/en/market/product/139062
Half Trend Heikin Ashi 대시보드 - 스마트 멀티페어 & 멀티타임프레임 트렌드 스캐너 Half Trend Heikin Ashi 대시보드는 트레이더들이 선호하는 두 가지 지표인 Half Trend와 Heikin Ashi의 강력한 기능을 하나의 간결하고 유용한 대시보드로 결합한 혁신적인 분석 도구입니다. 한 화면에서 수십 개의 통화쌍과 여러 타임프레임을 모니터링하려는 트레이더를 위해 특별히 설계된 이 지표는 명확하고 정확한 트렌드 신호를 제공하여 잠재적인 진입 기회를 놓치지 않습니다.
주요 기능: 멀티페어 스캔 최대 30개 종목을 한 번에 모니터링하세요! 관심 종목(XAUUSD, NAS100, EURUSD 등)을 맞춤 설정할 수 있습니다.
다중 시간대 지원 M1부터 MN까지 추

이치모쿠 알림(Ichimoku Alerts)은 이치모쿠 지표를 사용하여 시장 기회를 파악하는 지표입니다. 네 가지 유형의 신호를 감지합니다. 텐칸센(Tenkansen) 또는 키준센(Kijunsen) 선에 반전 패턴이 나타나고 두 선 모두 상승 또는 하락 추세를 보일 경우, 이 지표는 알림을 전송하고 거래 규모와 잠재적 손절매 및 이익실현 수준을 자동으로 계산하는 위험 관리 도구를 생성합니다. 텐칸센 선에서 신호가 형성되면 손절매는 키준센 선에 설정됩니다. 키준센 선에서 신호가 형성되면 손절매는 가장 가까운 치코우 클라우드 선에 설정됩니다. 손절매는 특정 거리(포인트)로 수동으로 설정할 수도 있습니다. 기능 - 모든 시장 및 모든 시간대에서 작동합니다. - 텐칸센 매수, 키준센 매수, 텐칸센 매도, 키준센 매도의 네 가지 유형의 신호를 감지합니다. - 신호가 감지되면 알림을 전송합니다. - 신호가 감지되면 푸시 알림을 전송합니다. - 위험 관리 도구가 포함되어 있습니다.
슈퍼트렌드 멀티커런시 스캐너 대시보드 MT5 는 슈퍼트렌드 지표를 사용하여 여러 통화 쌍과 시간 프레임을 모니터링하도록 설계된 강력한 도구입니다. 심볼과 시간 프레임(M1에서 MN1까지)을 기준으로 신호를 정리하는 그리드 형식으로 제공됩니다. 트레이더는 전략에 맞게 특정 시간 프레임을 활성화하거나 비활성화할 수 있습니다. MT4 버전은 여기에서 확인할 수 있습니다: SuperTrend Multicurrency Scanner MT4 자세한 문서는 여기에서 클릭하세요: 문서 주요 기능: 슈퍼트렌드 통합: 기간과 승수를 포함한 완전히 사용자 정의 가능한 슈퍼트렌드 매개변수를 지원하며, 상승 트렌드를 라임 그린으로, 하락 트렌드를 빨간색으로 시각적으로 강조하고, 선의 너비를 조정하여 명확성을 높입니다. 컨플루언스 경고: 여러 시간 프레임이 동일한 트렌드 방향으로 정렬될 때 컨플루언스 신호를 강조하여 높은 신뢰도의 거래 기회를 제공합니다. 사용자 정의 경고: 팝업, 이메일 또는 푸시 알림을
거래 전략을 강화하세요. Big Candle Scanner Dashboard MT5는 여러 통화 쌍과 시간 프레임에서 대형 강세 및 약세 캔들을 감지하는 다재다능한 멀티 자산 대시보드로, 잠재적 모멘텀 변화나 변동성 스파이크를 신호합니다. 1990년대 Steve Nison 같은 트레이더가 일본 캔들 차트 작업을 통해 대중화한 고전 캔들 분석 기술에 뿌리를 둔 이 도구는 큰 가격 움직임을 활용하려는 외환 및 암호화 애호가의 필수품이 되었습니다. 동적 시장에서 트렌드 시작, 브레이크아웃 또는 반전을 식별하는 데 널리 사용되며, 대형 캔들이 주요 트렌드를 앞서는 경우가 많습니다—조기 진입 기회, 고거래량 움직임을 확인하여 리스크 관리 개선, 자동 스캔으로 화면 시간 감소 등의 이점을 제공하며, 스캘퍼, 데이 트레이더, 스윙 트레이더에게 이상적이며 외환 쌍, 지수, 금 (XAUUSD) 같은 상품, BTCUSD 같은 암호화폐에 적합합니다. Big Candle Scanner Dashboard
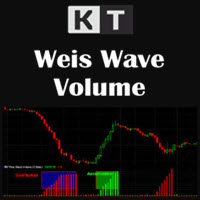
KT Weis Wave Volume은 현재 시장 추세와 가격 움직임의 방향을 기반으로 한 기술적 지표입니다. 이 지표는 거래량을 기반으로 하며, 차트에서 가격 상승 및 하락에 대한 누적 거래량을 표시합니다.
또한, 인디케이터 창에는 녹색 및 상승하는 빨간색 파형의 히스토그램이 표시됩니다.
녹색은 상승 움직임을 나타내며, 가격이 많이 오를수록 녹색 거래량도 커집니다. 빨간색은 하락 파형을 나타내며, 가격이 하락할수록 빨간색 거래량이 증가합니다. 각 파형을 분석함으로써 이 지표는 변동성이 큰 시장의 상태를 이해하는 데 도움을 줍니다.
기능 소개
모든 시장에서 가격 파형과 거래량 정보를 제공합니다. 추세의 방향성과 강도를 판단하는 데 도움이 됩니다. 사용자 설정과 색상 테마를 자유롭게 조정할 수 있습니다. 모든 시간대에서 작동합니다.
KT Weis Wave Volume 작동 방식 Weis Wave Volume은 각 파형의 거래량을 합산하여 누적 거래량 막대 차트를 생성합니다. 이

KT Price Border는 세 개의 가격 밴드로 구성된 가격 채널을 생성하여 시장의 잠재적인 고점과 저점을 식별합니다. 이러한 레벨은 동적 지지 및 저항선으로도 사용할 수 있습니다. 중앙 밴드는 트렌드 방향을 식별하는 데에도 사용할 수 있으며, 결과적으로 트렌드 추종형 지표로도 작동합니다. 또한, 사용이 간편하고 직관적인 거래 신호를 제공하여 초보 트레이더에게 큰 도움이 됩니다。
특징
대부분의 외환 통화 쌍에서 효과적으로 작동합니다. 낮은 시간 프레임과 높은 시간 프레임에서 모두 사용 가능합니다. 스캘핑, 데이트레이딩, 스윙 트레이딩에 적합합니다. 트렌드 및 역추세 거래 전략을 모두 지원합니다. 가격이 가격 밴드를 통과할 때 알림을 보낼 수 있습니다. 가격 밴드는 동적 지지 및 저항 수준으로도 활용할 수 있습니다.
가격 경계 개념 이해하기 이 지표는 볼린저 밴드와 유사하게 작동합니다. 하단 밴드는 시장의 과매도 상태를 나타내며 동적 지지 역할을 합니다. 상단 밴드는 시장의
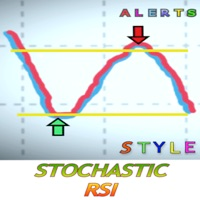
확률 적 RSI 란 무엇입니까?
확률 적 RSI ( StochRSI )은 일부 차트 플랫폼 (에서 0과 1 ) 또는 0과 100 사이의 기술 분석에 사용되는 지표이며 확률 적 발진기를 적용하여 생성됩니다 표준 가격 데이터가 아닌 상대 강도 지수 ( RSI ) 값 세트에 대한 공식. 이 버전에는 실제로 좋은 기회를 놓치지 않도록 경고가 포함되어 있습니다. 신호 구매 주문 또는 신호 판매 주문을 받으려면 매개 변수를 설정합니다. 신호를 받으려면 MetaQuotes ID를 통해 데스크탑 버전을 Metatrader 앱과 연결해야합니다. MetaQuotes ID는 MT4 / 5 앱에서 > > 채팅 및 메시지 설정에 있습니다. 바탕 화면에 도구 > > > 옵션 > > 알림이 있습니다. 바탕 화면 버전에 ID를 입력하고 활성 알림을 표시하면 바로 사용할 수 있습니다.
MT4버전을 사용해보십시오
스타일이 중요하기 때문에
촛불의 색, 배경을 밝거나 어둡게 변경하고 그리드를 넣거나 제거 할

RSIScalperPro를 소개합니다 - 메타트레이더 5용 RSI 기반의 혁신적인 인디케이터로, 1분 차트에서의 스캘핑에 최적화되어 있습니다! RSIScalperPro를 사용하면 정확한 진입 및 청산 신호를 제공하는 강력한 도구를 손에 넣을 수 있습니다. RSIScalperPro는 서로 다른 두 가지 RSI 지표를 사용하여 과매수 및 과매도 레벨에 대한 명확한 신호를 제공합니다. 2개의 RSI의 시간 프레임 및 제한 값을 원하는 대로 조정하여 트레이딩 전략에 최적화된 결과를 얻을 수 있습니다. 차트 상의 개별 화살표는 거래 진입 및 청산 타이밍을 쉽게 파악하는 데 도움이 됩니다. 또한 RSIScalperPro의 특징 중 하나는 사용자 정의 가능한 3개의 이동 평균선입니다. 이를 통해 트렌드의 방향을 판단하고 강력한 거래 신호를 확인하는 데 도움이 됩니다. 이를 통해 조기에 트렌드를 감지하고 수익성 높은 거래에 참여할 수 있습니다. 뿐만 아니라 RSIScalperPro는 새로운 거래
스토캐스틱 멀티커런시 스캐너 대시보드 MT5 는 스토캐스틱 오실레이터를 사용하여 여러 통화 쌍과 시간 프레임을 모니터링하도록 설계된 강력한 도구입니다. 심볼과 시간 프레임(M1에서 MN1까지)을 기준으로 신호를 정리하는 그리드 형식으로 제공됩니다. 트레이더는 전략에 맞게 특정 시간 프레임을 활성화하거나 비활성화할 수 있습니다. MT4 버전은 여기에서 확인할 수 있습니다: Stochastic Oscillator Multicurrency Scanner MT4 자세한 문서는 여기에서 클릭하세요: 문서 이 도구는 다음 스토캐스틱 전략을 기반으로 신호를 표시합니다: 과매수/과매도 전략: 스토캐스틱이 과매수(상위 레벨 초과) 또는 과매도(하위 레벨 미만) 구역에 진입하거나 벗어날 때 신호가 생성되어 잠재적인 반전을 나타냅니다. 역레벨 전략: 스토캐스틱이 사용자 정의 또는 자동 계산된 상위 또는 하위 레벨을 역방향으로 교차할 때 신호가 트리거되어 모멘텀의 변화를 시사합니다. 크로스오버 전략: 스
Cm Ultimate Ma Mtf MT5 로 거래 결정을 강화하세요, 다중 시간 프레임 분석을 위한 광범위한 사용자 정의와 유연성을 제공하는 강력한 이동 평균 지표. TradingView의 인기 개념에 기반하여 MT5용으로 최적화된 이 도구는 SMA, EMA, WMA, HullMA, VWMA, RMA, TEMA, Tilson T3 등 고급 MA 유형을 지원하며, 2010년대 이후 다른 시간 프레임에서 듀얼 MA를 플롯하는 능력으로 인기를 얻었습니다. 재도장하지 않고 사용자 친화적이며, 가격 및 MA 교차를 화살표로 강조하여 외환 및 암호화폐 같은 변동성 시장에서 트렌드 감지에 이상적입니다. Cm Ultimate Ma Mtf 는 multi-timeframe 유연성으로 두드러지며, 기본적으로 현재 시간 프레임이지만 다른 시간 프레임에서 두 번째 MA를 허용하여 교차 감지와 방향 기반 색상 변화 (라임 위, 빨강 아래) 를 제공합니다. 가격/MA 교차에 대한 하이라이트 바와 화살표는 입/
SSL Channel Indicator MT5 로 거래 정확도를 높이세요. 이 역동적인 도구는 혁신적인 Semaphore Signal Level (SSL) 접근 방식을 통해 가격 트렌드의 역학을 시각화하도록 설계되었습니다. MQL5와 Forex Factory와 같은 트레이딩 커뮤니티에서 대중화된 기술적 분석 개념에 뿌리를 두고 있으며, 이 인디케이터는 고점과 저점에 각각 10주기 단순 이동 평균(SMA)을 사용하여 적응형 가격 채널을 형성합니다. 트렌드 변화를 식별하는 단순함과 효과로 유명하며, 복잡한 계산 없이 명확한 반전 또는 지속 신호를 찾는 트레이더들에게 선호됩니다. SSL Channel Indicator는 "플립 기법"을 사용하여 트렌드 형성과 변화를 신호화하는 데 탁월하며, 가격은 SMA 기반 고점/저점 채널 위아래로 번갈아 움직입니다. 가격이 고점 SMA 아래에 있을 때 고점 채널을 유지하고, 가격이 저점 SMA 위에 있을 때 저점 채널을 유지하여 트렌드 반전 또는 지속
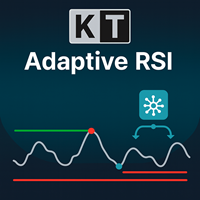
KT Adaptive RSI 지표는 고전적인 RSI에 적응형 모듈을 통합하여 현재 시장 상황에 따라 동적으로 변하는 과매수 및 과매도 수준을 식별합니다. 전통적인 RSI는 값이 70 이상이면 과매수, 30 이하이면 과매도로 간주하지만, 이는 모든 종목에 항상 정확하게 적용되지는 않습니다. 적응형 모듈은 과거 데이터를 신속히 분석하여 최적의 과매수·과매도 임계값을 자동으로 찾아냅니다. 이를 통해 트레이더는 실시간 시장 움직임에 맞춰 보다 정밀한 매수·매도 결정을 내릴 수 있습니다.
평균회귀 진입
특정 종목이 극단적인 움직임 이후 평균 가격으로 되돌아가는 경향이 있다면, 지표가 제공하는 동적 과매수·과매도 구간을 활용하여 정확하게 진입할 수 있습니다. 이 방식은 단기 가격 변동을 포착하고 빠르게 수익을 확보하는 데 유리합니다.
추세추종 진입
강한 추세를 보이는 종목의 경우, 이러한 동적 구간을 사용하여 추세 방향으로 진입할 수 있습니다. 이를 통해 자신 있게 가격 움직임을 따라가면서
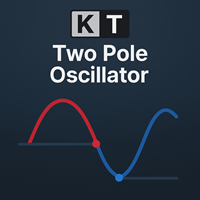
KT Two Pole Oscillator는 고급 평활화 기법을 사용하여 트레이더가 정확한 시장 신호를 포착할 수 있도록 설계된 지표입니다. 편차 기반 계산과 독특한 이중 극 필터링 방식을 결합하여, 트레이더가 쉽게 이해하고 활용할 수 있는 명확한 시각적 신호를 제공합니다. 이 지표는 시장 상황에 적응하는 특성이 있어 추세장이나 횡보장에서도 안정적인 성능을 유지하며, 다양한 상황에서 활용 가능한 강력한 도구입니다.
주요 기능
이중 극 필터링: 오실레이터 신호를 부드럽게 하여 노이즈를 제거하고 시장의 모멘텀과 추세 방향을 선명하게 보여줍니다. 과매수/과매도 감지: 시장이 극단적인 수준에 도달했을 때 이를 식별하여 반전이나 되돌림 가능성을 알려줍니다. 1에서 -1로 스케일: 명확한 오실레이터 수준으로 인해 특히 0 부근에서 발생하는 잘못된 신호를 줄여줍니다. 완전한 사용자 설정 가능: 오실레이터 길이, 색상 테마 등 다양한 설정을 개인의 트레이딩 스타일에 맞게 조정할 수 있습니다. 다양

이 공급 및 수요 영역 표시기는 차트에 영역을 그리고 가격이 영역에 도달하거나 영역을 깨면 경고를 보냅니다. 구역 대신 일반 이중 상단/하단에 대해 경고하는 데 사용할 수도 있습니다. RSI, ADX, 볼륨 및 발산 필터를 사용하여 가장 강력한 설정만 필터링할 수 있습니다. 고유한 규칙 및 기술과 결합하여 이 표시기를 사용하면 자신만의 강력한 시스템을 생성(또는 강화)할 수 있습니다. 이 지표는 이미 공급 수요에 대해 잘 알고 있고 거래를 마감하거나 개설하기로 결정할 때 이를 어떻게 사용할 수 있는지에 대해 이미 잘 알고 있는 경험 많은 거래자를 위한 것입니다. 특징
다음 분기가 지원됩니다. MACD, OsMA, RSI, CCI, Stochastics 및 Awesome. 구역에는 3가지 색상이 있습니다(입력으로 조정 가능). 테스트되지 않은 영역의 경우 어두운 색상, 테스트된 영역의 경우 중간 색상, 깨진 영역의 경우 밝은 색상. 구역 외경의 가격과 구역 테스트 금액이
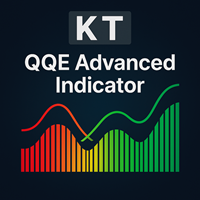
KT QQE Advanced 는 클래식 QQE 오실레이터를 색상 히스토그램과 빠른·느린 Trailing Line(TL) 로 재구성하여 더 정확하게 표현한 개선 버전입니다.
기존 QQE 와 달리, KT QQE Advanced 는 히스토그램 형태에 과매수/과매도 레벨을 표시해 추세의 과열 여부를 직관적으로 확인할 수 있습니다.
활용
MTF 스캐너로 모든 시간대에서 매수·매도 신호를 즉시 탐색. 트렌드 방향을 더욱 정확히 파악. 과매수·과매도 구간을 탐지. 가격 모멘텀을 가시화.
입력값 RSI 기간 스무딩 기간 MTF 스캐너 알림 설정
QQE란? QQE는 Quantitative Qualitative Estimation 의 약자로, 초‑스무딩 RSI 와 ATR 을 결합해 만든 오실레이터입니다. 일반 RSI 대신 Wilder RSI 를 사용하며, 이는 특수한 EMA 방식으로 평활화됩니다. Wilder 평활식 = 이전 MA + (1/n × (종가 − 이전 MA))

브로커리지의 기술적 및 논리적 조작으로 인해 저는 다음과 같은 기능을 가진 수많은 전략을 결합한 이 후방 지표를 제공하기 위해 먼 길을 왔습니다.
시장 추세 식별: 시장의 전반적인 추세를 이해합니다.
반전 지점: 시장이 방향을 바꿀 수 있는 잠재적 지점을 식별합니다.
진입 및 종료 지점: 거래에 진입하고 종료할 최적의 시기를 결정합니다.
이 지표를 사용하는 방법에 대한 포괄적인 이해를 위해 첨부된 비디오를 시청하세요. 또한 제공된 지표를 다운로드하여 완전한 분석을 확인하세요. ...................................... https://www.mql5.com/en/market/product/92909
AND https://www.mql5.com/en/market/product/109519

Astral Pulse Oscillator — The Celestial Flow & Energy Resonance Tool Step into the mystic rhythm of market energy with the Astral Pulse Oscillator , a non-repainting fusion of celestial flow mapping and harmonic pulse resonance . This indicator translates hidden energetic fluctuations into radiant visual waves, allowing traders to interpret the unseen emotional tide that moves price — from euphoric expansions to ethereal contractions. Within its luminous subwindow, two astral forces dance: Ce
Volatility Distance Indicator The Volatility Distance Indicator measures in real time the distance between current price and the moving averages you choose, expressed in points . Its purpose is to provide a clear, objective, and quantitative view of the market’s expansion relative to its equilibrium zones , allowing you to instantly assess whether price is in a phase of overextension, compression, or neutrality . Key Features: Point-based measurement: displays the exact distance between current
FREE

Trend Reversal Candles is an indicator designed to highlight common candlestick reversal and continuation patterns directly on the chart.
It marks detected setups with arrows and labels for easier visual recognition, reducing the need for manual pattern searching. Detected Patterns Bullish and Bearish Engulfing Hammer and Hanging Man Shooting Star Doji variations Other widely used reversal setups Features Displays arrows and pattern names on the chart Works on any symbol (Forex, Gold, Indices, C
그만큼 FVG 존 인디케이터 MT5 시장에서 공정가치 갭(FVG)을 식별하도록 설계된 강력한 도구로, 공정가치와 시장 가격 간의 가격 불균형을 강조합니다. 이러한 갭의 정확한 식별을 통해 트레이더는 잠재적인 시장 진입 및 종료 지점을 파악하여 정보에 입각한 거래 결정을 내리는 능력을 크게 향상시킵니다. 직관적이고 사용자 친화적인 인터페이스를 갖춘 FVG Zone Indicator는 공정 가치 갭에 대한 차트를 자동으로 스캔하여 가격 차트에 이러한 구역을 실시간으로 표시합니다. 이를 통해 트레이더는 다가올 가격 수정 또는 추세 지속을 나타낼 수 있는 잠재적인 가격 불균형을 빠르고 쉽게 인식할 수 있습니다. 주요 특징은 다음과 같습니다. 실시간 갭 감지: FVG가 나타나면 자동으로 식별하여 표시합니다. Pips 단위로 갭 크기 표시: 이 지표는 식별된 각 갭의 크기를 핍 단위로 표시하여 트레이더가 갭의 중요성을 이해하는 데 도움이 됩니다. 현재
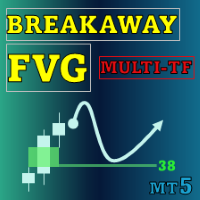
Special offer : ALL TOOLS , just $35 each! New tools will be $30 for the first week or the first 3 purchases ! Trading Tools Channel on MQL5 : Join my MQL5 channel to update the latest news from me Breakaway Fair Value Gaps (FVG) 도구는 트레이더가 가격이 균형에서 벗어난 영역을 식별할 수 있도록 설계된 최첨단 솔루션으로, 수정 확률에 대한 심층적인 통찰을 제공합니다. 이 도구는 중요한 신호를 강조할 뿐만 아니라 의사결정 정확성을 높이기 위한 고급 기능도 포함하고 있습니다. MT4 버전 보기: Breakaway Fair Value Gaps MT4 다른 제품 보기: 모든 제품 Breakaway FVG의 주요 기능 1. Breakaway Fair Value Gap이란 무엇입니까?

KT Psar Arrows는 표준 파라볼릭 SAR 지표를 사용하여 차트에 화살표를 표시합니다. 캔들의 고가가 SAR에 닿을 때 상승 화살표가 표시되고, 캔들의 저가가 SAR에 닿을 때 하락 화살표가 표시됩니다. 신호는 봉이 마감되기를 기다리지 않고 실시간으로 생성됩니다.
특징
Parabolic SAR 지표를 활용한 거래 전략을 실험하고 싶은 트레이더에게 유용한 도구입니다. 시장 반전 포인트를 찾는 데 사용할 수 있습니다. 사용자 정의 PSAR 입력 지원. MT4의 모든 알림 기능을 지원합니다.
주의사항: Parabolic SAR은 후행성 및 엄격한 기계적 지표입니다. 모든 잠재적 거래는 명확히 정의된 규칙에 따라 필터링해야 합니다.
입력 파라미터 PSAR 스텝: 스텝 값을 입력하세요. PSAR 최대값: 최대값을 입력하세요. PSAR 점 표시: PSAR 점을 표시하거나 숨길 수 있습니다. PSAR 점을 표시하지 않아도 화살표는 정상 작동합니다. 나머지 입력 항목은 직관적
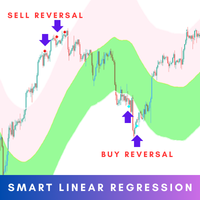
The Smart Linear Regression indicator is a powerful, non-repainting tool designed for traders looking for enhanced accuracy in market analysis. Unlike the typical linear regression channels that often repaint, this indicator provides reliable insights without changing past values, making it more trustworthy for forecasting future price movements. MT4 Version - https://www.mql5.com/en/market/product/124893/ Overview: The Smart Linear Regression Indicator goes beyond the basic linear regr

KT MACD 다이버전스는 가격과 오실레이터 사이에 형성되는 일반 다이버전스와 숨겨진 다이버전스를 보여줍니다. 만약 당신의 거래 전략이 추세 반전을 예측한다면, MACD의 일반 다이버전스를 활용하여 잠재적인 전환 지점을 예측할 수 있습니다. 추세 지속을 기반으로 하는 전략이라면 MACD의 숨겨진 다이버전스가 적합합니다.
KT MACD 다이버전스의 한계
MACD 다이버전스를 단독 진입 신호로 사용하는 것은 위험할 수 있습니다. 모든 다이버전스가 반전 신호로 해석될 수는 없습니다. 더 나은 결과를 얻으려면 가격 행동 및 기타 분석 기법과 함께 사용하는 것이 좋습니다.
기능 소개
가격과 오실레이터 간의 일반 및 숨겨진 다이버전스를 표시합니다. 비대칭 다이버전스는 정확도를 높이고 혼란을 줄이기 위해 제거됩니다. 추세 반전 및 추세 지속 전략 모두에 사용할 수 있습니다. EA(Expert Advisor)에 완벽하게 통합 가능합니다. 진입뿐만 아니라 청산 시점에도 활용할 수 있습니다. 모든

Highly configurable Average True Range (ATR) indicator.
Features: Highly customizable alert functions (at levels, crosses, direction changes via email, push, sound, popup) Multi timeframe ability Color customization (at levels, crosses, direction changes) Linear interpolation and histogram mode options Works on strategy tester in multi timeframe mode (at weekend without ticks also) Adjustable Levels Parameters:
ATR Timeframe: You can set the lower/higher timeframes for ATR. ATR Bar Shift: you
FREE

100PIPSsignals — 금(M1)용 고속 EMA 크로스오버 시스템 1분 차트에서 금 CFD를 위해 설계된 경량 EMA 크로스오버 지표입니다. 명확한 화살표와 금색 원으로 저위험 진입 시점을 표시하고, 설정 가능한 최소 핍 목표가에 따라 움직임을 검증하며, 알림/알림을 보낼 수 있습니다.
작동 원리(간단) 이 지표는 두 가지 지수 이동 평균(고속 EMA와 중간 EMA)을 사용합니다.
고속 EMA가 중간 EMA를 상향 교차하면 매수 신호 화살표가 나타나고, 하향 교차하면 매도 신호 화살표가 나타납니다.
다음 봉의 시가에 금색 원이 표시되어 실제 제안 진입 가격을 나타냅니다.
이 지표는 진입 후 가격 변동을 확인하여 각 신호를 검증합니다. 설정 가능한 최소 핍 목표가에 도달하지 못한 신호는 제거됩니다. 검증된 거래는 차트에 핍 이득과 함께 표시됩니다.
XAU(금) CFD, 1분 시간대에 사용 가능하며, 거래 전 상위 시간대를 확인하여 시그널을 확인하세요. 주요 기능 금(
설명
Candlestick Pattern Analyzer는 재량적(discretionary) 및 시스템트레이딩(trading system) 트레이더를 위해 설계된 고급 도구로, 주요 일본식 캔들스틱 패턴을 자동으로 식별하고 과거 성과에 대한 상세한 통계 분석을 제공합니다. 이 인디케이터는 패턴의 실제 효과를 검증하고, 추세·핵심 가격대·거래량 등 확인 필터와 명확한 리스크 관리 전략과 함께 사용하고자 하는 트레이더에게 이상적입니다. 주요 기능 20개 이상의 캔들스틱 패턴 자동 식별 (Engulfing, Doji, Marubozu, Hammer, Stars, Harami 등) 각 패턴 발생 후 지정된 수의 바(bar) 동안 평균 및 총 손익 계산 검출된 패턴의 총 개수를 표시하여 빈도를 객관적으로 평가 그래프 위에 색상 구분된 박스와 텍스트로 각 패턴 시각적 표시 신규 패턴 감지 시 실시간 푸시 알림 및 경고 제공 패턴 활성화 여부, 색상, 분석 기간, 데이터 표시 위치 등 완전 설
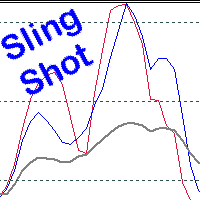
Scalping, Mean reversion or Position trading strategy
Get into an established trend on a pullback in the market. Use the Pinch in the indicator for profit taking. Use the Pinch as a mean reversion strategy, scalping back to a moving average line.
Input Parameters Fast Sling Shot configuration. Slow Sling Shot configuration. Dual Sling Shot configuration. Price line configuration. Trigger zones or levels. Example of Sling Shot trade idea: Price line sets the mood, below the baseline level (50)
Time Dashboard MT5 is a powerful and user-friendly MetaTrader 5 indicator designed to provide real-time time zone and clock information directly on your trading chart. Ideal for forex traders and global market participants, this tool displays server time, local time, and the time difference between them, enhancing your ability to manage trades across different time zones. Key Features : Real-Time Time Display : Shows current server time, local time, and their respective time zones with precise o
FREE

Price and Spread Indicator
Version: 1.0 Developer: Creative Tech Solutions Website: https://www.creativetechsolutions.co.uk
Overview The Price and Spread Indicator is a great tool for MetaTrader 5 that displays the Ask and Bid prices along with the spread directly on the chart. This indicator provides real-time updates and allows traders to make informed decisions based on accurate price information.
Features - Real-time Price Updates: Continuously updates Ask and Bid prices. - Spread Disp
FREE

This indicator is based on the Moving Average indicator. It helps the user identifying whether to buy or sell. It comes with an alert that will sound whenever a new signal appears. It also features an email facility. Your email address and SMTP Server settings should be specified in the settings window of the "Mailbox" tab in your MetaTrader 5. Blue arrow up = Buy. Red arrow down = Sell. Line = Trailing Stop. You can use one of my Trailing Stop products that automatically move the Stop Loss and
FREE
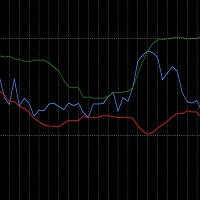
The RSI_BBands is a custom indicator designed to combine the Relative Strength Index (RSI) and Bollinger Bands (BB) for enhanced market analysis. It calculates the RSI using a specified period (default 14) and overlays Bollinger Bands around the RSI values, with adjustable parameters for the Bollinger Bands period and deviation. You can find more free products HERE . If you're looking for a low risk EA , check the Silent Pressure EA .
Key Features: RSI Calculation: The RSI is calcul
FREE

Range Perfect 지표 소개 Range Perfect(RP)는 MX Robots에서 개발한 독자적인 MetaTrader 5 지표로, 횡보장이나 추세 피로 구간에서 거래하는 트레이더를 위해 설계되었습니다. 이 지표는 시장의 피로 구간을 감지하고 XAUUSD, EURUSD, 주요 외환 통화쌍, 비트코인과 같은 암호화폐, 그리고 기타 변동성이 큰 자산에서 고확률 반전 지점을 표시합니다. 여러 확인 단계를 필요로 하는 일반적인 지표들과 달리, Range Perfect는 단독으로도 강력한 거래 전략으로 기능합니다. 제공된 예시와 영상에서 볼 수 있듯이 RP는 다른 도구와 결합하지 않아도 고품질의 매수·매도 신호를 제공합니다. 다른 기술 도구와 결합하면 정확도는 85% 이상으로 향상될 수 있습니다. RP는 인공지능 알고리즘 기반으로 개발되었으며 시장 구조, 추세 피로, 그리고 보이지 않는 지지·저항 영역을 높은 정확도로 탐지합니다. Range Perfect의 독창성 Range Perfe
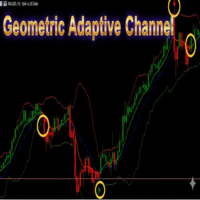
Geometric Adaptive Channel MT5 By Grok(xAI)
*A next-generation adaptive channel based on multiplicative geometry and spectral analysis using the Discrete Fourier Transform (DFT).* NOTE: The MA Gaussiana indicator is also shown in the screenshots. ---
### What Is It and How Does It Work? **Geometric Dynamic Channel MT5** is an **innovative channel indicator** that **does not use moving averages, RSI, MACD, or ATR**. Instead, it applies **advanced geometric calculations** on log-scale price
FREE

분석 대시보드는 과거 및 현재 거래를 분석하고, 추가 원형 차트를 통해 세부 정보 보기로 볼 수 있는 분석 대시보드를 제공하는 지표입니다.
주로 네 가지 분석 범주가 고려됩니다. 1) 성과 지표 2) 거래 행동 지표 3) 실행 품질 지표 4) 포지션 수준 지표.
네 가지 일반적인 분석 지표는 아래와 같이 더욱 구체적인 지표로 세분화됩니다.
성과 지표:
총이익 총손실 전체 이익률 전체 기대수익률 전체 승률 평균 위험 보상률 최대 손실률 최대 상승률 이 모든 지표는 원형 차트를 통해 표시되는 차트별 지표도 있습니다.
거래 행동 지표:
총 거래 총 수익 총 손실 총 평균 보유 시간 사용된 평균 거래 규모 손절매로 중단된 총 거래 손절매로 중단된 총 거래 총 수동 손절매 이러한 지표는 사용된 평균 거래 규모를 제외하고 차트별로 표시됩니다.
실행 품질 지표:
평균 슬리피지 평균 진입 스프레드 평균 청산 스프레드 총 수수료 + 스왑 수수료 총 이익에 미치는 영향 총 손실에 미치
FREE

This multi-timeframe indicator identifies the market's tendency to trade within a narrow price band. [ Installation Guide | Update Guide | Troubleshooting | FAQ | All Products ]
It is easy to understand Finds overbought and oversold situations Draws at bar closing and does not backpaint The calculation timeframe is customizable The red line is the overbought price The green line is the oversold price It has straightforward trading implications. Look for buying opportunities when the market is o
FREE

The "Alligator" indicator is a powerful technical analysis tool designed to assist traders on the MetaTrader 5 (MT5) platform in identifying market trends and potential price reversal points. This indicator is based on a concept developed by Bill Williams, a renowned technical analyst in the world of trading. How the Indicator Works: The Alligator indicator operates by using three Moving Average (MA) lines with different periods. These three lines are: Jaws: This is a Moving Average line with a
FREE
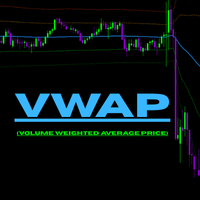
PVWAP Improved MT5 – 고급 Volume Weighted Average Price 지표 PVWAP Improved MT5 는 개인적으로 개발한 VWAP 지표를 개선하고 최적화한 버전입니다. 거래량 가중 평균가와 여러 표준편차 밴드를 함께 표시하여, 잠재적인 지지/저항 구간과 시장 모멘텀 약화 영역을 파악하는 데 도움을 줍니다. 모든 시간대에서 동작하며 많은 데이터에서도 빠르고 안정적으로 작동합니다. 지표의 목적 VWAP 는 가장 많은 거래량이 체결된 평균 가격을 의미하며, 시장이 공정 가치 대비 어떤 위치에 있는지 판단하는 핵심 기준입니다. 주요 활용: 가격이 VWAP 위에 있을 때: 상승 우위 가격이 VWAP 아래에 있을 때: 하락 우위 표준편차 밴드 (+1, +2, -1, -2) 는 과매수/과매도 영역을 표시 진입, 청산, 반등 구간을 판단하는 데 도움 시장이 추세 구간인지 평균회귀 구간인지 분석하는 데 유용 인트라데이, 스캘핑, 스윙 트레이더에게 특히 적합합니다.

The indicator My Big Bars can show bars (candles) of a higher timeframe. If you open an H1 (1 hour) chart, the indicator puts underneath a chart of H3, H4, H6 and so on. The following higher timeframes can be applied: M3, M5, M10, M15, M30, H1, H3, H4, H6, H8, H12, D1, W1 and MN. The indicator chooses only those higher timeframes which are multiple of the current timeframe. If you open an M2 chart (2 minutes), the higher timeframes exclude M3, M5 and M15. There are 2 handy buttons in the lower r
FREE

Totally linked to the result of a movement and the duration he had. Its height records how many ticks the asset walked during a given movement, its width shows us the duration that movement had. Its configuration must be in line with the Weis Wave Indicator configuration to observe the movement force and can indicate a possible accumulation or distribution of the movement;
FREE

The indicator draws daily support and resistance lines on the chart, as well as the Pivot level (reversal level).
Adapted to work in MT5
The standard timeframe for calculating support and resistance levels is D1. You can choose other timeframes according to your strategy (for example, for M1-M15, the optimal timeframe for calculations is H1)
The function for calculating support and resistance levels has been updated; in this calculation option, fibonacci levels are taken into account, respec
FREE
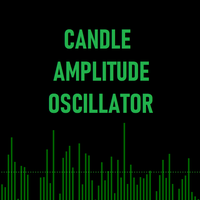
캔들 진폭 오실레이터 (Candle Amplitude Oscillator) Candle Amplitude Oscillator를 통해 시장 변동성에 대한 명확한 관점을 얻으세요. 이 가볍고 효율적인 도구는 단순한 가격 분석을 넘어 각 캔들 안에 담긴 진정한 에너지를 보여주어, 더 나은 정보에 기반한 트레이딩 결정을 내릴 수 있도록 돕습니다. 시장이 활발한지 혹은 조용한지 추측하는 대신, 이 지표는 모든 종목과 모든 타임프레임에서 작동하는 정확하고 표준화된 변동성 측정값을 제공합니다.
캔들 진폭이란 무엇인가요? 캔들 진폭은 캔들 하나가 고점에서 저점까지 움직인 총 거리를 측정합니다. 그 후 지표는 이 범위를 보편적인 백분율 값으로 변환합니다. 이는 EUR/CHF와 같이 변동성이 적은 외환 페어부터 비트코인과 같은 변동성이 큰 암호화폐에 이르기까지, 완전히 다른 금융 상품들의 변동성을 표준화된 방식으로 비교할 수 있게 해주는 핵심적인 장점입니다. 2%의 진폭 바는 어디에서나 동일한 의미
FREE

The Keltner Channel Pro is a modern and enhanced version of the classic Keltner Channel , designed for traders who want to identify trends, reversals, and overbought/oversold zones with greater accuracy. Built with EMA (Exponential Moving Average) and ATR (Average True Range) , this indicator automatically adapts to market volatility, providing dynamic channels that help filter noise and improve trade timing. Key Features: Main channel (upper, middle, and lower) based on EMA + ATR. Optional ad
FREE
MetaTrader 마켓 - 거래자를 위한 로봇 및 기술 지표는 거래 터미널에서 바로 사용할 수 있습니다.
The MQL5.community 결제 시스템은 MQL5.com 사이트의 모든 등록된 사용자가 MetaTrader 서비스에서 트랜잭션을 수행할 수 있습니다. 여러분께서는 WebMoney, 페이팔, 또는 은행 카드를 통해 자금을 예치하거나 인출하실 수 있습니다.
트레이딩 기회를 놓치고 있어요:
- 무료 트레이딩 앱
- 복사용 8,000 이상의 시그널
- 금융 시장 개척을 위한 경제 뉴스
등록
로그인
계정이 없으시면, 가입하십시오
MQL5.com 웹사이트에 로그인을 하기 위해 쿠키를 허용하십시오.
브라우저에서 필요한 설정을 활성화하시지 않으면, 로그인할 수 없습니다.