Kaufmans AMA Candle

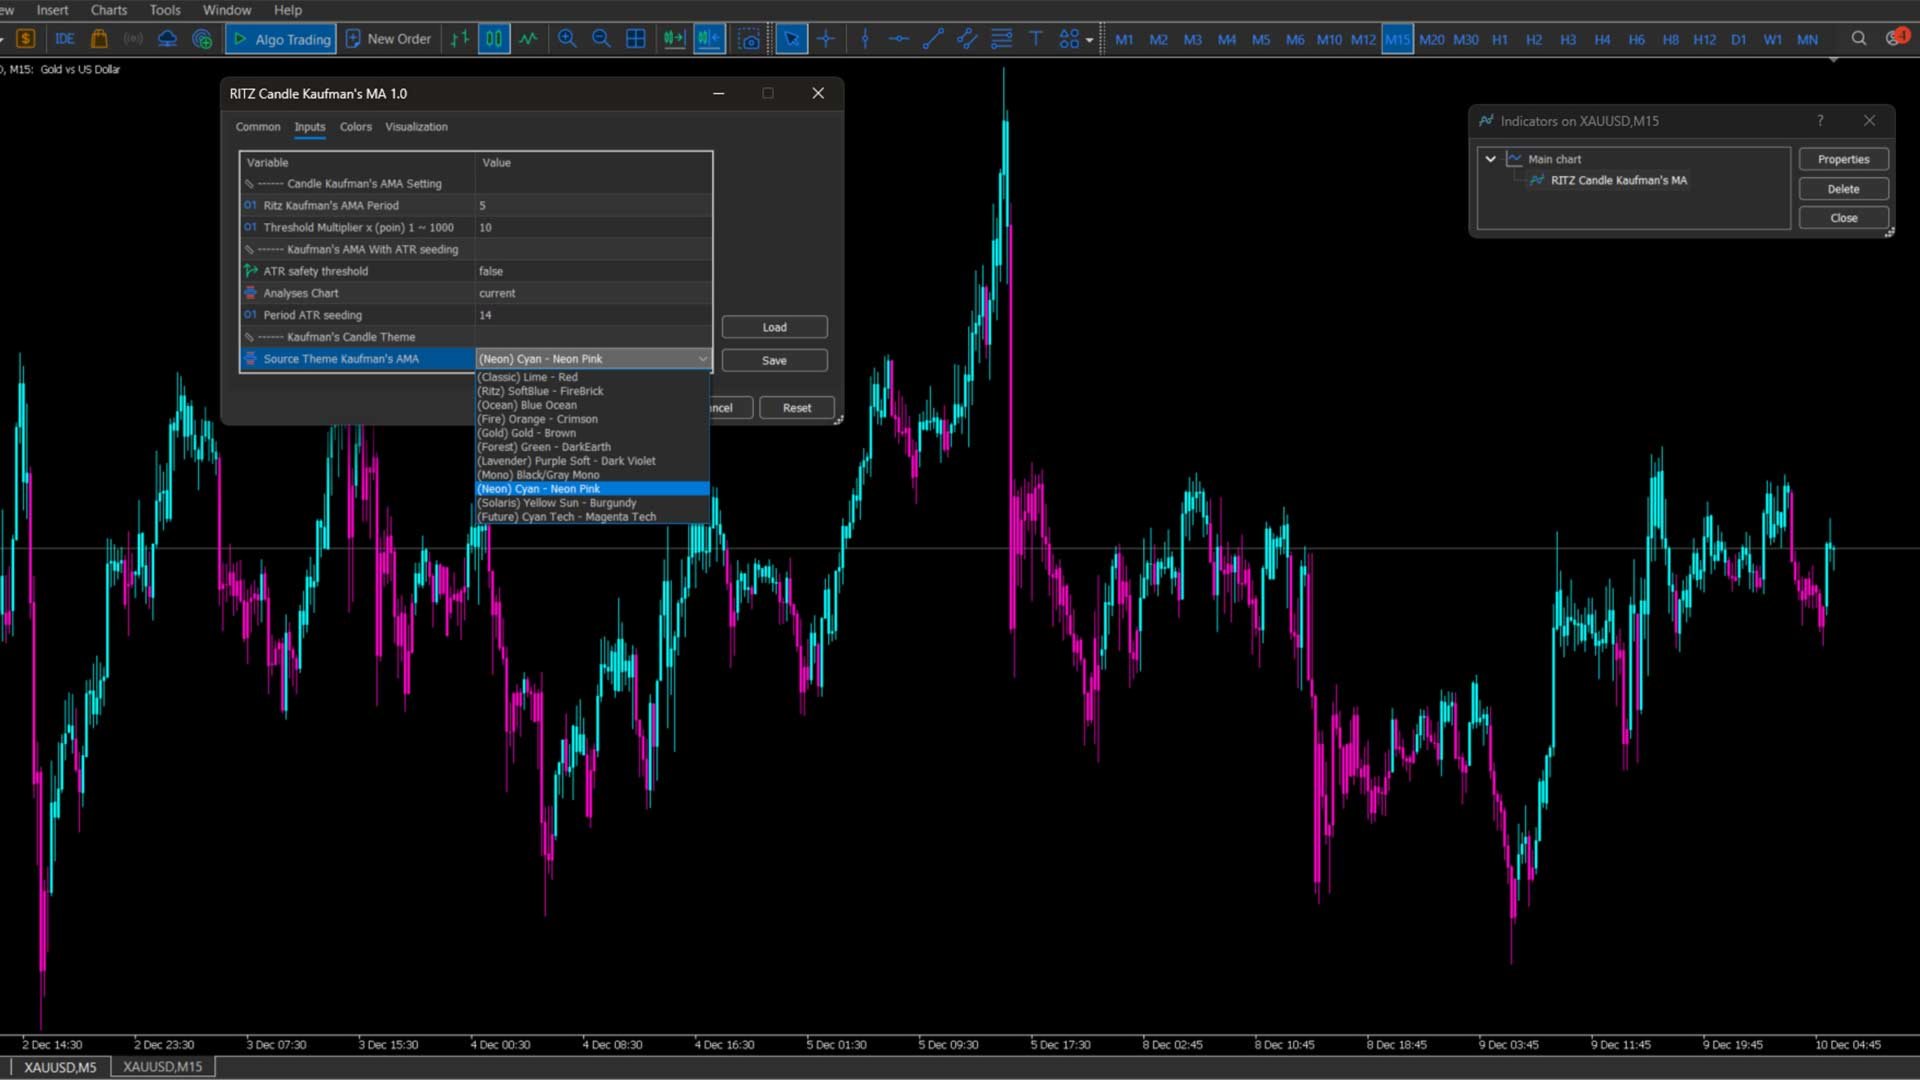
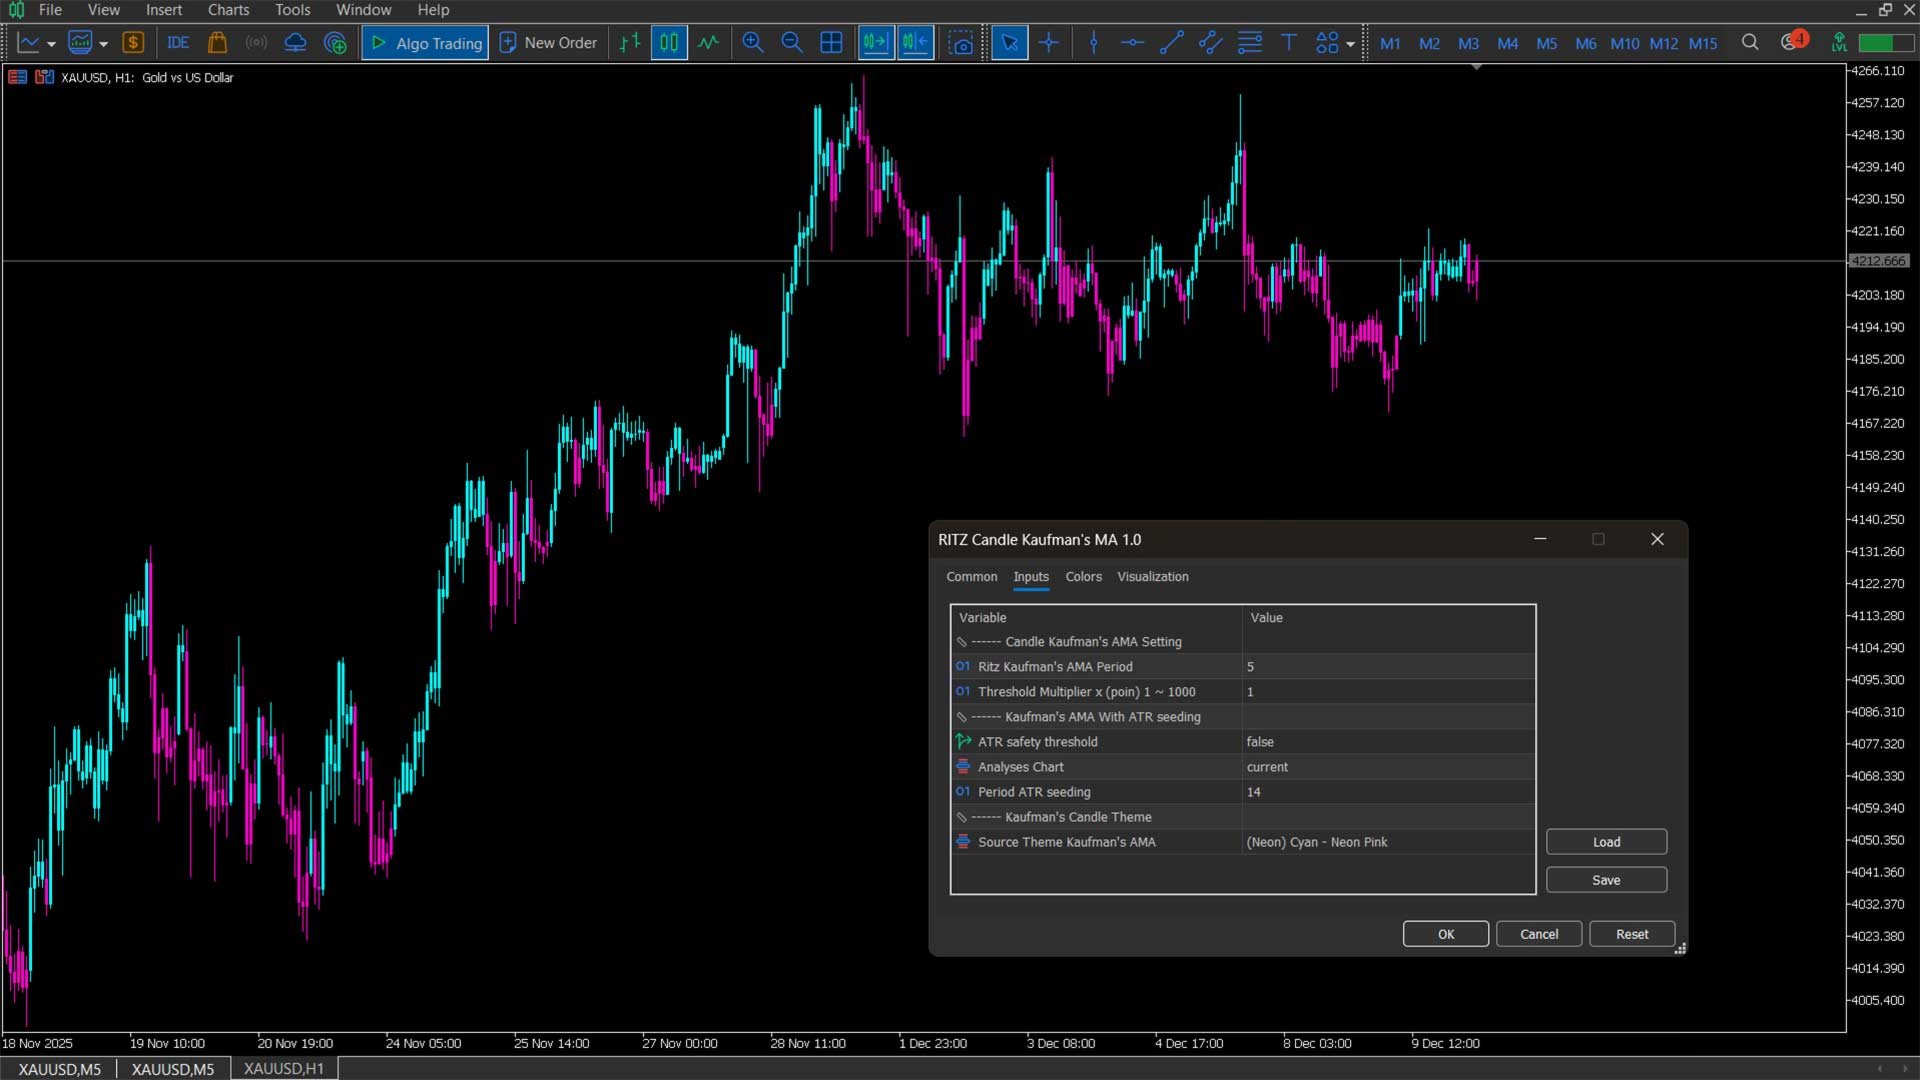
RITZ Candle Kaufman’s AMA

is a precision market-flow indicator built around Kaufman’s Adaptive Moving Average (KAMA / AMA) — a dynamic smoothing algorithm that automatically adjusts to changing volatility.
This enhanced version interprets AMA momentum directly into smart candle-color signals, giving traders a clean, noise-filtered view of trend strength and directional bias.

Where most indicators repaint or react too slowly, RITZ Candle AMA delivers stable, non-repainting color shifts based on real, confirmed price movement.
The result: clear visual guidance that works consistently across all timeframes — from fast scalping charts to MN1 macro structure.

“Clean trend-flow visualization powered by Kaufman’s Adaptive MA — stable, non-repainting, and precision-adaptive.”

Key Highlights

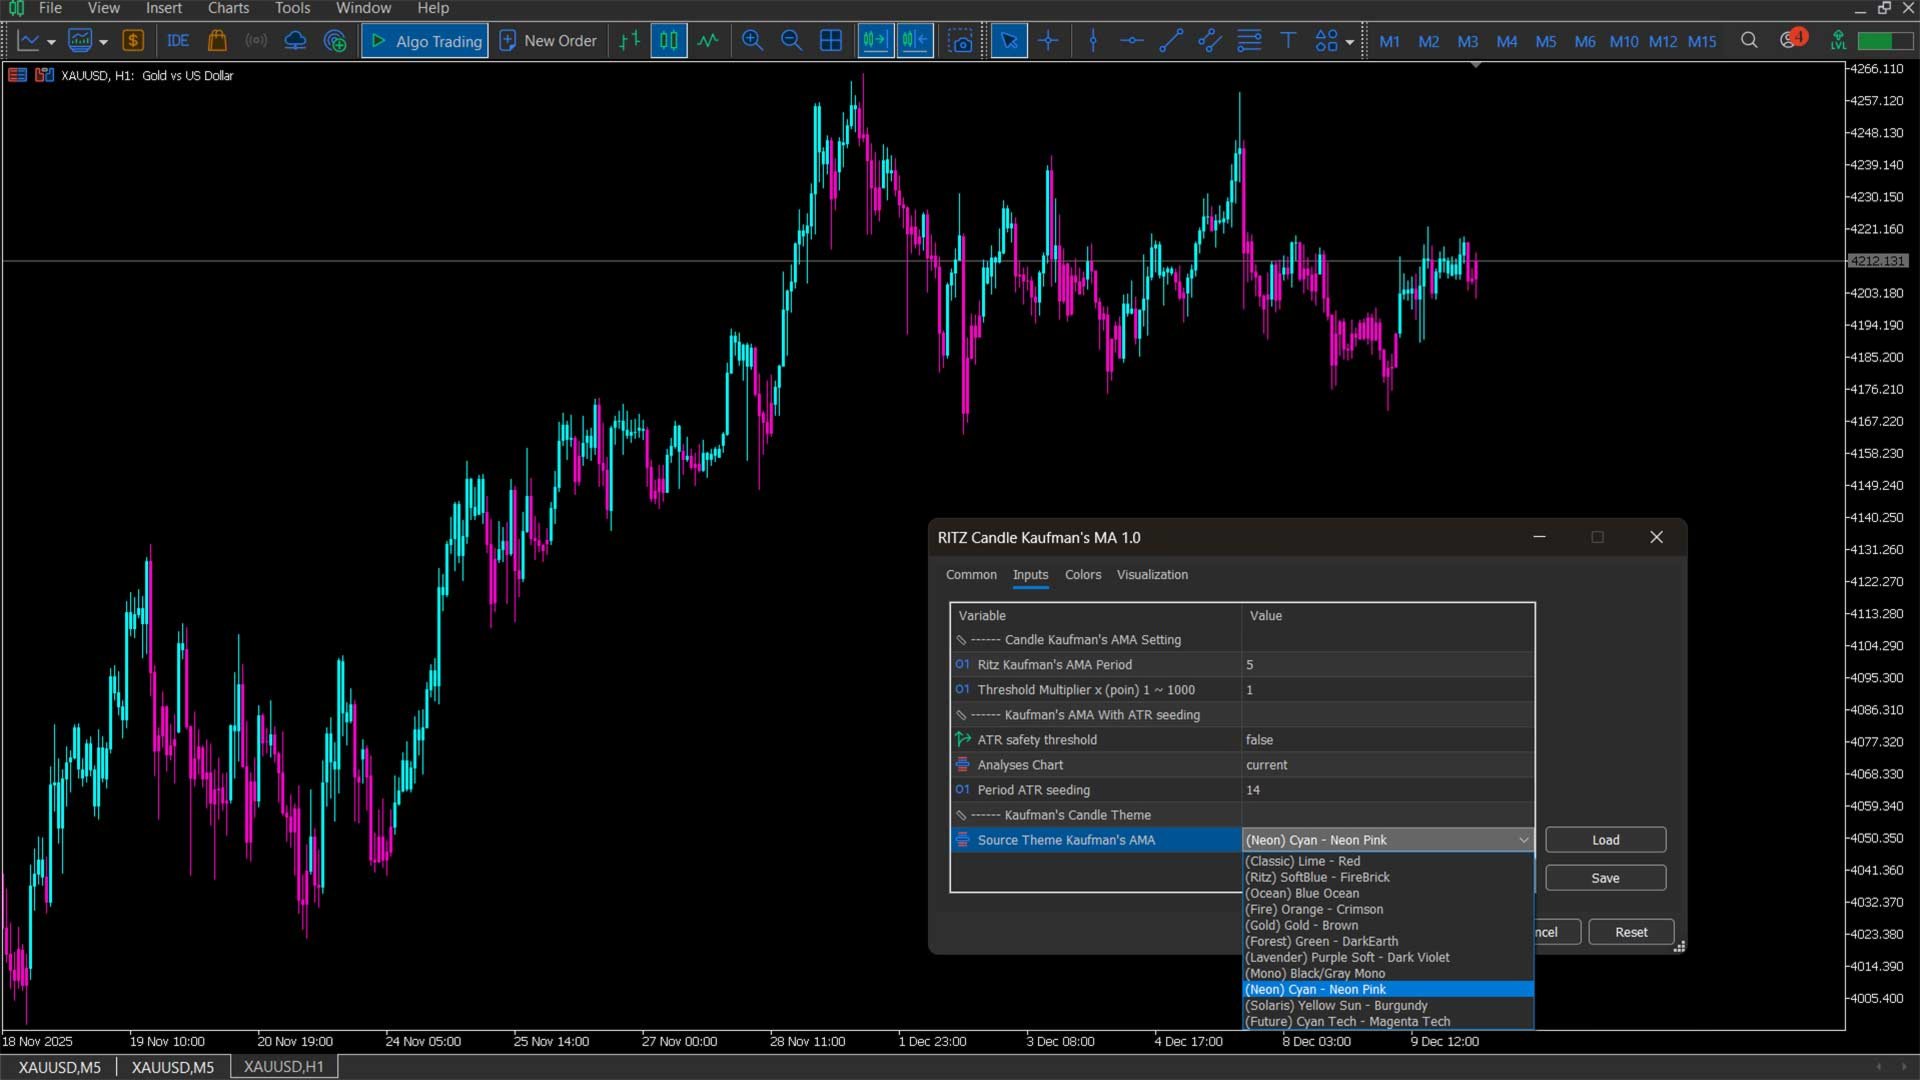
Adaptive Trend Coloring

Price candles are automatically colored based on the slope and acceleration of Kaufman’s AMA, helping you see trend continuation, exhaustion, and potential reversals at a glance.

Non-Repainting Logic

The indicator uses confirmed bars only.
No repainting. No ambiguity. What you see on the chart is what the market printed.

Volatility-Aware Precision

AMA reacts faster during high-volatility phases and slows down during consolidation — producing smooth, reliable signals without whipsaws.

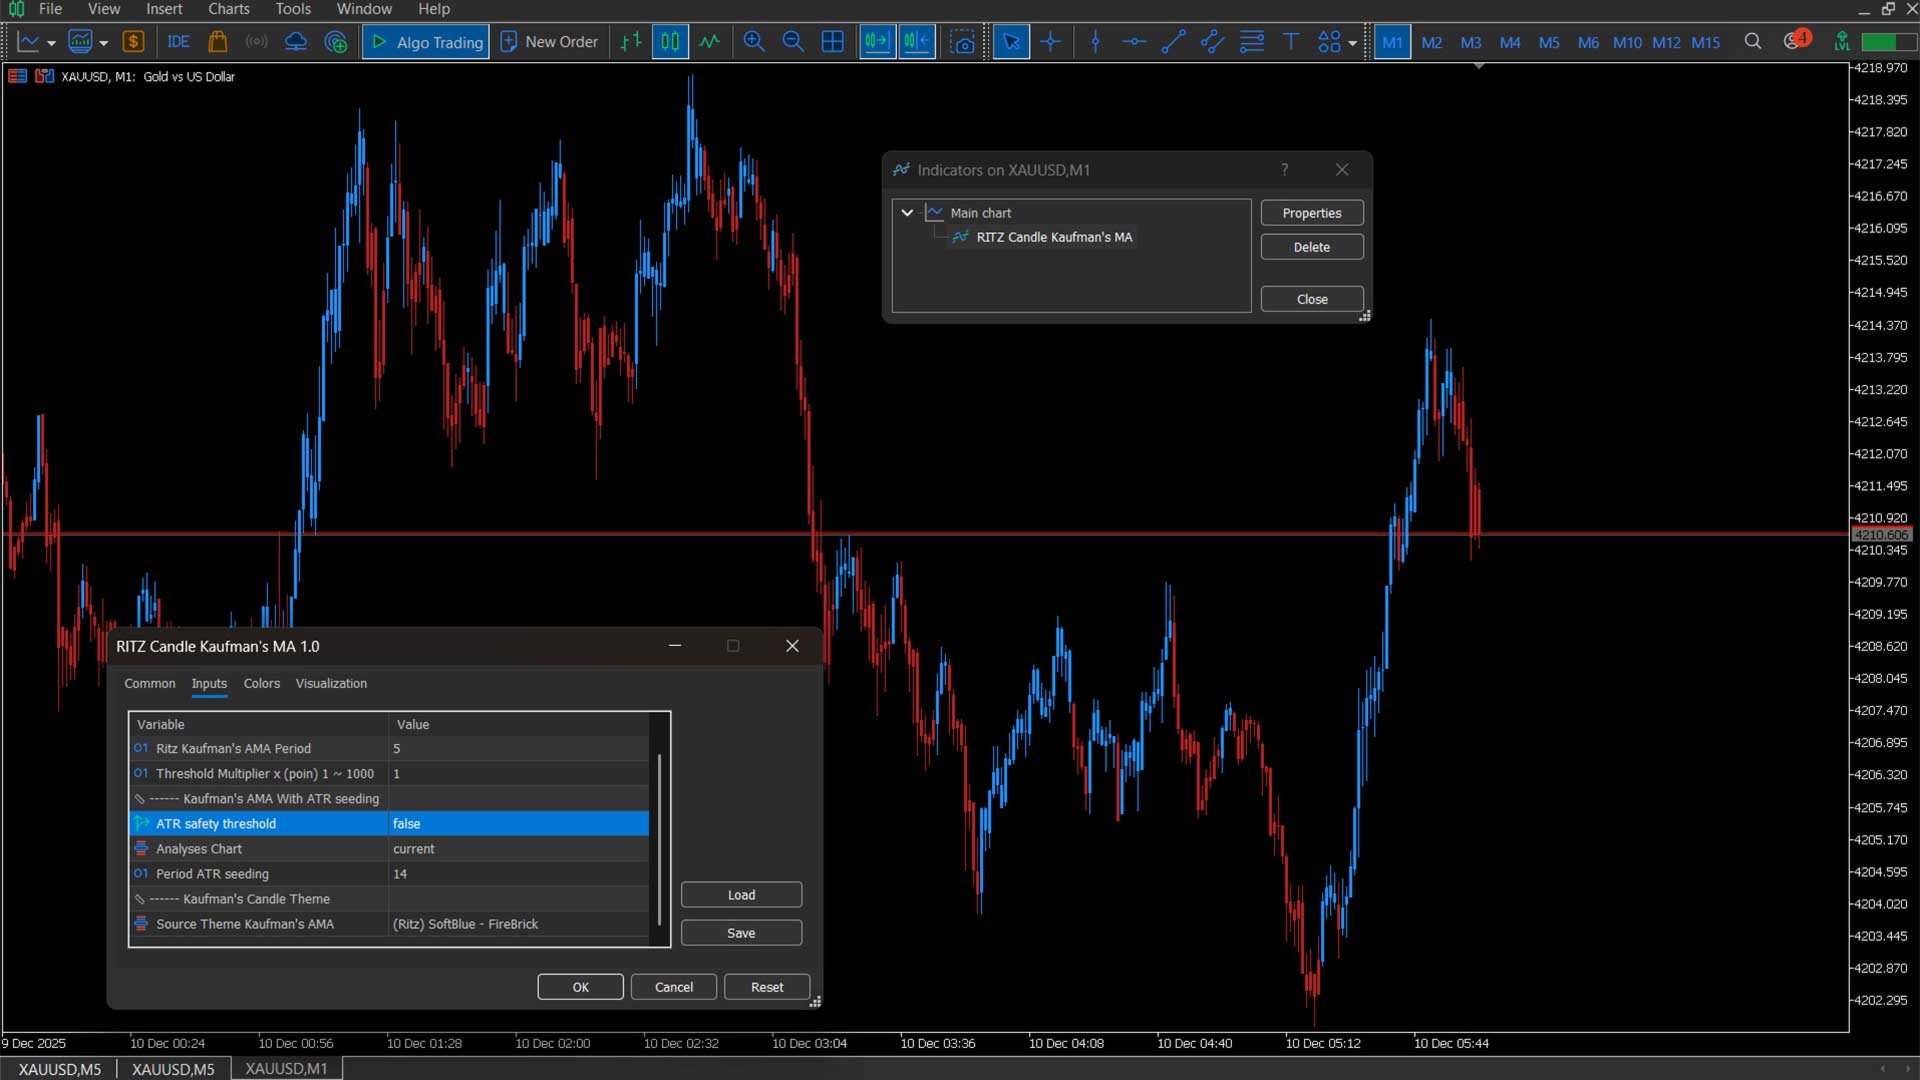
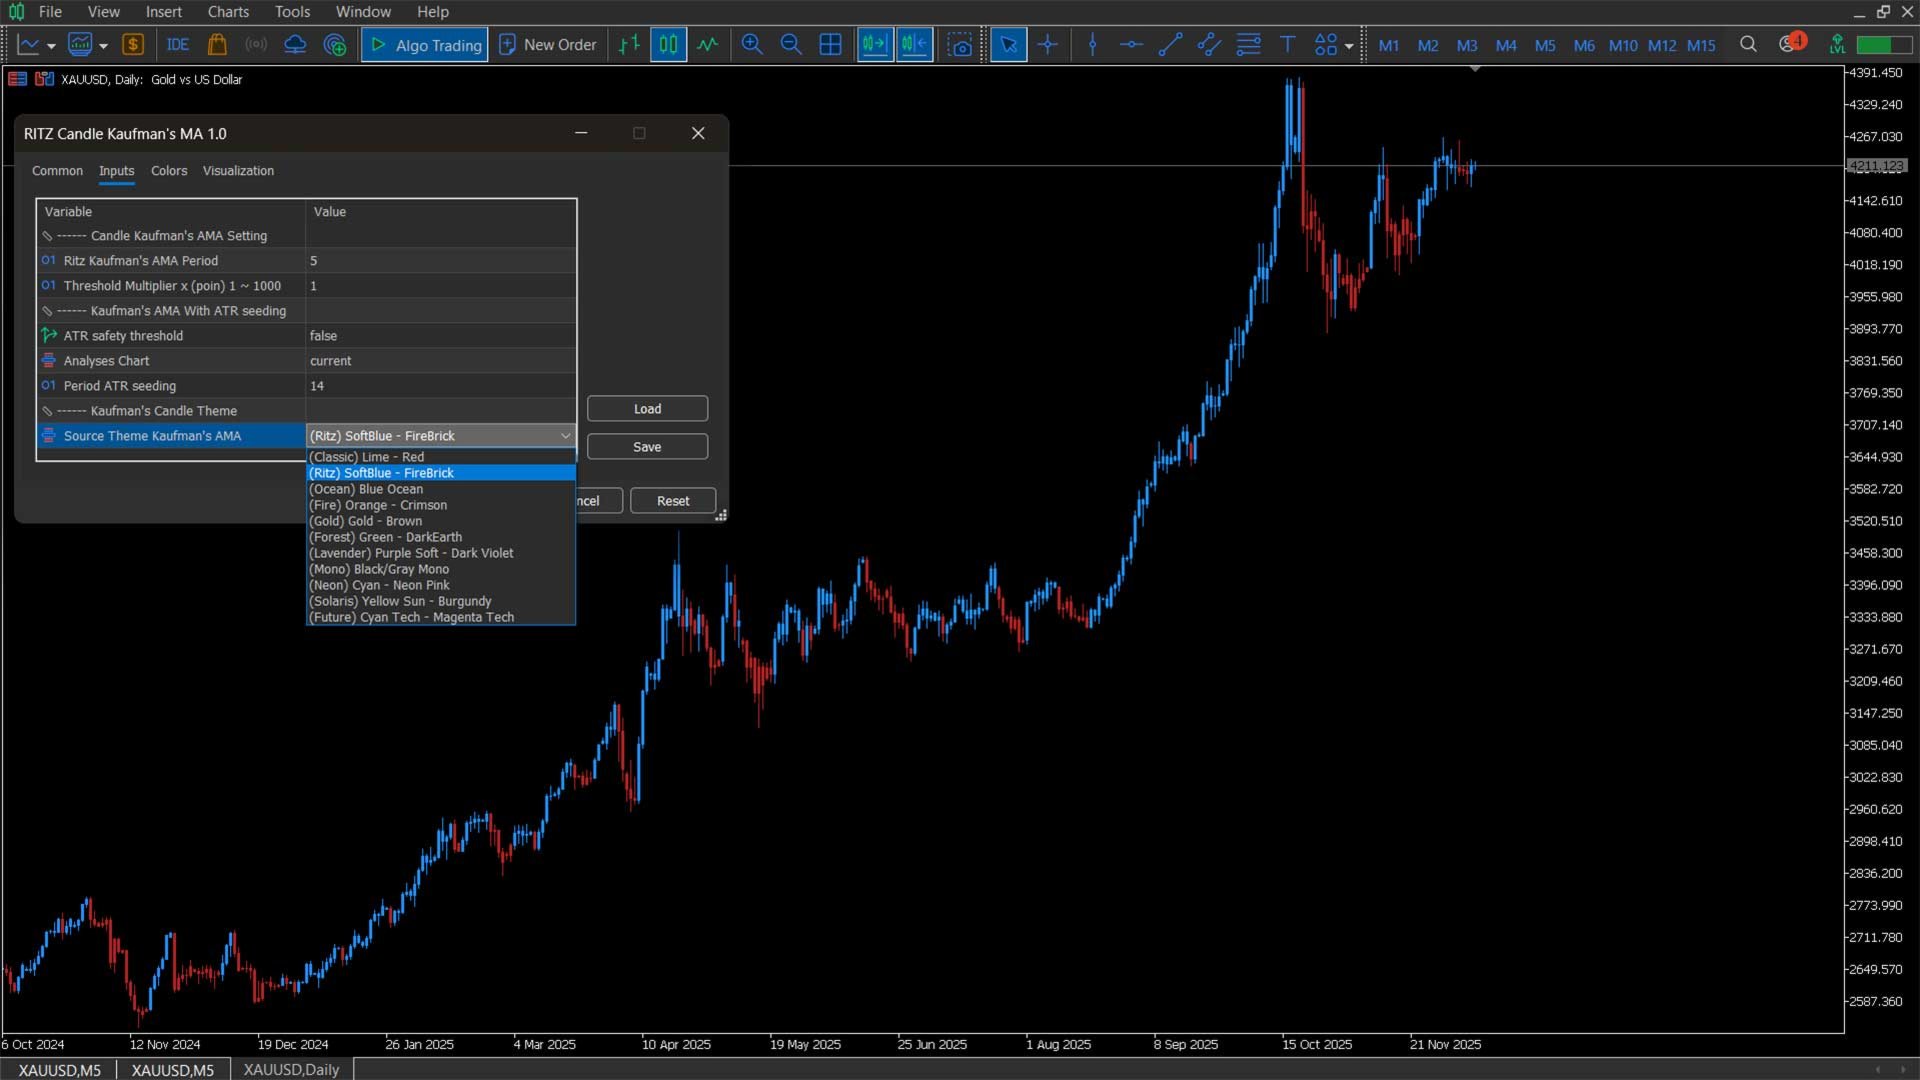
Multi-Timeframe Stability

The engine is optimized to behave consistently from M1 to MN1, including historical segments where volatility behavior changes dramatically.

Works With Any Trading Style

Scalping • Day Trading • Swing Trading • Automated Strategy Confirmation • Trend Structure Visualization.

Who Is It For?

  • Traders who want cleaner charts with fewer false signals

  • Price-action traders needing dynamic trend confirmation

  • Algorithmic traders wanting stable, non-repainting logic

  • Anyone who likes AMA/KAMA but wants it visualized directly on candles

What Makes This Version Different

This implementation integrates Kaufman’s AMA into candle data itself — not merely as a separate line.
The indicator calculates true ER-based efficiency, applies non-repainting color logic, and preserves AMA-wave integrity even on very old or large timeframes.

It provides a smooth trend waveform that adapts intelligently and remains visually stable in all market regimes.

추천 제품
FractalEfficiencyIndicator   A ratio between 0 and 1 with the higher values representing a more efficient or trending market,  It is used in the calculation of Perry J. Kaufman Adaptive Moving Average (KAMA), dividing the price change over a period by the absolute sum of the price movements that occurred to achieve that change. The Fractal Efficiency or also known as Efficiency Ratio was first published by Perry J. Kaufman in his book   ‘Smarter Trading‘. This is mostly considered a filter for v
FREE
AdaptiveCCiMt5
Francis Dube
4 (2)
The Commodity Channel Index computes the deviation of the typical price of each bar from the average price over a particular time period. Multiplying the median deviation by 0.015 facilitates normalization, which makes all deviations below the first standard deviation less than  -100, and all deviations above the first standard deviation more than 100. This adaptive version is based on the indicator described by John Ehlers, in the book Rocket Science for traders. The indicator uses the homodyne
FREE
Follow The Line MT5
Oliver Gideon Amofa Appiah
4.6 (35)
This indicator obeys the popular maxim that: "THE TREND IS YOUR FRIEND" It paints a GREEN line for BUY and also paints a RED line for SELL. (you can change the colors). It gives alarms and alerts of all kinds. IT DOES NOT REPAINT and can be used for all currency pairs and timeframes. Yes, as easy and simple as that. Even a newbie can use it to make great and reliable trades. NB: For best results, get my other premium indicators for more powerful and reliable signals. Get them here: https://www.m
FREE
Multi-timeframe trend indicator based on the ADX / ADXWilder indicator with Fibonacci levels The indicator shows trend areas using ADX or ADXWilder indicator data from multiple timeframes. The impulse mode of the indicator allows you to catch the beginning of a trend, and several "Screens" with different timeframes allow you to filter out market noise. Fibonacci levels are added to the price chart, which have flexible settings. How the indicator works: if PDI is greater than NDI, then   it`s
FREE
Технический индикатор Trend Moving Average позволяет определить глобальное направление рынка. Данный технический индикатор создан для того, чтобы определить «линию наименьшего сопротивления» рынка и понять в какую сторону направлен тренд. Помимо классического использования МА, индикатор позволяет понять направленность рынка на основе динамики его значений. Так, если значение индикатора демонстрируют переход с нисходящего значения в восходящее (и наоборот) - это является дополнительным торговым с
FREE
ThreePointsChannelFree
Dimitr Trifonov
5 (1)
This is a free version of the indicator, the period between the vertical lines is always 30 bars. In the paid version the period can be set by user, so a configuration with many ThreePointsChannel indicators with different periods is possible. The principle of construction - on top of any number of bars set by the user, a channel is constructed with maximum and minimum lines so that the bars touch the maximum and minimum of the channel at exactly three points. The name of the indicator follows
FREE
Free automatic Fibonacci is an indicator that automatically plots a Fibonacci retracement based on the number of bars you select on the BarsToScan setting in the indicator. The Fibonacci is automatically updated in real time as new highest and lowest values appears amongst the selected bars. You can select which level values to be displayed in the indicator settings. You can also select the color of the levels thus enabling the trader to be able to attach the indicator several times with differe
FREE
KeltnerChannelIndicatorMT5
Todd Terence Bates
3 (2)
The Keltner Channel is a volatility-based technical indicator composed of three separate lines. The middle line is an exponential moving average (EMA) of the price. Additional lines are placed above and below the EMA. The upper band is typically set two times the Average True Range (ATR) above the EMA, and the lower band is typically set two times the ATR below the EMA. The bands expand and contract as volatility (measured by ATR) expands and contracts. Since most price action will be encompasse
FREE
HighLow MT5
Azamat Mullayanov
4 (2)
The indicator plots two lines by High and Low prices. The lines comply with certain criteria. The blue line is for buy. The red one is for sell. The entry signal - the bar opens above\below the lines. The indicator works on all currency pairs and time frames It can be used either as a ready-made trading system or as an additional signal for a custom trading strategy. There are no input parameters. Like with any signal indicator, it is very difficult to use the product during flat movements. You
FREE
TrailingStop MA
Andrej Nikitin
3.5 (2)
The indicator draws two simple moving averages using High and Low prices. The MA_High line is displayed when the moving average is directed downwards. It can be used for setting a stop order for a sell position. The MA_Low line is displayed when the moving average is directed upwards. It can be used for setting a stop order for a buy position. The indicator is used in the TrailingStop Expert Advisor. Parameters Period - period of calculation of the moving average. Deviation - rate of convergence
FREE
Ichimoku V2
Quang Huy Quach
1. Overview The Ichimoku Kinko Hyo (or Ichimoku Cloud) is a comprehensive, all-in-one technical analysis indicator designed to provide a deep understanding of market trends, momentum, and dynamic support and resistance levels. This indicator provides a clean, standard implementation of the five core Ichimoku lines. Its key feature is a non-intrusive Status Dashboard that gives you an at-a-glance summary of the current market situation according to the Ichimoku system, allowing for quick and effi
FREE
VFI Quantum
Nikita Berdnikov
5 (1)
Introducing VFI (Volume Flow Indicator) – a trading indicator that analyzes the relationship between volume and price movement to identify key trading opportunities. The indicator displays the strength and direction of volume flow, providing clear signals about potential entry and exit points. Signals are formed based on zero line crossovers, crossovers between the VFI line and its exponential moving average (EMA), and when the indicator exits overbought and oversold zones. Attention! This stra
FREE
Alpha Trend Analyzer
Le Trung Kien Hoang
SuperTrend Indicator – Description & Important Notice The SuperTrend is a composite technical indicator designed to help you identify the primary trend, measure its strength, and assess signal quality. However, an indicator is only a tool —it’s never 100% accurate and cannot replace sound risk management. 1. Core Formula & Components ATR (Average True Range): measures price volatility; customize sensitivity via Periods and Multiplier . Upper/Lower Bands: derived from ATR and your chosen source p
FREE
Mitimom
Danil Poletavkin
The indicator is based on Robert Miner's methodology described in his book "High probability trading strategies" and displays signals along with momentum of 2 timeframes. A Stochastic oscillator is used as a momentum indicator. The settings speak for themselves period_1 is the current timeframe, 'current' period_2 is indicated - the senior timeframe is 4 or 5 times larger than the current one. For example, if the current one is 5 minutes, then the older one will be 20 minutes The rest of the s
FREE
Cross MA histogram
Mariusz Piotr Rodacki
The Cossover MA Histogram indicator is a simple tool showing the trend based on crossover of moving averages. Simply specify two mobving averages and addicional parameters like MA method and Applied price. When fast MA is above slow MA the histogram is green, indicating an uptrend. When MA fast is below MA slow the histogram is red, indicating an downtrend.
FREE
Easy GOLD MT5
Franck Martin
3.88 (42)
Easy Gold is the latest addition to the BotGPT family. It is surprising and very powerful. It is ideal for beginners due to its simplicity.  There is absolutely nothing to do, it's 100% automated, simply indicate the percentage of risk you want to take per trade and the EA is ready. Whatever your capital, the EA takes care of everything. Optimized on (XAUUSD).  Unleash all the power with the professional version (AGI Gold) and its connection to the neural network, available in my store. My othe
FREE
Auto Fibonacci
Ali Gokay Duman
5 (3)
This indicator calculates fibonacci levels via moving averages trend and draw these lines. You can change fast and slow Moving Averages settings for customization. Inputs: Fast MA Time Period :  64 Fast MA Shift: 0 Fast MA Method: Smoothed Fast MA Apply To: Median Price Slow MA Time Period: 32 Slow MA Shift: 0 Slow MA Method: Smoothed Slow MA Apply To: Median Price ZigZag: False ZigZag Color: Red ZigZag Type: DashDot ZigZag Width: VeryThin Fibo Settings TrendFibonacci: True FiboTrendColor: Black
FREE
Prometheus Analyst
Humphrey Mangera
PROMETHEUS TECHNICAN VERSION Free | By THE SONS A gift from The Sons — no strings, no trial, no expiry. Every trader deserves access to professional-grade market intelligence. That belief is why Prometheus Technical Version exists, and why it costs nothing. Consider it our handshake to the trading community. What You're Getting This is not a simplified tool dressed up as a gift. Prometheus Technican Version is a fully built, institutional-quality technical analysis indicator running a dual-model
FREE
RSI Divergence MT5 Scanner
Duc Hoan Nguyen
3.33 (3)
Special offer : ALL TOOLS , just $35 each! New tools   will be   $30   for the   first week   or the   first 3 purchases !  Trading Tools Channel on MQL5 : Join my MQL5 channel to update the latest news from me 역동적인 금융 시장에서 추세 반전 신호를 식별하는 것은 효과적인 거래에 필수적입니다. RSI Divergence Scanner는 다양한 통화 쌍과 시간대에서 RSI 다이버전스 신호를 정확하고 효율적으로 감지하도록 설계되었습니다. MT4 버전 자세히 보기:    RSI Divergence MT4 Scanner 더 많은 제품 보기:   모든 제품 1. RSI 다이버전스 이해하기 RSI (상대 강도 지수) 는 가격 모멘텀을 측정하는 기술 지표로, 트레이더들 사이에서 널리 사용됩니다. RSI 다이버전스는 가격 움직임과
FREE
Intraday Momentum Index IMI
Danilo Hudson Couto Monteiro
Indicador IMI (Intraday Momentum Index) Descrição O Indicador IMI (Intraday Momentum Index) é uma poderosa ferramenta de análise técnica desenvolvida para identificar a força do momentum e potenciais reversões no mercado. Este indicador quantifica a relação entre ganhos e perdas durante um período específico, ajudando traders a avaliar a dinâmica atual do mercado. Características Oscila entre 0 e 100, facilitando a interpretação das condições de mercado Identifica com precisão áreas de sobrecomp
FREE
TrendBite MT5
Burak Baltaci
TrendBite v1.5 - 전문 트렌드 추적 지표 개발자: 8aLt4 버전: 1.5 플랫폼: MetaTrader 5  개요 TrendBite v1.5는 시장 내 추세 변화를 감지하고 투자자에게 명확한 매매 신호를 제공하기 위해 설계된 고급 기술적 분석 지표입니다. 볼린저 밴드 알고리즘을 기반으로 하여 추세 전환을 정밀하게 포착하는 이 도구는 초보자부터 경험 많은 트레이더까지 모두에게 이상적입니다.  주요 기능  추세 감지 자동 추세 분석: 시장의 상승 및 하락 추세를 실시간으로 감지 볼린저 밴드 기반: 신뢰할 수 있는 수학적 모델에 기반한 계산 시스템 시각적 명확성: 녹색(상승) 및 노란색(하락) 히스토그램 막대로 추세 상태를 명확히 표시  매매 신호 녹색 화살표 (↑): 매수 기회를 표시합니다 빨간색 화살표 (↓): 매도 기회를 표시합니다 명확한 시각화: 추세선을 통해 포지션 방향을 쉽게 추적할 수 있습니다 히스토그램 표시: 추세 강도를 시각적으로 평가할 수 있는 기능  
FREE
Swing Bollinger Band
Muhammad Tamimul Huda
Bollinger Band Swing Detector This indicator detects market swings based on the relative position of the price to the upper, lower, and middle bands of the Bollinger Bands indicator. It allows traders to visualize market structure based on volatility rather than fixed point distances. The indicator includes a dashboard panel that displays multi-timeframe trend information and active support and resistance levels. Swing Detection Unlike standard ZigZag indicators that use fixed points or percenta
FREE
MACD Titanium
Donovan Tjin-a-tak
MACD Titanium은 MetaTrader 5용 Zero-Lag MACD 지표로, 기존 MACD보다 더 빠르고 명확한 모멘텀 신호를 제공합니다. Zero-Lag EMA 계산 방식을 사용하여 신호 지연을 줄이고 시장 모멘텀 변화에 더욱 빠르게 반응하면서도, 전통적인 MACD 구조를 유지합니다. 차별점 • Zero-Lag EMA 사용 • 모멘텀 변화에 빠른 반응 • 교차 지점을 명확히 표시 • 동적 배경 색상으로 현재 방향성 표시 • 모든 시간대와 종목에서 사용 가능 리페인트 없음. 모든 계산은 실시간 수행. 시각적 구조 아쿠아 라인 – MACD 오렌지 라인 – 시그널 녹색 점 – 상승 교차 빨간 점 – 하락 교차 배경 색상 – 현재 모멘텀 방향 녹색 = 상승 우세 빨간색 = 하락 우세 명확성을 중심으로 설계되었습니다. MACD Titanium Pro가 곧 출시됩니다 — 알림 기능, 멀티 타임프레임 분석 및 고급 다이버전스 감지 기능이 포함됩니다. MACD Titanium Trend
FREE
TSO Moving Average Slope MT5
Dionisis Nikolopoulos
5 (3)
The Moving Average Slope (MAS) subtracts the moving average level n-periods ago from the current moving average level. This way, the trend of the moving average can be drawn on the moving average line. Features Observe uptrends and downtrends at a glance. The indicator is non-repainting. Returns buffer values for the trend of the moving average to be used as part of an EA. (see below) Inputs Moving Average Period : The period of the moving average (MA). Slope Period : Number of periods between
FREE
Qunity ADX Trend
Rodion Kachkin
Trend indicator based on the ADX / ADXWilder indicator The indicator shows trend areas using ADX or ADXWilder indicator data. How the indicator works: if PDI is greater than NDI, then it`s bullish movement; if PDI is less than NDI, then it`s bearish movement; if ADX is less than or equal to the filter value specified in the parameters, then there is no movement state. Input parameters of the indicator: Calculate Timeframe - timeframe for calculation; ADX Type - type of ADX calculation based
FREE
This indicator is a zero-lag indicator and displays  strength of trend change . True Trend  Oscillator Pro works best in combination with True Trend Moving Average Pro that displays exact trend as is. Oscillator value is exact price change in given direction of the trend. True Trend Moving Average Pro: https://www.mql5.com/en/market/product/103586 If you set PERIOD input parameter to 1 this indicator becomes a sharpshooter for binary options. Developers can use True Trend Oscillator in Exper
FREE
Phoenix Momentum 5 Star
Nigel Nii Darku Narnor Darko
This indicator, "Phoenix Volume Amazing", is a sophisticated Volume Delta and Order Flow Dashboard. Unlike standard volume indicators that only show total activity, this tool dissects the internal "tug-of-war" between buyers and sellers in real-time. Core Functionality The indicator calculates Delta (the difference between buying volume and selling volume) to provide a "under the hood" look at market sentiment. It uses a custom-built GUI (Graphical User Interface) panel to display these metrics
FREE
The indicator identifies when a divergence occurs between price and an indicator or oscillator. It identifies both regular and hidden divergences. Combined with your own rules and techniques, this indicator will allow you to create (or enhance) your own powerful system. For higher probability setups I can recommend you to use my Supply Demand indicator and trade only if the divergence occurs inside a zone. Supply zone for bearish div and demand zone for bullish div. The optimal scenario is if it
FREE
The EMA Navigator Pro is an advanced version of the popular EMA indicator, designed to provide superior flexibility and multi-timeframe analysis capabilities. This indicator not only displays EMA lines but also offers a powerful alert system to ensure you never miss a crucial signal. Key Features: Multi-Timeframe Support: You can assign a separate timeframe to each individual EMA line, allowing you to analyze long-term (e.g., D1) and short-term (e.g., H1) trends on the same chart. Automatic Cro
FREE
ATR Plus
Ivan Pochta
5 (1)
ATR Plus is an enhanced version of the classic ATR that shows not just volatility itself, but the directional energy of the market . The indicator converts ATR into a normalized oscillator (0–100), allowing you to clearly see: who dominates the market — buyers or sellers when a trend begins when a trend loses strength when the market shifts into a range where volatility reaches exhaustion zones ATR Plus is perfect for momentum, trend-following, breakout and volatility-based systems. How ATR Plus
FREE
이 제품의 구매자들이 또한 구매함
ARIPoint
Temirlan Kdyrkhan
1 (1)
ARIPoint is a powerful trading companion designed to generate high-probability entry signals with dynamic TP/SL/DP levels based on volatility. Built-in performance tracking shows win/loss stats, PP1/PP2 hits, and success rates all updated live. Key Features: Buy/Sell signals with adaptive volatility bands Real-time TP/SL/DP levels based on ATR Built-in MA Filter with optional ATR/StdDev volatility Performance stats panel (Success, Profit/Loss, PP1/PP2) Alerts via popup, sound, push, or email Cu
SuperScalp Pro
Van Minh Nguyen
4.57 (21)
SuperScalp Pro – 고급 멀티 필터 스캘핑 지표 시스템 SuperScalp Pro는 클래식 Supertrend와 여러 지능형 확인 필터를 결합한 고급 스캘핑 지표로, 거래 기회를 식별하는 데 도움을 줍니다. M1부터 H4까지 다양한 시간대에서 효율적으로 작동하며, XAUUSD, BTCUSD 및 주요 Forex 통화쌍에 최적화되어 있습니다. 이 지표는 명확한 매수 및 매도 신호를 제공하며, ATR 기반으로 진입가, 손절가, 익절가를 자동 계산하여 보다 효과적인 리스크 관리를 지원합니다. Fibonacci Take Profit 기능은 중요한 가격 구간에서 더 빠르게 포지션을 청산할 수 있도록 하며, 해당 수준 도달 시 알림을 전송합니다. 기본 설정은 Fibonacci Take Profit이 활성화된 상태로 최적화되어 있으며, 보다 안정적이고 일관된 거래 경험에 중점을 둡니다. 차트에 적용하는 것만으로 즉시 사용할 수 있습니다. 고급 사용자를 위해 모든 파라미터는 자유롭게 사용
Divergence Bomber
Ihor Otkydach
4.9 (86)
이 지표를 구매하신 분께는 다음과 같은 혜택이 무료로 제공됩니다: 각 거래를 자동으로 관리하고, 손절/익절 수준을 설정하며, 전략 규칙에 따라 거래를 종료하는 전용 도우미 툴 "Bomber Utility" 다양한 자산에 맞게 지표를 설정할 수 있는 셋업 파일(Set Files) "최소 위험", "균형 잡힌 위험", "관망 전략" 모드로 설정 가능한 Bomber Utility의 셋업 파일 이 전략을 빠르게 설치, 설정, 시작할 수 있도록 돕는 단계별 영상 매뉴얼 주의: 위의 모든 보너스를 받기 위해서는 MQL5 개인 메시지 시스템을 통해 판매자에게 연락해 주세요. 독창적인 커스텀 지표인 “Divergence Bomber(다이버전스 봄버)”를 소개합니다. 이 지표는 MACD 다이버전스(괴리) 전략을 기반으로 한 올인원(All-in-One) 거래 시스템입니다. 이 기술 지표의 주요 목적은 가격과 MACD 지표 간의 다이버전스를 감지하고, **향후 가격이 어느 방향으로 움직일지를 알려주는
Entry In The Zone and SMC Multi Timeframe is a real-time 2-in-1 market analysis tool that combines market structure analysis and a No Repaint BUY / SELL signal system into a single indicator, built on Smart Money Concepts (SMC) — a widely adopted framework used by professional traders to understand market structure. This indicator helps you see the market more clearly, make decisions based on structure rather than guesswork, and focus on high-probability zones where price is more likely to react
Azimuth Pro
Ottaviano De Cicco
5 (6)
Azimuth Pro V2: Synthetic Fractal Structure and Confirmed Entries for MT5 Overview Azimuth Pro is a multi-level swing structure indicator by Merkava Labs . Four nested swing layers, swing-anchored VWAP, ABC pattern detection, three-timeframe structural filtering, and closed-bar confirmed entries — one chart, one workflow from micro-swings to macro-cycles. This is not a blind signal product. It is a structure-first workflow for traders who care about location, context, and timing. V2 Launch Offe
Gold Entry Sniper
Tahir Mehmood
5 (8)
Gold Entry Sniper – 골드 스캘핑 & 스윙 트레이딩을 위한 전문 다중 시간 프레임 ATR 대시보드 Gold Entry Sniper 는 XAUUSD 및 기타 종목에 대해 정확한 매수/매도 신호 를 제공하는 고급 MetaTrader 5 지표입니다. ATR 트레일링 스톱 로직 과 다중 시간 프레임 분석 을 기반으로 설계되어 스캘핑과 스윙 트레이딩 모두에 적합합니다. 주요 기능 및 장점 다중 시간 프레임 분석 – M1, M5, M15 추세를 한눈에 확인. ATR 기반 트레일링 스톱 – 변동성에 따라 자동 조정. 전문 차트 대시보드 – 신호 상태, ATR 레벨, 회귀선, 매매 방향 표시. 명확한 매수/매도 마커 – 자동 화살표와 텍스트 라벨. 종료 알림 & 거래 관리 – 수익 보호를 위한 자동 종료 감지. 완전 사용자 설정 가능 – 대시보드 위치, 색상, ATR/회귀선 파라미터 조정. 골드(XAUUSD) 최적화 – M1~M15 스캘핑에 완벽, 외환/지수/암호화폐에도 적용 가능.
Quantum TrendPulse
Bogdan Ion Puscasu
5 (23)
SuperTrend   ,   RSI   ,   Stochastic   의 힘을 하나의 포괄적인 지표로 결합하여 트레이딩 잠재력을 극대화하는 궁극의 트레이딩 도구   인 Quantum TrendPulse를   소개합니다. 정밀성과 효율성을 추구하는 트레이더를 위해 설계된 이 지표는 시장 추세, 모멘텀 변화, 최적의 진입 및 종료 지점을 자신 있게 식별하는 데 도움이 됩니다. 주요 특징: SuperTrend 통합:   주요 시장 추세를 쉽게 따라가고 수익성의 물결을 타세요. RSI 정밀도:   매수 과다 및 매도 과다 수준을 감지하여 시장 반전 시점을 파악하는 데 적합하며 SuperTrend 필터로 사용 가능 확률적 정확도:   변동성이 큰 시장에서 숨겨진 기회를 찾기 위해 확률적 진동   을 활용하고 SuperTrend의 필터로 사용 다중 시간대 분석:   M5부터 H1 또는 H4까지 다양한 시간대에 걸쳐 시장을 최신 상태로 유지하세요. 맞춤형 알림:   맞춤형 거래 조건이 충족되면
이 지표를 구매하면 제 프로페셔널 트레이드 매니저를 무료로 드립니다. 우선 이 거래 시스템이 리페인팅, 리드로잉 및 레이그 인디케이터가 아니라는 점을 강조하는 것이 중요합니다. 이는 수동 및 로봇 거래 모두에 이상적인 것으로 만듭니다. 온라인 강좌, 설명서 및 프리셋 다운로드. "스마트 트렌드 트레이딩 시스템 MT5"은 새로운 및 경험이 풍부한 트레이더를 위해 맞춤형으로 제작된 종합적인 거래 솔루션입니다. 10개 이상의 프리미엄 인디케이터를 결합하고 7개 이상의 견고한 거래 전략을 특징으로 하여 다양한 시장 조건에 대한 다목적 선택이 가능합니다. 트렌드 추종 전략: 효과적인 트렌드 추이를 타기 위한 정확한 진입 및 손절 관리를 제공합니다. 반전 전략: 잠재적인 트렌드 반전을 식별하여 트레이더가 범위 시장을 활용할 수 있게 합니다. 스캘핑 전략: 빠르고 정확한 데이 트레이딩 및 단기 거래를 위해 설계되었습니다. 안정성: 모든 인디케이터가 리페인팅, 리드로잉 및 레이그가 아니므로 신뢰
Power Candles MT5
Daniel Stein
4.75 (8)
Power Candles – 모든 시장을 위한 강도 기반 진입 신호 Power Candles 는 Stein Investments의 검증된 강도 분석을 가격 차트에 직접 제공합니다. 가격 움직임에만 반응하는 대신, 각 캔들은 실제 시장 강도를 기준으로 색상화되어 모멘텀 형성, 강도 가속, 명확한 추세 전환을 즉시 파악할 수 있습니다. 모든 시장을 위한 단일 로직 Power Candles는 모든 거래 심볼 에서 자동으로 작동합니다. 현재 심볼이 Forex인지 비-Forex 시장인지 자동으로 감지하여 내부적으로 적절한 강도 모델을 적용합니다. Forex 및 Gold 는 FX Power Delta 값을 사용합니다 (절대값 범위 최대 100) 지수, 크립토 및 CFD 는 IX Power Strength 값을 사용합니다 (절대값 범위 최대 50) 필요한 강도 계산은 Power Candles에 완전히 내장되어 있습니다. 캔들 색상이나 신호 로직을 위해 추가 인디케이터는 필요하지 않습니다. 가격
OmniSync Projection
Antonio-alin Teculescu
5 (1)
Chronos Fractal Engine is an innovative price projection indicator for MetaTrader 5, designed to transform your technical analysis by intelligently identifying and projecting historical price patterns. Built upon an advanced correlation algorithm and the fractal principles of the market, this powerful tool visualizes potential future price movements, giving you a unique edge in your trading decisions. What is Chronos Fractal Engine? At its core, the Chronos Fractal Engine employs a sophisticat
FX Trend MT5 NG
Daniel Stein
5 (4)
FX Trend NG: 차세대 멀티 마켓 트렌드 인텔리전스 개요 FX Trend NG 는 다중 시간 프레임 기반의 전문 트렌드 분석 및 시장 모니터링 도구입니다. 몇 초 만에 전체 시장 구조를 파악할 수 있도록 설계되었습니다. 여러 차트를 일일이 전환할 필요 없이, 어떤 종목이 추세에 있는지, 어디에서 모멘텀이 약화되고 있는지, 그리고 어떤 시간 프레임이 서로 정렬되어 있는지 즉시 확인할 수 있습니다. 출시 기념 특별 혜택 – FX Trend NG 를 $30 (6개월) 또는 $80 평생 라이선스 로 이용할 수 있습니다. 이미 Stein Investments 고객이신가요? -> 메시지를 보내 전용 고객 그룹에 참여하세요. 설정이나 사용 방법이 필요하신가요? -> Stein Investments 공식 페이지 를 방문하세요. 1. FX Trend NG가 특별한 이유 3단계 추세 로직 – 단순한 Buy / Sell이 아닙니다 • 대부분의 지표는 Buy 또는 Sell 두 가지 상태만 제
Gann Made Easy MT5
Oleg Rodin
5 (2)
Gann Made Easy 는 mr.의 이론을 사용하여 최고의 거래 원칙을 기반으로 하는 전문적이고 사용하기 쉬운 Forex 거래 시스템입니다. W.D. 간. 이 표시기는 Stop Loss 및 Take Profit Levels를 포함하여 정확한 BUY 및 SELL 신호를 제공합니다. PUSH 알림을 사용하여 이동 중에도 거래할 수 있습니다. 구매 후 거래 방법 안내 및 유용한 추가 지표를 무료로 받으시려면 저에게 연락주세요! 아마도 Gann 거래 방법에 대해 이미 여러 번 들었을 것입니다. 일반적으로 Gann의 이론은 초보자 거래자뿐만 아니라 이미 거래 경험이 있는 사람들에게도 매우 복잡한 것입니다. Gann의 거래 방식은 이론적으로 적용하기 쉽지 않기 때문입니다. 나는 그 지식을 연마하고 Forex 지표에 최고의 원칙을 적용하기 위해 몇 년을 보냈습니다. 표시기는 적용하기가 매우 쉽습니다. 차트에 첨부하고 간단한 거래 권장 사항을 따르기만 하면 됩니다. 지표는 지속적으로 시장 분석
소개       Quantum Breakout PRO   , 브레이크아웃 존 거래 방식을 변화시키는 획기적인 MQL5 지표! 13년 이상의 거래 경험을 가진 숙련된 트레이더 팀이 개발한       퀀텀 브레이크아웃 PRO       혁신적이고 역동적인 브레이크아웃 존 전략으로 거래 여정을 새로운 차원으로 끌어올리도록 설계되었습니다. Quantum Breakout Indicator는 5개의 이익 목표 영역이 있는 브레이크아웃 영역의 신호 화살표와 브레이크아웃 상자를 기반으로 한 손절 제안을 제공합니다. 초보자 거래자와 전문 거래자 모두에게 적합합니다. Quantum EA 채널:       여기를 클릭하세요 중요한! 구매 후 설치 매뉴얼을 받으려면 개인 메시지를 보내주십시오. 추천: 기간: M15 통화쌍: GBPJPY, EURJPY, USDJPY,NZDUSD, XAUUSD 계정 유형: 스프레드가 매우 낮은 ECN, Raw 또는 Razor 브로커 시간: GMT +3 중개인 :
CGE Trading Suite
Carl Gustav Johan Ekstrom
5 (2)
Institutional-Grade Analytics for MT5 C GE Trading Suite delivers the analytical edge typically reserved for professional trading desks. The platform integrates a full suite of analytical tools into one seamless workflow: dynamic grid mapping, liquidity behavior analysis, ECM, trend lines, MIDAS, trade cycles, and directional channel projections. Together, these provide a unified view of market structure and momentum. Directional clarity is further enhanced by the capital flow index, which meas
SMC Intraday Formula
Kareem Abbas
5 (4)
먼저 솔직하게 말하겠습니다. 어떤 인디케이터도 단독으로 당신을 수익성 있게 만들어주지 않습니다. 누군가 그렇게 말한다면, 그는 당신에게 꿈을 파는 것입니다. 완벽한 매수/매도 화살표를 보여주는 모든 인디케이터는 완벽하게 보이도록 만들 수 있습니다 — 단지 올바른 과거 구간을 확대하고 승리한 거래만 캡처하면 됩니다. 우리는 그렇게 하지 않습니다.  SMC Intraday Formula는 도구입니다. 시장 구조를 읽고, 가장 높은 확률의 가격 구간을 표시하며, 현재 스마트 머니의 흐름이 어떻게 보이는지 아주 단순한 언어로 보여줍니다. 최종 결정은 여전히 당신이 합니다. 실행도 당신이 합니다. 하지만 이제는 희망이 아니라 정확성으로 거래하게 됩니다. 우리는 이 인디케이터를 지난 약 3년 동안 골드(XAUUSD) 및 주요 외환 통화쌍의 데이 트레이딩 스캘핑에 사용해 왔습니다. M1, M5, M15, M30에서 우리의 핵심 도구입니다. 이 도구는 미래를 예측하려 하지 않습니다 — 지금 형성
Power Bar MT5
Daniel Stein
실제 자금을 투입하기 전에 어떤 전략이 내 심볼에서 효과적인지 확인하세요. Power Bar는 모든 심볼과 모든 타임프레임에서 극단적인 가격 바 를 감지한 다음, 3가지 다른 트레이딩 전략을 즉시 백테스트하여 승률, 수익 팩터, 손익을 나란히 비교할 수 있습니다. 모든 것이 하나의 인터랙티브 패널에 담겨 있습니다. 추측 없음. 커브 피팅 없음. 오직 데이터뿐입니다. Power Bar가 특별한 이유 대부분의 인디케이터는 신호를 주고 그것이 효과가 있는지는 추측에 맡깁니다. Power Bar는 한 걸음 더 나아갑니다 - 모든 신호를 세 가지 전략 에 대해 테스트하고 통계를 보여줍니다. FlipFlop, Momentum, Reversal을 원클릭으로 전환하고 숫자가 즉시 변하는 것을 확인하세요. FlipFlop - 항상 포지션 유지. 신호에 진입하고, 반대 신호에 청산. 당사의 연구에 따르면 US30, US500, DAX와 같은 추세가 있는 지수에서 가장 효과적입니다. Momentum
Grabber System MT5
Ihor Otkydach
4.83 (23)
탁월한 기술적 지표인 Grabber를 소개합니다. 이 도구는 즉시 사용 가능한 “올인원(All-Inclusive)” 트레이딩 전략으로 작동합니다. 하나의 코드 안에 강력한 시장 기술 분석 도구, 매매 신호(화살표), 알림 기능, 푸시 알림이 통합되어 있습니다. 이 인디케이터를 구매하신 모든 분들께는 다음의 항목이 무료로 제공됩니다: Grabber 유틸리티: 오픈 포지션을 자동으로 관리하는 도구 단계별 영상 매뉴얼: 설치, 설정, 그리고 실제 거래 방법을 안내 맞춤형 세트 파일: 인디케이터를 빠르게 자동 설정하여 최고의 성과를 낼 수 있도록 도와줍니다 다른 전략은 이제 잊어버리세요! Grabber만이 여러분을 새로운 트레이딩의 정점으로 이끌어 줄 수 있습니다. Grabber 전략의 주요 특징: 거래 시간 프레임: M5부터 H4까지 거래 가능한 자산: 어떤 자산이든 사용 가능하지만, 제가 직접 테스트한 종목들을 추천드립니다 (GBPUSD, GBPCAD, GBPCHF, AUDCAD, AU
Atomic Analyst MT5
Issam Kassas
3.94 (31)
우선적으로 언급할 점은이 거래 지표가 다시 그리지 않고 지연되지 않으며 이를 통해 수동 및 로봇 거래 모두에 이상적이라는 점입니다. 사용자 매뉴얼: 설정, 입력 및 전략. Atomic Analyst는 가격의 강도와 모멘텀을 활용하여 시장에서 더 나은 이점을 찾는 PA Price Action Indicator입니다. 고급 필터를 장착하여 잡음과 거짓 신호를 제거하고 거래 잠재력을 높이는 데 도움이 됩니다. 복잡한 지표의 다중 레이어를 사용하여 Atomic Analyst는 차트를 스캔하고 복잡한 수학적 계산을 간단한 신호와 색상으로 변환하여 초보 트레이더가 이해하고 일관된 거래 결정을 내릴 수 있도록합니다. "Atomic Analyst"는 새로운 및 경험이 풍부한 트레이더를위한 종합적인 거래 솔루션입니다. 프리미엄 지표와 최고 수준의 기능을 하나의 거래 전략에 결합하여 모든 종류의 트레이더에 대한 다재다능한 선택지가되었습니다. 인트라데이 거래 및 스캘핑 전략 : 빠르고 정확한 일일
FX Power MT5 NG
Daniel Stein
5 (31)
FX Power: 통화 강세 분석으로 더 스마트한 거래 결정을 개요 FX Power 는 어떤 시장 상황에서도 주요 통화와 금의 실제 강세를 이해하기 위한 필수 도구입니다. 강한 통화를 매수하고 약한 통화를 매도함으로써 FX Power 는 거래 결정을 단순화하고 높은 확률의 기회를 발견합니다. 트렌드를 따르거나 극단적인 델타 값을 사용해 반전을 예측하고자 한다면, 이 도구는 귀하의 거래 스타일에 완벽히 적응합니다. 단순히 거래하지 말고, FX Power 로 더 스마트하게 거래하세요. 1. FX Power가 거래자에게 매우 유용한 이유 통화와 금의 실시간 강세 분석 • FX Power 는 주요 통화와 금의 상대적 강세를 계산하고 표시하여 시장 역학에 대한 명확한 통찰력을 제공합니다. • 어떤 자산이 앞서고 있고 어떤 자산이 뒤처지는지 모니터링하여 보다 현명한 거래 결정을 내릴 수 있습니다. 포괄적인 멀티 타임프레임 뷰 • 단기, 중기 및 장기 타임프레임에서 통화와 금의 강세를
Bill Williams Advanced
Siarhei Vashchylka
5 (11)
Bill Williams Advanced is designed for automatic chart analysis using Bill Williams' "Profitunity" system. The indicator analyzes four timeframes at once. Manual (Be sure to read before purchasing) Advantages 1. Analyzes the chart using Bill Williams' "Profitunity" system. Signals are displayed in a table in the corner of the screen and on the price chart. 2. Finds all known AO and AC signals, as well as zone signals. Equipped with a trend filter based on the Alligator. 3. Finds "Divergence Bar
Trend Screener Pro MT5
STE S.S.COMPANY
4.85 (104)
트렌드 표시기, 트렌드 트레이딩 및 필터링을 위한 획기적인 고유 솔루션, 하나의 도구 안에 내장된 모든 중요한 트렌드 기능! Forex, 상품, 암호 화폐, 지수 및 주식과 같은 모든 기호/도구에 사용할 수 있는 100% 다시 칠하지 않는 다중 시간 프레임 및 다중 통화 표시기입니다. Trend Screener는 차트에 점이 있는 화살표 추세 신호를 제공하는 효율적인 지표 추세 추종 지표입니다. 추세 분석기 표시기에서 사용할 수 있는 기능: 1. 트렌드 스캐너. 2. 최대 이익 분석이 있는 추세선. 3. 추세 통화 강도 측정기. 4. 경고가 있는 추세 반전 점. 5. 경고가 있는 강력한 추세 점. 6. 추세 화살표 Trend Screener Indicator가 있는 일일 분석 예, 일일 신호 성능...등은 여기에서 찾을 수 있습니다. 여기를 클릭하십시오. LIMITED TIME OFFER : Trend Screener Indicator는 50$ 및 평생 동안만 사용할 수 있습니다.
Btmm state engine pro
Garry James Goodchild
5 (4)
BTMM State Engine Pro is a MetaTrader 5 indicator for traders who use the Beat The Market Maker approach: Asian session context, kill zone timing, level progression, peak formation detection, and a multi-pair scanner from a single chart. It combines cycle state logic with a built-in scanner dashboard so you do not need the same tool on many charts at once. What it does Draws the Asian session range; session times can follow broker server offset or be set in inputs. Tracks level progression (L
SignalTech MT5
Yue Wang
5 (1)
SignalTech MT5 is a trading system for EURUSD, USDCHF, USDJPY, AUDUSD, NZDUSD, EURJPY, AUDJPY, NZDJPY, CADJPY H2 and H3 Timeframe.  It can generate signals with Buy/Sell Arrows and Pop-Up/Sound Alerts. Each signal has clear Entry and Stop Loss levels, which should be automatically flagged on the chart, as well as potential Targets 1, 2, and 3. The Entry and TP levels are fixed after the trade is taken. The exit level is dynamic. If there are signs of a potential short-term trend reversal, the
Crystal Heikin Ashi Signals
Muhammad Jawad Shabir
5 (2)
Crystal Heikin Ashi Signals - Professional Trend & Signal Detection Indicator Advanced Heikin Ashi Visualization with Intelligent Signal System for Manual & Automated Trading Final Price: $149 ---------> Price goes up $10 after every 10 sales . Limited slots available — act fast . Overview Crystal Heikin Ashi Signals is a professional-grade MetaTrader 5 indicator that combines pure Heikin Ashi candle visualization with an advanced momentum-shift detection system. Designed for both manual traders
Berma Bands
Muhammad Elbermawi
5 (8)
Berma Bands(BBs) 지표는 시장 동향을 파악하고 이를 활용하려는 트레이더에게 귀중한 도구입니다. 가격과 BBs 간의 관계를 분석함으로써 트레이더는 시장이 추세 단계인지 범위 단계인지를 분별할 수 있습니다. 자세한 내용을 알아보려면 [ Berma Home Blog ]를 방문하세요. 버마 밴드는 세 개의 뚜렷한 선으로 구성되어 있습니다. 어퍼 버마 밴드, 미들 버마 밴드, 로어 버마 밴드입니다. 이 선들은 가격 주위에 그려져 전체 추세에 대한 가격 움직임을 시각적으로 표현합니다. 이 밴드들 사이의 거리는 변동성과 잠재적인 추세 반전에 대한 통찰력을 제공할 수 있습니다. 버마 밴드 라인이 각각에서 분리될 때, 그것은 종종 시장이 횡보 또는 범위 이동 기간에 접어들고 있음을 시사합니다. 이는 명확한 방향 편향이 없음을 나타냅니다. 트레이더는 이러한 기간 동안 추세를 파악하기 어려울 수 있으며 더 명확한 추세가 나타날 때까지 기다릴 수 있습니다. 버마 밴드 라인이 단일 라인으로
Meridian Pro
Ottaviano De Cicco
5 (1)
Meridian Pro: Professional Multi-Timeframe Trend Matrix for MT5 Overview Meridian Pro is a multi-timeframe trend matrix by Merkava Labs that compresses directional state, strength, momentum condition and matrix agreement into one compact panel. One adaptive engine, applied consistently from M1 to W1. No per-symbol tuning. No indicator stacking. One structured readout across every asset and every timeframe. Launch Offer — Get Meridian Pro for USD 99 (introductory). Regular price: USD 149. 1. Why
Auto Optimized Parabolic RSI: 고급 3D 모멘텀 엔진 대부분의 개인 투자자용 보조지표는 시장의 변동성이 변하는 순간 무용지물이 되는 정적인 입력값에 의존하기 때문에 실패합니다. Auto Optimized Parabolic RSI는 자체적인 수학적 우위를 지속적으로 재계산하여 "보조지표 노후화" 문제를 해결하며, 기관급 퀀트 트레이딩의 적응력을 귀하의 MT5 터미널에 직접 제공합니다. 핵심 이점: 맞춤형 인메모리 3D 최적화 표준 자동 최적화 도구들은 일반적인 보조지표 호출로 터미널에 과부하를 일으켜 MT5 플랫폼을 멈추게 하는 경우가 많습니다. 이 도구는 이러한 병목 현상을 완전히 우회합니다. 맞춤형 네이티브 RAM 기반 계산기로 구축된 내부 엔진은 차트를 로드하거나 타임프레임을 변경할 때마다 빛처럼 빠른 3D 그리드 검색을 실행합니다. RSI 기간(주기), SAR 스텝(가속도) 및 SAR 최대치(속도 제한)를 동시에 스캔하여 플랫폼 지연 없이 수만 개의 파라
ARICoins
Temirlan Kdyrkhan
ARICoin is a powerful trading companion designed to generate high-probability entry signals with dynamic TP/SL/DP levels based on volatility. Built-in performance tracking shows win/loss stats, PP1/PP2 hits, and success rates all updated live. Key Features: Buy/Sell signals with adaptive volatility bands Real-time TP/SL/DP levels based on ATR Built-in MA Filter with optional ATR/StdDev volatility Performance stats panel (Success, Profit/Loss, PP1/PP2) Alerts via popup, sound, push, or email Cust
IX Power MT5
Daniel Stein
4.92 (13)
IX Power: 지수, 원자재, 암호화폐 및 외환 시장 통찰력을 발견하세요 개요 IX Power 는 지수, 원자재, 암호화폐 및 외환 시장의 강도를 분석할 수 있는 다목적 도구입니다. FX Power 는 모든 가용 통화 쌍 데이터를 사용하여 외환 쌍에 대해 가장 높은 정확도를 제공하는 반면, IX Power 는 기초 자산 시장 데이터에만 초점을 맞춥니다. 이로 인해 IX Power 는 비외환 시장에 이상적이며, 다중 쌍 분석이 필요하지 않은 간단한 외환 분석에도 신뢰할 수 있는 도구입니다. 모든 차트에서 매끄럽게 작동하며, 거래 결정을 향상시키기 위한 명확하고 실행 가능한 통찰력을 제공합니다. 1. IX Power가 트레이더에게 유용한 이유 다양한 시장 강도 분석 • IX Power 는 지수, 원자재, 암호화폐 및 외환 심볼의 강도를 계산하여 각 시장에 맞는 통찰력을 제공합니다. • US30, WTI, 금, 비트코인 또는 통화 쌍과 같은 자산을 모니터링하여 거래 기회를 발견
Meravith Scanner
Ivan Stefanov
5 (1)
MERAVITH SCANNER는 MetaTrader 5용 전문 금융 시장 지표로, 여러 분석 도구를 하나의 통합 시스템으로 결합합니다. 독점적인 거래량 가중 평균 가격(VWAP) 방법론을 사용하여 모든 계산을 자동으로 수행하며, 주관적인 해석을 완전히 배제합니다. 이 지표는 모든 자산 클래스(Forex, 주식, 지수, 상품, 암호화폐)와 M1부터 월간 차트까지 모든 시간 프레임에서 작동합니다. 기본 원리는 “가격은 거래량을 따른다”입니다. MERAVITH는 기관 거래량이 집중되는 위치를 식별하고, 그 집중에서 수학적으로 정확한 가격 수준을 도출합니다. 예측이나 투기를 하지 않으며, 계산만 수행합니다. MERAVITH SCANNER를 사용하면 28개의 주요 Forex 통화쌍을 모든 시간 프레임에서 단 2~3분 만에 스캔할 수 있습니다. 또한 원하는 시장을 스캔할 수도 있으며, 예를 들어 약 100개의 주식을 약 10분 안에 스캔할 수 있습니다. 지표는 소진 레벨, 균형선, 편차, 통계
제작자의 제품 더 보기
BUY and SELL Smart Detection
Syamsurizal Dimjati
5 (1)
Ritz Smart Detection BUY & SELL Visit premium products :  https://www.mql5.com/en/market/product/155962 This indicator will be very suitable to be paired with BUY and SELL Smart detection : https://www.mql5.com/en/market/product/170689 Visit, what can you get? :   https://www.mql5.com/en/users/ritzfalih/seller The Ritz Smart Detection BUY & SELL is a next-generation trading indicator engineered to detect high-probability entry signals by combining ATR-based volatility measurement , trend rever
FREE
Moving Average Ribbon
Syamsurizal Dimjati
5 (1)
MOVING AVERAGE RIBBON Ritz MA Ribbon Dynamics – The Next-Gen Trend Visualizer Ritz MA Ribbon Dynamics is a futuristic multi-layer Moving Average system engineered to visualize trend momentum, volatility balance, and market rhythm in one adaptive ribbon. Designed for modern traders who demand clarity, flexibility, and automation — this tool transforms the classic MA visualization into a dynamic analytical framework. Core Concept The indicator creates a multi-tier MA Ribbon that adapts to the cho
FREE
Buy Sell Smart
Syamsurizal Dimjati
BUY and SELL smart The BUY and SELL Smart Indicator is a next-generation trading tool engineered for precision scalpers, intraday strategists, and professional analysts who demand both speed and clarity in market visualization. It seamlessly integrates smart candle-based analytics, adaptive ATR logic, and real-time economic event awareness — giving you a fully synchronized view of market volatility and momentum. Through an elegant and optimized interface, FlashScalp delivers   instant signal fee
Fibo Pivot Optimus
Syamsurizal Dimjati
5 (1)
Ritz Smart FIBOPIVOT Optimus Pro Advanced Multi-Timeframe Fibonacci Trading System SMART PREDICTION & ACCURATE FORECAST Revolutionary Fibonacci Pivot Technology combines traditional pivot points with advanced Fibonacci extensions, creating a powerful predictive tool for professional traders. Our algorithm intelligently detects significant price levels across multiple timeframes, delivering laser-accurate support and resistance zones before the market moves . INTELLIGENT VOLUME-VALIDATED SIGNALS
FREE
Smart Finder Order Block The Ritz Smart Finder Order Block is a next-generation market structure recognition tool, designed to intelligently detect and highlight institutional footprints within price action. Built on a dynamic blend of order block theory, consolidation tracking, and adaptive volatility modeling, it provides traders with a sophisticated lens to anticipate high-probability market reactions. Core Capabilities Smart Order Block Detection Identifies both Bullish and Bearish Order Blo
FREE
RITZ SMART TREND ADAPTIVE FINDER Precision Trend Intelligence. Adaptive. Insightful. Real-Time. Ritz Smart Trend Adaptive Finder is an advanced market intelligence indicator engineered to detect and adapt to evolving market structures with dynamic precision. It automatically calibrates its analytical period based on real-time volatility, price momentum, and correlation strength — delivering true adaptive trend detection rather than static or lagging signals. By combining Pearson correlation , sl
FREE
RITZ QUANTUM PULSE Next-Generation Economic Intelligence System Ritz Quantum Pulse — Next-Gen Economic Intelligence System. Experience quantum-level precision in news trading: real-time event detection, AI-powered filtering, and temporal synchronization. Anticipate volatility before it happens — not after. Where Market Intelligence meets Temporal Physics. Ritz Quantum Pulse   represents the convergence of   quantum logic ,   AI-driven analytics , and   real-time economic intelligence . This is
FREE
Dxy Vs Market
Syamsurizal Dimjati
USD STRENGHT VERSUS MARKET USD (DXY) Versus Market Panel is a professional visual indicator designed to analyze US Dollar strength and pressure against major trading symbols in real time. The indicator compares USD performance (based on DXY logic or internal strength calculation) versus selected symbols, allowing traders to quickly identify dominant currency flow, relative strength, and market bias from a single panel view. Built with a clean, lightweight, and non-intrusive panel , this tool hel
FREE
ZIGZAG and FRACTAL CANDLE PRO ( Only candles, No RSI strength panel) " Suitable for QQE RITZ " > Check My Product is an advanced market structure visualization system built for precision trend detection, powered by dynamic fractal logic and adaptive swing validation. It seamlessly identifies Higher Highs (HH), Lower Lows (LL), and key structural shifts — allowing traders to read the true rhythm of market transitions with institutional clarity. This system combines   ZigZag precision ,   fractal
FREE
Ritz Smart Trend Adaptive Finder – Auto-Detect Dynamic Trend Channels A powerful trend detection indicator that adaptively analyzes price structure using dynamic ATR and statistical filters to discover the most significant trend channels on any timeframe and symbol. This tool automatically finds the most relevant period and slope for price movement and draws upper/lower channel zones, midline (mean), and trend support/resistance. Suitable for trend-following, breakout, and mean-reversion strateg
FREE
Conspiracy 16
Syamsurizal Dimjati
3 (1)
Ritz Conspiracy 16 – Multi-Layer Market Intelligence System Ritz Conspiracy 16 adalah indikator analisis pasar multi-layer yang menggabungkan 16 indikator teknikal utama ke dalam satu panel visual terpadu. Dirancang dengan konsep market intelligence , indikator ini bekerja seperti pusat komando yang membaca perilaku pasar dari berbagai sudut: trend, volatilitas, momentum, volume, hingga struktur harga. Dengan pendekatan “konspiratif”, indikator ini menghubungkan jejak kecil dari 16 algoritma unt
FREE
ScalpReactor X
Syamsurizal Dimjati
ScalpReactor X A Tactical Indicator for Precision Traders The Ritz Scalping Habbit is a powerful MT5 indicator designed to help traders execute disciplined, high-probability trades through clear visual cues and multi-strategy confirmations. Whether you’re an intraday scalper or a swing trader , this tool integrates advanced market analysis into a single, easy-to-use interface. Key Strengths: Smart Buy & Sell Arrows — Based on multi-layer signals from RSI, ATR, EMA, ADX, and price momentum. Colo
Scalping Flash X
Syamsurizal Dimjati
SCALPFLASH-X Where Fibonacci Precision Meets RSI Intelligence. Next-gen trading system combining Adaptive Fibonacci Pivots, RSI Heat Mapping, and Smart Candle Analytics. Detect market dominance, momentum shifts, and reversal zones in real time across multiple timeframes. Institutional accuracy, retail simplicity — built for speed, clarity, and precision. Advanced Multi-Timeframe Fibonacci & RSI-Driven Market Intelligence System ScalpFlash-X — A next-generation trading system combining Fibonacc
Detect Trend and Consolidation :  Push Notif for Mobile Trading  Overview Push Notif for Mobile Trading: Detect Trend and Consolidation is a custom MetaTrader 5 (MT5) indicator developed by Ritz_EANEHA that intelligently detects whether the market is in a trend (bullish/bearish) or in consolidation (sideways) . It uses a proprietary comparison of Standard Deviation (StdDev) and Average True Range (ATR) to assess volatility and market structure, and sends mobile push notifications to alert trade
FREE
Manual Trade Helper is an MT5 Expert Advisor designed as an automated assistant for managing manually opened trades. This EA does not open trades on its own, but instead enhances manual trading by automatically managing risk and position settings. Remote Management via VPS + Mobile Devices When deployed on a Virtual Private Server (VPS), the RitzEAneha Manual Trade Helper allows traders to seamlessly manage their trades from anywhere using just a smartphone or tablet. Since the EA runs 24/7 on t
FREE
MultiTimeframe Info Feed (MIF) Indicator Description: MultiTimeframe Info Feed (MIF) is a smart MQL5 indicator that displays a dynamic, real-time info panel directly on your chart, offering powerful insight into current market conditions. Key features include: Real-time display of Open, High, Low, Close, and live Tick price Tick Rate (ticks per second) for assessing market activity Auto-calculated Entry Price on new candle formation Signal direction detection (BUY / SELL) Price action pattern re
FREE
Push Notif for Mobile Trading (Now you can trade perfectly through notifications to your Mobile Gadget, with Signals that you can adjust to your trading style, Use VPS to activate real time trading) Description Push Notif for Mobile Trading is a custom MetaTrader 5 (MT5) indicator designed to send mobile push notifications to traders when certain price or indicator-based conditions are met. This allows traders to monitor markets remotely and act quickly, even when not at their trading terminal.
FREE
Moving Average Sentiment "Transform Raw Market Data into Clear Sentiment Vision" Moving Average Sentiment is a next-generation adaptive trend sentiment indicator that visualizes the true bias of the market — bullish, bearish, or neutral — in real time. It combines Moving Average dynamics with ATR-based volatility zones , creating a fluid, self-adjusting sentiment curve that reacts instantly to price structure and volatility shifts. This tool goes beyond a simple MA — it reads the behavior of th
FREE
PIVOT eXtreme
Syamsurizal Dimjati
Pivot eXtreme Pivot adalah level referensi penting yang digunakan trader untuk memetakan potensi support & resistance intraday maupun jangka lebih panjang. Dalam sistem ini, level pivot dikembangkan menjadi P (Pivot Point utama) , R1–R13 (Resistance) , serta S1–S13 (Support) . Pivot Point (P) Titik pusat utama, dihitung dari rata-rata harga (High + Low + Close) / 3 . Berfungsi sebagai acuan keseimbangan harga : Jika harga di atas P → tren cenderung bullish. Jika harga di bawah P → tren cenderung
FREE
indikator Visual Panel Strengt MultiTimeframe : English Description Visual Panel Strength MultiTimeframe is a real-time trend strength indicator panel that displays the buy/sell pressure across multiple selected timeframes—such as M1, M3, and M5. The indicator utilizes ATR-based volatility analysis and a smoothed trend algorithm to calculate trend signals. Visually presented as a horizontal bar chart at the corner of your main chart, this tool helps traders instantly identify the prevailing
Ritz Candle Maximus
Syamsurizal Dimjati
Candle MAXIMUS RITZ Candle MAXIMUS adalah indikator visual cerdas yang menggabungkan kekuatan analisis tren berbasis Kaufman Adaptive Moving Average (KAMA) , informasi perubahan harian (Daily Change), perbandingan OHLC terhadap hari sebelumnya, serta panel dominasi bar multi-hari. Dirancang untuk semua pair dan semua timeframe, indikator ini menghadirkan tampilan modern, bersih, serta informatif dalam satu panel kompak di chart Anda. Fitur Utama Trend Candle Warna Adaptif (Color Candles) Warna
FREE
Ritz_BUYnSELL_Detection The Ritz_BUYnSELL_Detection is a custom MetaTrader 5 (MT5) indicator that detects BUY and SELL trading signals based on trend detection and ATR-based volatility filtering. It provides visual arrows , entry alerts , and mobile push notifications , making it suitable for traders using a VPS setup for 24/7 signal monitoring. How to Use the Indicator Install on MT5 : Place the .mq5 file in the MQL5/Indicators folder. Compile it in MetaEditor, then apply it to any chart. A
FREE
RitzEAnehaGoodWill
Syamsurizal Dimjati
READ THIS !! to the end Expert Advisor Description:   XAUUSD Reversal Pattern EA (EAneha GoodWill) Important Note: No martingale, averaging or grid Highly dependent on execution quality & low spreads XAUUSD Reversal Pattern EA  is an advanced automated trading robot developed specifically for trading  XAUUSD  (Gold vs USD) on the  M30 timeframe . It uses a robust combination of  candlestick patterns ,  volatility/volume indicators , and  oscillator filters  to identify high-probability reversal
RUHM Reborn
Syamsurizal Dimjati
RUHM REBORN for Micro Account / Cent Account XAUUSD - GOLD (Note: The grid-based system carries high risk during long trends without retrace. Use appropriate capital and understand the risks involved.) RUHM REBORN is a Grid-based Expert Advisor (EA) with ATR Entry developed to provide consistent, stable, and adaptive trading results on the XAUUSD (Gold) pair. This EA is specifically designed for USD Cent accounts, allowing it to run with relatively affordable capital while maintaining stability
Support & Resistance Zone Indicator This indicator dynamically identifies and draws support and resistance zones based on recent price action and fractal patterns. By analyzing ZigZag pivot points and tracking price reactions (touches, bounces, and breaks), the indicator determines the strength and validity of each zone. Key Features: Multi-Timeframe Support: Can work across different timeframes. Fractal-Based Detection: Utilizes both fast and slow fractal detection to find significant swing po
Smart Swing HH - LL Indikator ini dirancang untuk mendeteksi Swing High (HH) dan Swing Low (LL) secara cepat dan akurat pada grafik harga. Deteksi dilakukan berdasarkan analisa range ATR adaptif, konfirmasi pola candlestick (seperti pin bar dan engulfing), serta opsi tambahan menggunakan Fractal untuk validasi. Fitur utama: Deteksi otomatis titik Swing High dan Swing Low menggunakan ATR dan price action. Penyesuaian sensitivitas deteksi berdasarkan ATR multiplier dan range bar . Notifikasi real-
Ritz Smart Support & Resistance Zones Market Structure Based S/RT his advanced indicator detects and displays high-probability support and resistance zones based on actual market structure (swing highs and lows). Using intelligent zone merging and ATR-based fuzz buffers, it ensures the zone blocks are aligned with real price extremes without gaps. Zones are classified by strength (Proven, Verified, Untested, Turncoat, Weak) and visually rendered using colored rectangles. Ideal for traders seeki
Quantum RefleX
Syamsurizal Dimjati
Quantum Reflex Kuantum Reflex is a momentum-based oscillator indicator designed to deliver fast, accurate, and adaptive market insights. Built for real-time trading environments, it enables traders to spot rapid trend reversals, identify overbought/oversold levels, and combine short-term cross signals with higher-timeframe trend confirmation. Key Features Visual Cross Detection → Detects BUY/SELL signals from %K/%D crossover with instant updates for fast reversals. Dynamic Zone Highlight → Autom
BUYER or SELLER
Syamsurizal Dimjati
BUY or SELL FlashScalp Multi-System Indicator The FlashScalp Multi-System Indicator is a next-generation trading tool engineered for precision scalpers, intraday strategists, and professional analysts who demand both speed and clarity in market visualization. It seamlessly integrates smart candle-based analytics, adaptive ATR logic, and real-time economic event awareness — giving you a fully synchronized view of market volatility and momentum. Through an elegant and optimized interface, FlashSc
Candle Analysis Conan
Syamsurizal Dimjati
キャンドル分析コナン Candle Analysis Conan PRO は、 ダイナミックなフラクタルロジックとアダプティブスイング検証エンジンによって構築された、 高精度のトレンド検出と市場構造可視化システムです。 本システムは、HH(高値更新)、LL(安値更新)、および主要な構造変化をシームレスに判別し、 機関投資家レベルの明確さで市場の「本質的なリズム」を読み解くことを可能にします。 ZigZag 精度、フラクタル検証、そしてボリューム認識ロジックを統合し、 SMC(Smart Money Concept)、マーケットストラクチャー分析、 高精度のスイング分析に最適化された設計となっています。 コアエンジンモジュール(Core Engine Modules) 1. ZigZag フラクタル検出 カスタマイズ可能な Fractal_Period による高度なフラクタル認識 ノイズを抑え、構造的な転換点を確実に捉えるアダプティブ ZigZag Min_Deviation による最小変動幅の精密管理 2. トレンド確認フィルター(Trend Confirmation Filter)
필터:
리뷰 없음
리뷰 답변