QQE Indicator MT5
- 지표
-
Do Kim Dang Khoi
 ==============================================
❓ What I Offer
✅ Custom Indicator Design for Expert Advisors (EAs).
✅ Development of Expert Advisors (EAs) with a strong focus on risk management and sustainable growth. - 버전: 1.0
If you love this indicator, please leave a positive rating and comment, it will be a source of motivation to help me create more products <3
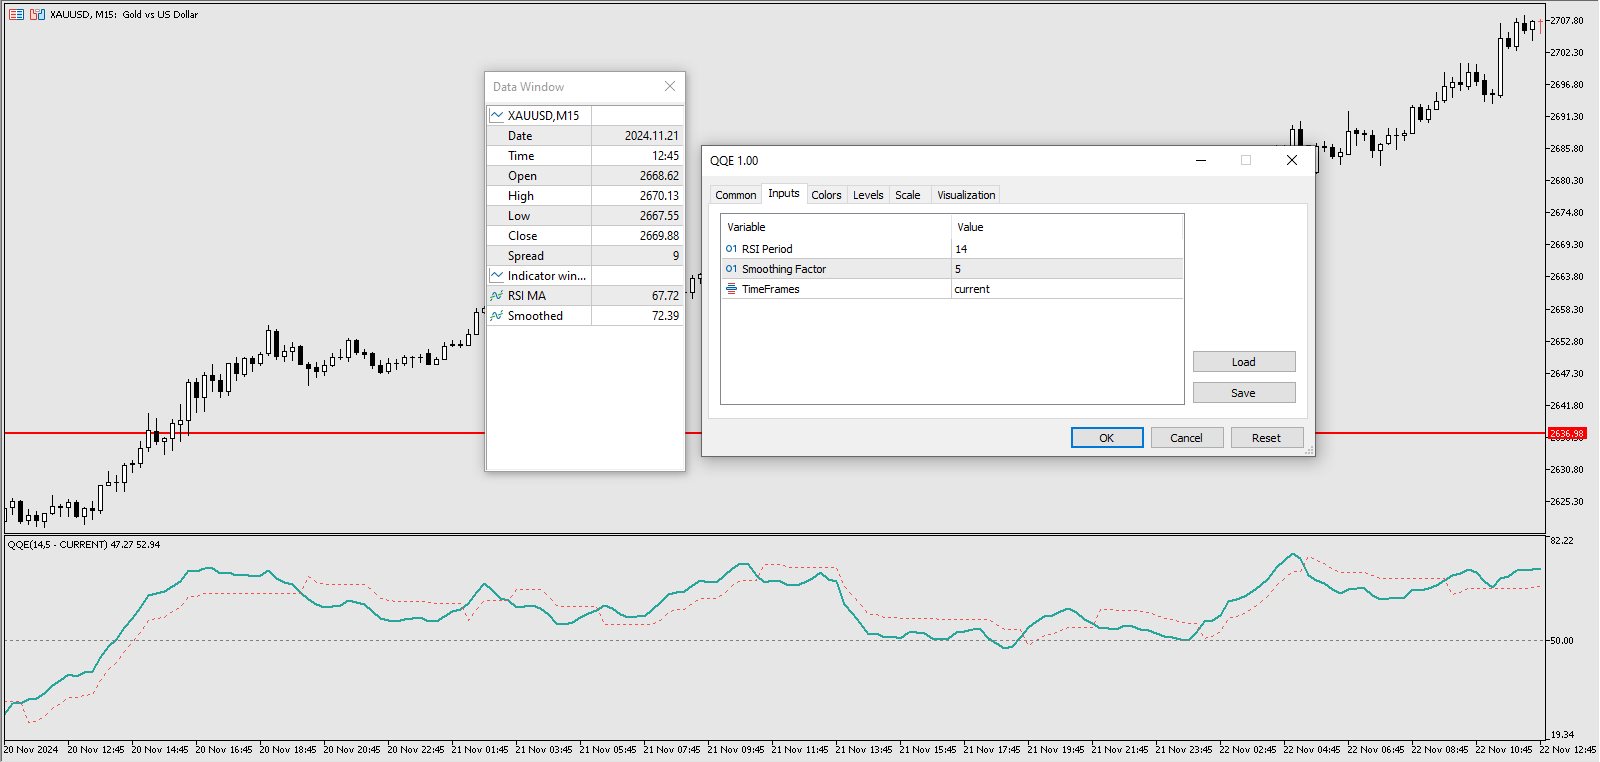
How to use QQE?
- Determine trend when RSI MA above 50 indicate a bullish market, while RSI MA below 50 indicate a bearish market and can server as a trend filter.
- Identify short-term up/down momentum, when the RSI MA crosses up Smoothed signals bullish momentum, and when the RSI MA crosses down Smoothed signals bearish momentum. It is also possible to use intersections as an exit or entry signal.
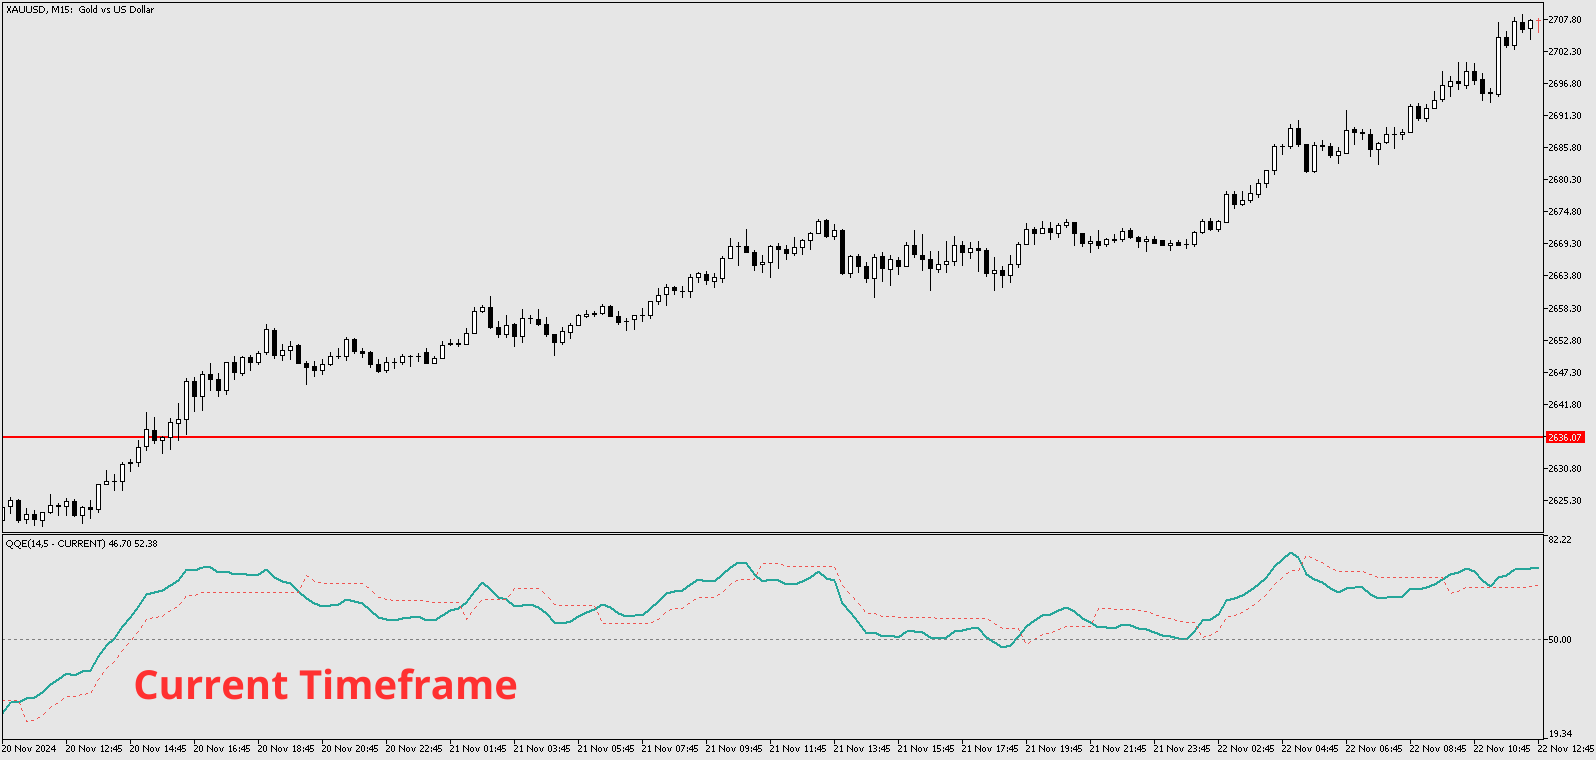
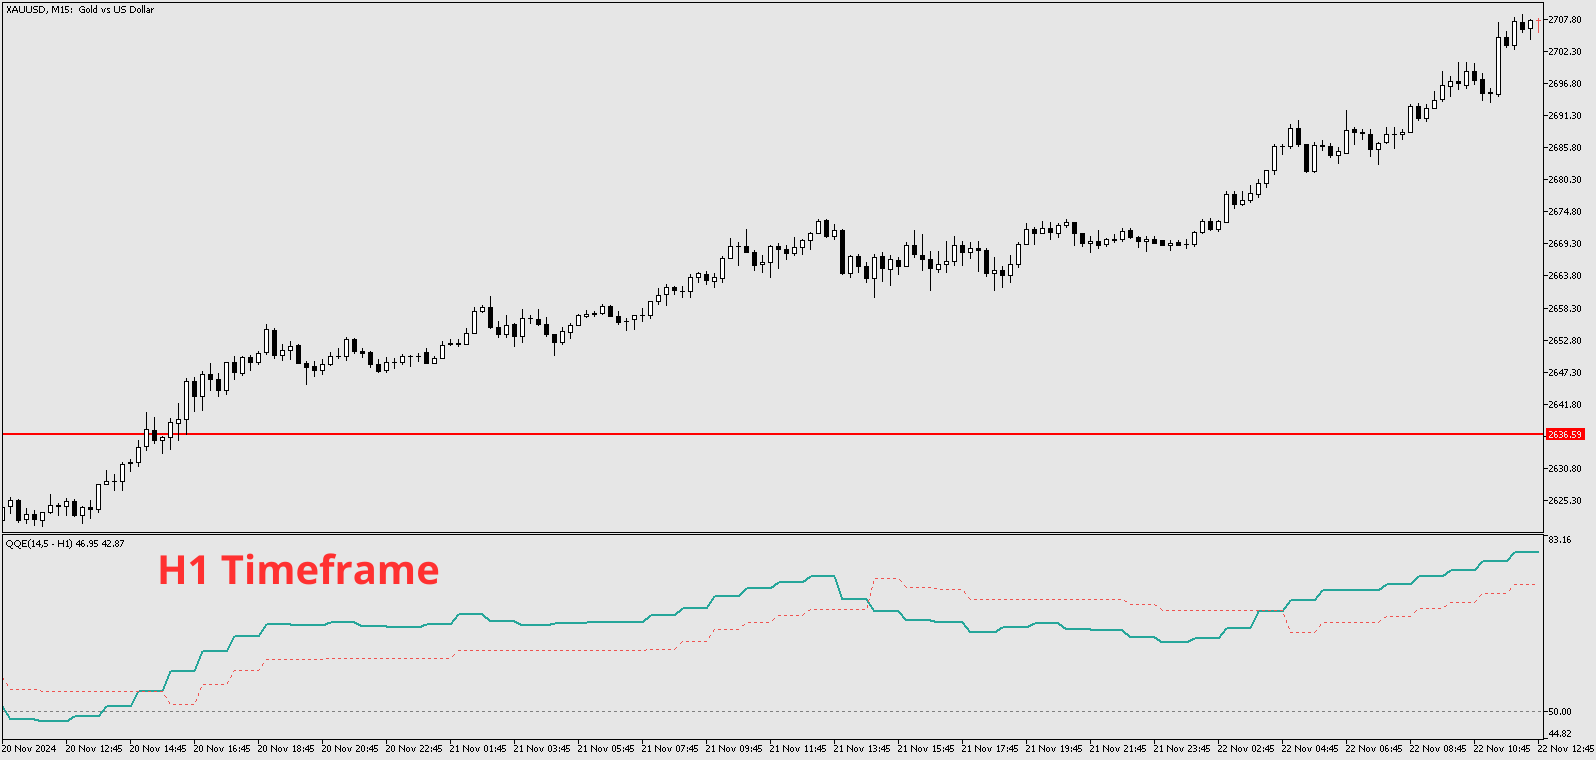
- Traders can adjust the high timeframe to filter out noise signals from the current timeframe. All timeframes available in MT5 for the indicator.


Muy buen indicador me gusto mucho es muy útil para hacer buenas entradas