SuperTrend Original MT5

5

If you love this indicator, please leave a positive rating and comment, it will be a source of motivation to help me create more products <3

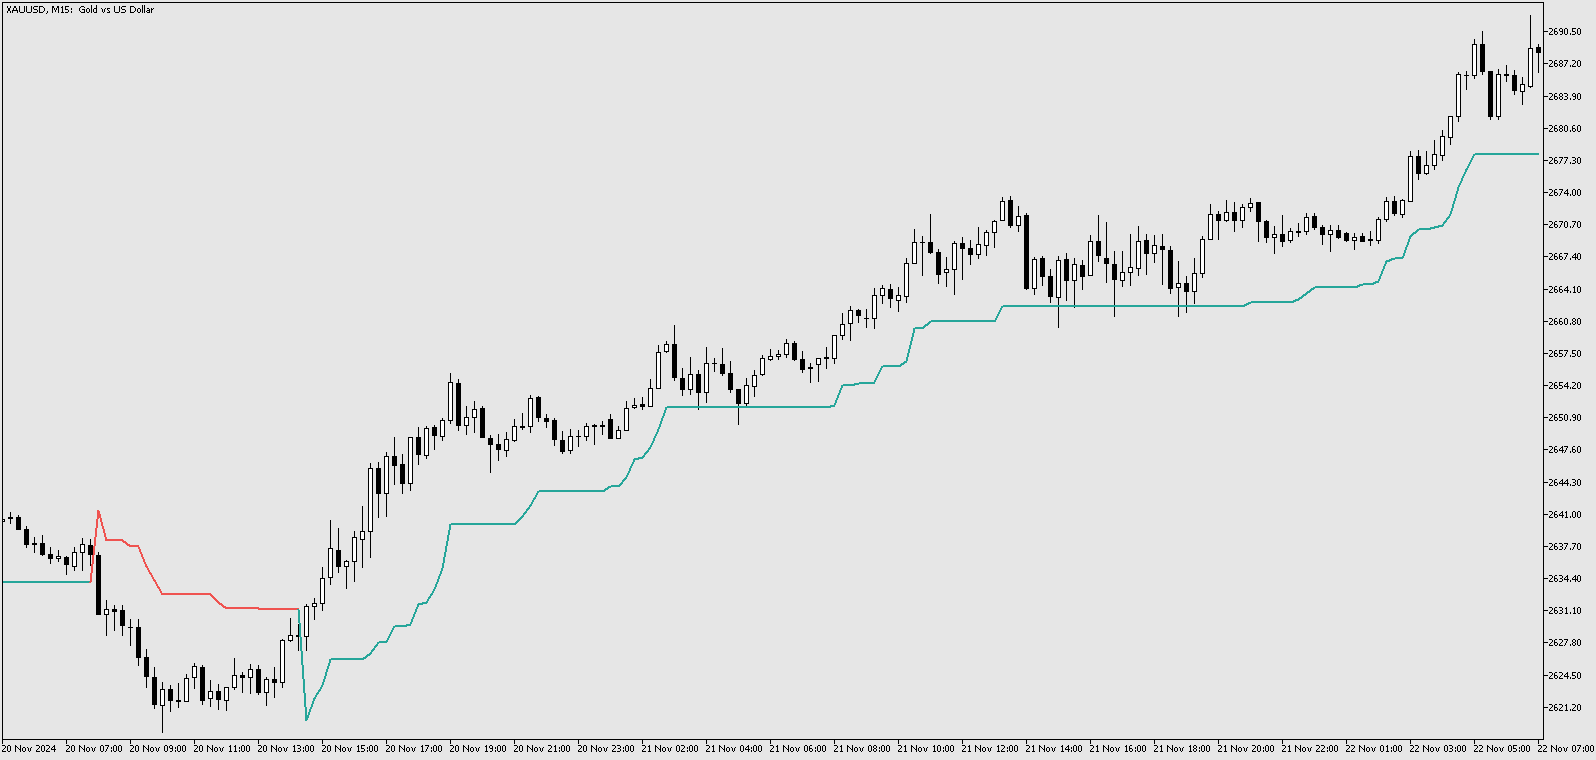
How to use SuperTrend?

  • When the price crosses above the supertrend line it signals a buy signal and when the price crosses below the supertrend line it signals a sell signal.
  • The supertrend indicator which acts as a dynamic level of support or resistance and helps traders make informed decisions about entry and exit points. 
  • When prices are above supertrend line, the market is considered to be trending up, signaling a buying prospect. Conversely, when prices are below the supertrend line, the market is trending downward, indicating a sell opportunity.
  • The supertrend indicator isn't just for pinpointing entry and exit points. It can also be used to set up stop losses. For example, if you are in a long position, you can place a stop-loss order at or below the supertrend line. Similarly, if you are in a short position, you might set a stop-loss order at or above the line.
However, like all indicators, it isn't foolproof, to avoid false signals, it's best to use the supertrend indicator with other indicators. Technical indicators should always be used with others for confirmation.

    리뷰 3
    Gangadhar poonia
    38
    Gangadhar poonia 2025.09.12 10:10 
     

    its nice can we add this to EA

    79095082637
    24
    79095082637 2025.03.29 16:49 
     

    👍

    추천 제품
    Order Book, known also as Market Book, market depth, Level 2, - is a dynamically updated table with current volumes of orders to buy and to sell specific financial instument at price levels near Bid and Ask. MetaTrader 5 provides the means for receiving market book from your broker, but in real time only, without access to its history. The indicator OrderBook Cumulative Indicator accumulates market book data online and visualizes them on the chart. In addition, the indicator can show the market
    CCI Fixed Dual
    Edoardo Centorame
    CCI FIXED DUAL이란 무엇인가 CCI FIXED DUAL은 전문적인 Trend Direction Filter로서, 다음 요소를 정확하게 식별하도록 설계되었습니다. 시장의 지배적인 방향 움직임의 구조적 품질 주요 추세와 가속 구간 사이의 일관성 이것은 직접적인 진입 지표가 아닙니다. 이것은 전통적인 오실레이터가 아닙니다. 이것은 컨텍스트 도구로서, 트레이더가 언제 거래해야 하고 언제 거래하지 말아야 하는지를 결정하도록 돕기 위해 설계되었으며, 시장의 노이즈와 해석 오류를 크게 줄여줍니다. CCI FIXED DUAL의 기본 철학 CCI FIXED DUAL이 기반으로 하는 원칙은 단순하지만 강력합니다. 신호는 시장 구조와 일치할 때만 가치가 있습니다. 이러한 이유로 이 지표는 단일 값을 사용하지 않습니다 가격에 충동적으로 반응하지 않습니다 억지 반전 지점을 찾지 않습니다 대신 다음 요소를 기반으로 계층적인 추세 해석을 구축합니다. Typical Price 기반 CCI 서로 다른
    Statistical Arbitrage Spread Generator for Cointegration [MT5] What is Pair Trading? Pair trading is a market-neutral strategy that looks to exploit the relative price movement between two correlated assets — instead of betting on the direction of the market. The idea? When two assets that usually move together diverge beyond a statistically significant threshold, one is likely mispriced. You sell the expensive one, buy the cheap one , and profit when they converge again. It’s a statistica
    FREE
    The indicator detects and displays М. Gartley's Butterfly pattern. The pattern is plotted by the extreme values of the ZigZag indicator (included in the resources, no need to install). After detecting the pattern, the indicator notifies of that by the pop-up window, a mobile notification and an email. The pattern and wave parameters are displayed on the screenshots. The default parameters are used for demonstration purposes only in order to increase the amount of detected patterns. Parameters z
    CosmiCLab FIBO
    Kirils Subins
    CosmiCLab SMC FIBO CosmiCLab SMC FIBO is a professional trading indicator designed for traders who use Smart Money Concepts (SMC), market structure analysis and Fibonacci retracement levels. The indicator automatically detects market swings and builds Fibonacci levels based on the latest impulse movement. It also identifies market structure changes such as BOS (Break of Structure) and CHOCH (Change of Character), helping traders understand the current market direction. CosmiCLab SMC FIBO also pr
    SlopeChannelB MT5
    MIKHAIL VINOGRADOV
    SlopeChannelB – 경사진 가격 이동 채널을 구축하는 기술 분석 도구로, 시장 현황을 평가하고 거래 신호를 찾는 데 독특한 기회를 제공합니다. 지표의 주요 특징: 경사진 가격 이동 채널 : 이 지표는 지지와 저항 수준을 시각화하는 데 도움을 주며, 이는 추세의 반전 또는 지속 가능성을 나타낼 수 있습니다. 다양한 선 색상 및 배경 강조 : 경사진 지지 및 저항 수준은 다양한 색상으로 표시되며, 채널 자체는 배경이 추가로 강조되어 차트의 시각적 분석을 단순화합니다. 선 계산을 위한 세 가지 옵션 : 지표는 회귀 분석을 사용하여 채널 라인을 구성합니다. 세 가지 방법 중 하나를 선택할 수 있습니다: Robust (기본값) – 이상치에 강한 방법입니다. OLS (최소제곱법) . Median (중앙값 계산) . 최적의 모델 선택 : SlopeChannelB는 다섯 가지 품질 기준의 분석을 기반으로 가장 적합한 채널 라인 변형을 자동으로 선택합니다. 품질 매개변수는 차트에
    평균 방향 지수(ADX) 다중 통화 스캐너 MT5는 여러 통화 쌍을 동시에 분석하도록 설계된 고급 거래 지표입니다. 이는 평균 방향 지수를 기반으로 한 실시간 신호를 제공하여 거래자들이 의사 결정 과정을 향상시키는 데 도움을 줍니다. 이를 통해 효율적인 시장 추세 분석이 가능합니다. 이 도구는 추세 강도와 방향 이동을 쉽게 식별할 수 있도록 하여 거래 경험을 간소화하며, ADX 기반 전략을 사용하는 거래자에게 필수 자산이 됩니다. 실시간 알림과 사용자 친화적인 대시보드를 통해 거래자들은 시장 상황을 신속하게 평가하고 정보에 기반한 거래 결정을 내릴 수 있습니다. MQL 제품 설치 가이드 | 구매한 MQL 제품 업데이트 MT4/MT5 | 일반 문제 해결 가이드 | 지표 설정 / 가이드 주요 기능 버퍼 통합: 지표 값을 접근 가능한 버퍼로 노출하여 Expert Advisor가 자동 거래를 위해 신호 데이터를 활용할 수 있도록 합니다. 시각적 화살표 신호: 신호 캔들에 직접 차트에 명확한
    개요 Candle Timer Countdown Pro는 현재 캔들의 마감까지 남은 시간을 부드럽고 정확하게 카운트다운으로 표시하며, 원형 진행 아크를 통해 남은 시간을 직관적으로 보여줍니다. 서버 시간 보간(Server Time Interpolation) 기술을 사용하여 틱이 없는 구간에서도 멈춤 없이 부드럽게 작동합니다. M1부터 MN까지 모든 타임프레임을 지원합니다. 스캘핑(1분 차트)부터 스윙 트레이딩(H4 이상)까지, 캔들 마감 시간을 정확히 파악하면 진입 타이밍을 개선하고 성급한 결정을 방지할 수 있습니다. 주요 특징 틱 간 멈춤 없는 정확한 카운트다운 원형 진행 표시 (Ring 또는 Filled Pie) 6가지 표시 위치 선택 가능 3가지 색상 모드 (Manual / Candle Outline / Candle Body) 마감 직전 하이라이트 기능 연결 상태 감지 (Active / Inactive / Disconnected) 새 캔들 알림 (팝업, 이메일, 푸시) 모든 타임
    Dynamic Zones
    Kee Huang Tan
    Dynamic Supply and Demand indicator automatically identifies and displays Supply and Demand Zones on your chart based on price action patterns and market structure.  These zones represent areas where institutional buying or selling pressure has historically occurred, making them key levels for potential price reactions. This form of indicator takes inspiration from ICT as well as traditional Support & Resistance formation. **For the first 50 candles (number depends on LookBackCandles) when indic
    FREE
    Price Magnet — Price Density and Attraction Levels Indicator Price Magnet is a professional analytical tool designed to identify key support and resistance levels based on statistical Price Density. The indicator analyzes a specified historical period and detects price levels where the market spent the most time. These zones act as “magnets,” attracting price action or forming a structural base for potential reversals. Unlike traditional Volume Profile tools, Price Magnet focuses on price-time d
    The  Kijun-Sen Envelope  is a powerful trend-following indicator based on the  Kijun-Sen  line from the Ichimoku Kinko Hyo system. This tool creates dynamic upper and lower bands around the Kijun-Sen, forming an envelope that helps traders identify market trends, potential reversals, and overbought/oversold conditions. Key Features: • Trend Confirmation – Helps determine whether the market is in a strong uptrend, downtrend, or ranging phase. • Support & Resistance Zones – The envelope acts as
    FREE
    표시기는 현재 시세를 작성하여 과거 시세와 비교할 수 있으며 이를 바탕으로 가격 변동을 예측합니다. 표시기에는 원하는 날짜로 빠르게 이동할 수 있는 텍스트 필드가 있습니다. 옵션: 기호 - 표시기가 표시할 기호 선택. SymbolPeriod - 지표가 데이터를 가져올 기간 선택. IndicatorColor - 표시기 색상. HorisontalShift - 지시자가 그린 따옴표를 지정된 막대 수만큼 이동합니다. Inverse - true는 인용 부호를 반대로, false - 원래 보기를 반전합니다. ChartVerticalShiftStep - 차트를 수직으로 이동합니다(키보드의 위/아래 화살표). 다음은 날짜를 입력할 수 있는 텍스트 필드의 설정으로, '엔터'를 누르면 즉시 이동할 수 있습니다.
    Account Monitor Pro — Your Ultimate Trade Statistics Hub Account Monitor Pro is a professional information dashboard designed for traders who combine Expert Advisors (EAs) and manual trading. The indicator separates statistics in real-time based on your Magic Number, allowing you to clearly see who is driving the profit: the algorithm or yourself. Key Features: Split Monitoring: Instant separation of "Robot" positions (by Magic Number) and "Manual" trades. Multi-language Support: 11 languages in
    FREE
    Indicator and Expert Adviser  EA Available in the comments section of this product. Download with Indicator must have indicator installed for EA to work. Mt5 indicator alerts for bollinger band and envelope extremes occurring at the same time. Buy signal alerts occur when A bullish candle has formed below both the lower bollinger band and the lower envelope  Bar must open and close below both these indicators. Sell signal occur when A bear bar is formed above the upper bollinger band and upper
    FREE
    Free automatic Fibonacci is an indicator that automatically plots a Fibonacci retracement based on the number of bars you select on the BarsToScan setting in the indicator. The Fibonacci is automatically updated in real time as new highest and lowest values appears amongst the selected bars. You can select which level values to be displayed in the indicator settings. You can also select the color of the levels thus enabling the trader to be able to attach the indicator several times with differe
    FREE
    Visual Dolphin Indicator
    AL MOOSAWI ABDULLAH JAFFER BAQER
    Visual Dolphin Indicator Unlock the rhythm of the market with the Visual Dolphin Indicator, your ultimate tool for identifying and capitalizing on market trends with clarity and confidence. Designed for both novice and experienced traders, this indicator eliminates the noise and guesswork, providing crystal-clear buy and sell signals directly on your chart. The Logic Behind the Waves The core of the Visual Dolphin Indicator is a sophisticated yet intuitive dual-wave system based on moving avera
    MT5용 암호화폐 외환 지표 "WPR with 2 Moving Averages" (리페인트 없음) - WPR 자체는 스캘핑에 가장 적합한 오실레이터 중 하나입니다. - "WPR and 2 Moving Averages" 지표는 WPR 오실레이터의 빠른 이동평균과 느린 이동평균을 함께 보여줍니다. - 이 지표는 가격 조정을 매우 빠르게 감지할 수 있도록 도와줍니다. - 매개변수를 통해 간편하게 설정할 수 있으며, 모든 시간대에 사용 가능합니다. - 매수 및 매도 진입 조건은 그림에서 확인할 수 있습니다. - WPR MA 교차 시 PC 및 모바일 알림 기능 제공. 매수 신호 조건 예시: (1) 빠른 이동평균이 느린 이동평균을 상향 돌파하고 WPR 값이 -50 미만이면 매수 진입. (2) WPR 값이 -20 이상으로 과매수 영역에 진입하면 매수 포지션 청산. 매도 신호 조건 예시: (1) 빠른 이동평균이 느린 이동평균을 하향 돌파하고 WPR 값이 -50 이상이면 매도 진입. (2) -
    Recognizer 1 2 3 Patterns
    Gennadiy Stanilevych
    4.67 (36)
    The indicator is intended for recognition and marking 1-2-3 buy and sell patterns on a chart. The indicator will help a trade to determine the starting and signal fractals, and to specify the possible entry points on all timeframes in МetaTrader 5. Fibonacci lines are drawn on the chart to indicate supposed targets of moving on the basis of the wave theory. The 1-2-3 formations appear to be especially important as divergences (convergences) are formed on price tops and bottoms. The indicator has
    FREE
    SC MTF Rsi MT5
    Krisztian Kenedi
    5 (7)
    다중 타임프레임 지원, 사용자 정의 시각 신호 및 구성 가능한 알림 시스템을 갖춘 상대강도지수(RSI) 지표. 프리랜서 프로그래밍 서비스, 업데이트 및 기타 TrueTL 제품은 제 MQL5 프로필 에서 확인하실 수 있습니다. 피드백과 리뷰를 진심으로 환영합니다! RSI란 무엇인가요? 상대강도지수(RSI)는 가격 변화의 속도와 크기를 측정하는 모멘텀 오실레이터입니다. 이 지표는 0에서 100 사이에서 진동하며, 지정된 기간 동안 최근 상승폭과 최근 하락폭의 크기를 비교합니다. RSI는 주로 과매수 및 과매도 상태를 식별하는 데 사용됩니다. 높은 수치는 과매수 상태를 나타내고, 낮은 수치는 과매도 상태를 나타냅니다. 트레이더들은 또한 RSI와 가격 움직임 사이의 다이버전스를 주시하며, 이는 잠재적인 추세 전환을 신호할 수 있습니다. 기능: 화살표와 수직선을 사용한 시각적 신호 마커 구성 가능한 트리거(방향 변경, 레벨 교차, 고점/저점, 극단 구역)가 있는 세 개의 독립적인 신호
    FREE
    The   Trendlines Oscillator   helps traders identify trends and momentum based on the normalized distances between the current price and the most recently detected bullish and bearish trend lines. The indicator features bullish and bearish momentum, a signal line with crossings, and multiple smoothing options. USAGE The   Trendlines Oscillator   works by systematically: Identifying pivot highs and lows. Connecting pivots to form bullish (support) and bearish (resistance) trendlines. Measuring
    Show Pips for MT5
    Roman Podpora
    4.54 (28)
    이 정보 표시기는 계정의 현재 상황을 항상 알고 싶어하는 사람들에게 유용합니다. VERSION MT 4 -   More useful indicators 표시기는 포인트, 백분율, 통화 단위의 이익뿐만 아니라 현재 쌍의 스프레드와 현재 기간에서 막대가 마감될 때까지의 시간과 같은 데이터를 표시합니다. 차트에 정보선을 배치하는 데는 여러 가지 옵션이 있습니다. 가격 오른쪽(가격보다 뒤에 있음) 코멘트(차트의 왼쪽 상단) 화면의 선택된 모서리에 있습니다. 정보 구분 기호를 선택할 수도 있습니다. | / \ # 이 표시기는 사용하기 쉽고 매우 유익합니다. 설정에서 불필요한 정보 항목을 비활성화할 수 있습니다. 설정 외모의 종류       - 정보 라인 표시 유형. 세 가지 옵션이 있습니다: 가격을 따르세요       - 가격을 따르세요. 댓글로       - 코멘트로; 화면의 선택된 모서리에서       - 화면의 선택한 모서리에 있습니다. 첨부용 그래프 코너       - 화면의 선택한
    FREE
    Size Bars
    Viktor Loginov
    Size Bars – индикатор отображает на графике максимальный, минимальный, текущий и средний размер баров (свечей) за выбранный период. Отображаемые параметры индикатора Size Bars: 1)       Текущий размер бара в писах (по максимум/минимум, тело бара). 2)       Максимальный, минимальный и средний размер свечей BUY . 3)       Максимальный, минимальный, средний размер свечей SELL . 4)       Количество свечей BUY и количество свечей SELL . 5)       Среднее количество свечей подряд BUY и SELL . 6)     
    All-in-One Chart Patterns Professional Level: The Ultimate 36-Pattern Trading System All-in-One Chart Patterns Professional Level is a comprehensive 36-pattern indicator well known by retail traders, but significantly enhanced with superior accuracy through integrated news impact analysis and proper market profile positioning. This professional-grade trading tool transforms traditional pattern recognition by combining advanced algorithmic detection with real-time market intelligence.  CORE FEATU
    FREE
    Mirror Chart MT5
    Andrej Hermann
    5 (1)
    The Mirror Chart MT5 is a overlay indicator specifically designed to project a second financial instrument directly onto the main chart window. This tool is invaluable for traders who rely on correlation analysis, as it visualizes the price movements of two different instruments in real time. Unlike traditional overlays, this indicator utilizes intelligent, dynamic centering and scaling logic. It continuously analyzes the visible price range in the current window for both symbols and calculates
    FREE
    MACD Enhanced
    Nikita Berdnikov
    5 (3)
    Introducing the MACD  Enhanced – an advanced MACD (Moving Average Convergence Divergence) indicator that provides traders with extended capabilities for trend and momentum analysis in financial markets. The indicator uses the difference between the fast and slow exponential moving averages to determine momentum, direction, and strength of the trend, creating clear visual signals for potential entry and exit points. Attention! To achieve the best results, it is recommended to adapt the indicator
    FREE
    Stamina HUD
    Michele Todesco
    STAMINA HUD – Advanced Market & Trend Dashboard (MT5) STAMINA HUD   is a professional   market information panel   designed for traders who want   clarity, speed, and control   directly on the chart. It provides a   clean heads-up display (HUD)   with essential market data and   multi-timeframe trend direction , without cluttering the chart or generating trading signals. What STAMINA HUD Shows   Current Price   Spread (in real pips)   Today High–Low range (pips)   Average D
    FREE
    DALA Forecast
    Grigorii Matsnev
    About the indicator: DALA Forecast is a universal tool for predicting the dynamics of time series of any nature. For prediction, modified methods of nonlinear dynamics analysis are used, on the basis of which a predictive model is built using machine learning methods.  To get the trial version of the indicator, you can contact me in private messages. How to use the indicator: Apply the indicator to your chosen financial instrument or indicator with the settings you need. The prediction will be
    FREE
    PZ Penta O MT5
    PZ TRADING SLU
    3.5 (4)
    The Penta-O is a 6-point retracement harmonacci pattern which usually precedes big market movements. Penta-O patterns can expand and repaint quite a bit. To make things easier this indicator implements a twist: it waits for a donchian breakout in the right direction before signaling the trade. The end result is an otherwise repainting indicator with a very reliable trading signal. The donchian breakout period is entered as an input. [ Installation Guide | Update Guide | Troubleshooting | FAQ | A
    FREE
    SmartPullback
    Samuel Jesus Fidalgo Lopez
    Smart Pullback Pro v4 High-Probability Pullback Indicator for MT5 Smart Pullback Pro v4 is a professional trend-following indicator for MetaTrader 5 that identifies high-probability pullback entries in real time. It automatically plots entry zones, Stop Loss, and Take Profit levels directly on the chart, giving traders a complete visual trading plan with every signal. How It Works Smart Pullback Pro v4 combines multiple confluence filters to eliminate low-quality signals and focus only on va
    FREE
    SPIKE Radar Alet
    Odete Argelio Simbine
    SPIKE DETECTOR RADAR ALERT – Surgical Precision in Explosive Market Movements Master market spikes with early alerts and high probability accuracy. Spike Detector Radar Alert is an advanced indicator for MetaTrader 5, developed to identify sudden price movements (spikes) in advance with enhanced precision. By combining volatility analysis, momentum strength, and price acceleration, the algorithm delivers clear signals at key market moments. Why traders choose Spike Detector Radar Alert: Mul
    이 제품의 구매자들이 또한 구매함
    ARIPoint
    Temirlan Kdyrkhan
    ARIPoint is a powerful trading companion designed to generate high-probability entry signals with dynamic TP/SL/DP levels based on volatility. Built-in performance tracking shows win/loss stats, PP1/PP2 hits, and success rates all updated live. Key Features: Buy/Sell signals with adaptive volatility bands Real-time TP/SL/DP levels based on ATR Built-in MA Filter with optional ATR/StdDev volatility Performance stats panel (Success, Profit/Loss, PP1/PP2) Alerts via popup, sound, push, or email Cu
    SuperScalp Pro
    Van Minh Nguyen
    4.61 (23)
    SuperScalp Pro – 고급 멀티 필터 스캘핑 지표 시스템 SuperScalp Pro는 클래식 Supertrend와 여러 지능형 확인 필터를 결합한 고급 스캘핑 지표로, 거래 기회를 식별하는 데 도움을 줍니다. M1부터 H4까지 다양한 시간대에서 효율적으로 작동하며, XAUUSD, BTCUSD 및 주요 Forex 통화쌍에 최적화되어 있습니다. 이 지표는 명확한 매수 및 매도 신호를 제공하며, ATR 기반으로 진입가, 손절가, 익절가를 자동 계산하여 보다 효과적인 리스크 관리를 지원합니다. Fibonacci Take Profit 기능은 중요한 가격 구간에서 더 빠르게 포지션을 청산할 수 있도록 하며, 해당 수준 도달 시 알림을 전송합니다. 기본 설정은 Fibonacci Take Profit이 활성화된 상태로 최적화되어 있으며, 보다 안정적이고 일관된 거래 경험에 중점을 둡니다. 차트에 적용하는 것만으로 즉시 사용할 수 있습니다. 고급 사용자를 위해 모든 파라미터는 자유롭게 사용
    Entry In The Zone and SMC Multi Timeframe is a real-time 2-in-1 market analysis tool that combines market structure analysis and a No Repaint BUY / SELL signal system into a single indicator, built on Smart Money Concepts (SMC) — a widely adopted framework used by professional traders to understand market structure. This indicator helps you see the market more clearly, make decisions based on structure rather than guesswork, and focus on high-probability zones where price is more likely to react
    SignalTech MT5
    Yue Wang
    5 (17)
    SignalTech MT5 is a fully rule based trading system for EURUSD, USDCHF, USDJPY, AUDUSD, NZDUSD, EURJPY, AUDJPY, NZDJPY, CADJPY.  All the winning trades with chart setups are published on the comments page. 2025-12 1174 Pips 2026-01 2624 Pips 2026-02 2937 Pips 2026-03 2165 Pips 2026-04 2243 Pips It can generate signals with Buy/Sell Arrows and Pop-Up/Sound Alerts. Each signal has clear Entry and Stop Loss levels, which should be automatically flagged on the chart, as well as potential Targets 1,
    Divergence Bomber
    Ihor Otkydach
    4.9 (87)
    이 지표를 구매하신 분께는 다음과 같은 혜택이 무료로 제공됩니다: 각 거래를 자동으로 관리하고, 손절/익절 수준을 설정하며, 전략 규칙에 따라 거래를 종료하는 전용 도우미 툴 "Bomber Utility" 다양한 자산에 맞게 지표를 설정할 수 있는 셋업 파일(Set Files) "최소 위험", "균형 잡힌 위험", "관망 전략" 모드로 설정 가능한 Bomber Utility의 셋업 파일 이 전략을 빠르게 설치, 설정, 시작할 수 있도록 돕는 단계별 영상 매뉴얼 주의: 위의 모든 보너스를 받기 위해서는 MQL5 개인 메시지 시스템을 통해 판매자에게 연락해 주세요. 독창적인 커스텀 지표인 “Divergence Bomber(다이버전스 봄버)”를 소개합니다. 이 지표는 MACD 다이버전스(괴리) 전략을 기반으로 한 올인원(All-in-One) 거래 시스템입니다. 이 기술 지표의 주요 목적은 가격과 MACD 지표 간의 다이버전스를 감지하고, **향후 가격이 어느 방향으로 움직일지를 알려주는
    Azimuth Pro
    Ottaviano De Cicco
    5 (7)
    Azimuth Pro V2: Synthetic Fractal Structure and Confirmed Entries for MT5 Overview Azimuth Pro is a multi-level swing structure indicator by Merkava Labs . Four nested swing layers, swing-anchored VWAP, ABC pattern detection, three-timeframe structural filtering, and closed-bar confirmed entries — one chart, one workflow from micro-swings to macro-cycles. This is not a blind signal product. It is a structure-first workflow for traders who care about location, context, and timing. V2 Launch Offe
    Gold Entry Sniper
    Tahir Mehmood
    5 (9)
    Gold Entry Sniper – 골드 스캘핑 & 스윙 트레이딩을 위한 전문 다중 시간 프레임 ATR 대시보드 Gold Entry Sniper 는 XAUUSD 및 기타 종목에 대해 정확한 매수/매도 신호 를 제공하는 고급 MetaTrader 5 지표입니다. ATR 트레일링 스톱 로직 과 다중 시간 프레임 분석 을 기반으로 설계되어 스캘핑과 스윙 트레이딩 모두에 적합합니다. 주요 기능 및 장점 다중 시간 프레임 분석 – M1, M5, M15 추세를 한눈에 확인. ATR 기반 트레일링 스톱 – 변동성에 따라 자동 조정. 전문 차트 대시보드 – 신호 상태, ATR 레벨, 회귀선, 매매 방향 표시. 명확한 매수/매도 마커 – 자동 화살표와 텍스트 라벨. 종료 알림 & 거래 관리 – 수익 보호를 위한 자동 종료 감지. 완전 사용자 설정 가능 – 대시보드 위치, 색상, ATR/회귀선 파라미터 조정. 골드(XAUUSD) 최적화 – M1~M15 스캘핑에 완벽, 외환/지수/암호화폐에도 적용 가능.
    Power Candles MT5
    Daniel Stein
    5 (8)
    Power Candles V3 - 자체 최적화 강도 지표 파워 캔들 V3는 적용된 모든 차트에서 통화 및 상품의 강세를 실행 가능한 거래 계획으로 전환합니다. 단순히 캔들에 색상을 입히는 대신, 백그라운드에서 실시간 자동 최적화를 수행하여 현재 보고 있는 종목에 대한 최적의 손절매, 익절 및 신호 임계값을 제공합니다. 한 번의 클릭으로 실시간 거래에 적용할 수 있으며, 진입점, 손절매 및 익절 선이 정확한 가격에 맞춰 차트에 표시되고, 방향과 함께 알림이 발령됩니다. 이 도구는 Stein Investments 에코시스템의 일부입니다. 18개 이상의 도구와 함께 당신의 1대1 AI 트레이딩 멘토 Max.  항상 대기 중, 모든 인디케이터를 깊이 있게 이해, 무언가를 차근차근 생각해보고 싶은 순간에 도움을 줍니다.  https://stein.investments 에서 만나보세요 매 종가 바마다 3,000회 이상의 트레이딩 시뮬레이션. 9가지 강도 상태. 2가지 전략을 병렬로 테스트.
    FX Trend MT5 NG
    Daniel Stein
    5 (4)
    FX Trend NG: 차세대 멀티 마켓 트렌드 인텔리전스 개요 FX Trend NG 는 다중 시간 프레임 기반의 전문 트렌드 분석 및 시장 모니터링 도구입니다. 몇 초 만에 전체 시장 구조를 파악할 수 있도록 설계되었습니다. 여러 차트를 일일이 전환할 필요 없이, 어떤 종목이 추세에 있는지, 어디에서 모멘텀이 약화되고 있는지, 그리고 어떤 시간 프레임이 서로 정렬되어 있는지 즉시 확인할 수 있습니다. 출시 기념 특별 혜택 – FX Trend NG 를 $30 (6개월) 또는 $80 평생 라이선스 로 이용할 수 있습니다. 이미 Stein Investments 고객이신가요? -> 메시지를 보내 전용 고객 그룹에 참여하세요. 설정이나 사용 방법이 필요하신가요? -> Stein Investments 공식 페이지 를 방문하세요. 1. FX Trend NG가 특별한 이유 3단계 추세 로직 – 단순한 Buy / Sell이 아닙니다 • 대부분의 지표는 Buy 또는 Sell 두 가지 상태만 제
    Quantum TrendPulse
    Bogdan Ion Puscasu
    5 (23)
    SuperTrend   ,   RSI   ,   Stochastic   의 힘을 하나의 포괄적인 지표로 결합하여 트레이딩 잠재력을 극대화하는 궁극의 트레이딩 도구   인 Quantum TrendPulse를   소개합니다. 정밀성과 효율성을 추구하는 트레이더를 위해 설계된 이 지표는 시장 추세, 모멘텀 변화, 최적의 진입 및 종료 지점을 자신 있게 식별하는 데 도움이 됩니다. 주요 특징: SuperTrend 통합:   주요 시장 추세를 쉽게 따라가고 수익성의 물결을 타세요. RSI 정밀도:   매수 과다 및 매도 과다 수준을 감지하여 시장 반전 시점을 파악하는 데 적합하며 SuperTrend 필터로 사용 가능 확률적 정확도:   변동성이 큰 시장에서 숨겨진 기회를 찾기 위해 확률적 진동   을 활용하고 SuperTrend의 필터로 사용 다중 시간대 분석:   M5부터 H1 또는 H4까지 다양한 시간대에 걸쳐 시장을 최신 상태로 유지하세요. 맞춤형 알림:   맞춤형 거래 조건이 충족되면
    Gann Made Easy MT5
    Oleg Rodin
    5 (4)
    Gann Made Easy 는 mr.의 이론을 사용하여 최고의 거래 원칙을 기반으로 하는 전문적이고 사용하기 쉬운 Forex 거래 시스템입니다. W.D. 간. 이 표시기는 Stop Loss 및 Take Profit Levels를 포함하여 정확한 BUY 및 SELL 신호를 제공합니다. PUSH 알림을 사용하여 이동 중에도 거래할 수 있습니다. 구매 후 거래 방법 안내 및 유용한 추가 지표를 무료로 받으시려면 저에게 연락주세요! 아마도 Gann 거래 방법에 대해 이미 여러 번 들었을 것입니다. 일반적으로 Gann의 이론은 초보자 거래자뿐만 아니라 이미 거래 경험이 있는 사람들에게도 매우 복잡한 것입니다. Gann의 거래 방식은 이론적으로 적용하기 쉽지 않기 때문입니다. 나는 그 지식을 연마하고 Forex 지표에 최고의 원칙을 적용하기 위해 몇 년을 보냈습니다. 표시기는 적용하기가 매우 쉽습니다. 차트에 첨부하고 간단한 거래 권장 사항을 따르기만 하면 됩니다. 지표는 지속적으로 시장 분석
    이 지표를 구매하면 제 프로페셔널 트레이드 매니저를 무료로 드립니다. 우선 이 거래 시스템이 리페인팅, 리드로잉 및 레이그 인디케이터가 아니라는 점을 강조하는 것이 중요합니다. 이는 수동 및 로봇 거래 모두에 이상적인 것으로 만듭니다. 온라인 강좌, 설명서 및 프리셋 다운로드. "스마트 트렌드 트레이딩 시스템 MT5"은 새로운 및 경험이 풍부한 트레이더를 위해 맞춤형으로 제작된 종합적인 거래 솔루션입니다. 10개 이상의 프리미엄 인디케이터를 결합하고 7개 이상의 견고한 거래 전략을 특징으로 하여 다양한 시장 조건에 대한 다목적 선택이 가능합니다. 트렌드 추종 전략: 효과적인 트렌드 추이를 타기 위한 정확한 진입 및 손절 관리를 제공합니다. 반전 전략: 잠재적인 트렌드 반전을 식별하여 트레이더가 범위 시장을 활용할 수 있게 합니다. 스캘핑 전략: 빠르고 정확한 데이 트레이딩 및 단기 거래를 위해 설계되었습니다. 안정성: 모든 인디케이터가 리페인팅, 리드로잉 및 레이그가 아니므로 신뢰
    우선적으로, 이 거래 도구는 전문적인 거래에 이상적인 비-다시 그리기 및 지연되지 않는 지표입니다.  온라인 강좌, 사용자 매뉴얼 및 데모. 스마트 가격 액션 컨셉트 인디케이터는 신규 및 경험 많은 트레이더 모두에게 매우 강력한 도구입니다. Inner Circle Trader Analysis 및 Smart Money Concepts Trading Strategies와 같은 고급 거래 아이디어를 결합하여 20가지 이상의 유용한 지표를 하나로 결합합니다. 이 인디케이터는 스마트 머니 컨셉트에 중점을 두어 대형 기관의 거래 방식을 제공하고 이동을 예측하는 데 도움을 줍니다.  특히 유동성 분석에 뛰어나 기관이 어떻게 거래하는지 이해하는 데 도움을 줍니다. 시장 트렌드를 예측하고 가격 변동을 신중하게 분석하는 데 탁월합니다. 귀하의 거래를 기관 전략에 맞추어 시장의 동향에 대해 더 정확한 예측을 할 수 있습니다. 이 인디케이터는 시장 구조를 분석하고 중요한 주문 블록을 식별하고 다양
    Atomic Analyst MT5
    Issam Kassas
    3.94 (31)
    우선적으로 언급할 점은이 거래 지표가 다시 그리지 않고 지연되지 않으며 이를 통해 수동 및 로봇 거래 모두에 이상적이라는 점입니다. 사용자 매뉴얼: 설정, 입력 및 전략. Atomic Analyst는 가격의 강도와 모멘텀을 활용하여 시장에서 더 나은 이점을 찾는 PA Price Action Indicator입니다. 고급 필터를 장착하여 잡음과 거짓 신호를 제거하고 거래 잠재력을 높이는 데 도움이 됩니다. 복잡한 지표의 다중 레이어를 사용하여 Atomic Analyst는 차트를 스캔하고 복잡한 수학적 계산을 간단한 신호와 색상으로 변환하여 초보 트레이더가 이해하고 일관된 거래 결정을 내릴 수 있도록합니다. "Atomic Analyst"는 새로운 및 경험이 풍부한 트레이더를위한 종합적인 거래 솔루션입니다. 프리미엄 지표와 최고 수준의 기능을 하나의 거래 전략에 결합하여 모든 종류의 트레이더에 대한 다재다능한 선택지가되었습니다. 인트라데이 거래 및 스캘핑 전략 : 빠르고 정확한 일일
    Btmm state engine pro
    Garry James Goodchild
    5 (4)
    BTMM State Engine Pro is a MetaTrader 5 indicator for traders who use the Beat The Market Maker approach: Asian session context, kill zone timing, level progression, peak formation detection, and a multi-pair scanner from a single chart. It combines cycle state logic with a built-in scanner dashboard so you do not need the same tool on many charts at once. What it does Draws the Asian session range; session times can follow broker server offset or be set in inputs. Tracks level progression (L
    Crystal Heikin Ashi Signals
    Muhammad Jawad Shabir
    5 (2)
    Crystal Heikin Ashi Signals - Professional Trend & Signal Detection Indicator Advanced Heikin Ashi Visualization with Intelligent Signal System for Manual & Automated Trading Final Price: $149 ---------> Price goes up $10 after every 10 sales . Limited slots available — act fast . Overview Crystal Heikin Ashi Signals is a professional-grade MetaTrader 5 indicator that combines pure Heikin Ashi candle visualization with an advanced momentum-shift detection system. Designed for both manual traders
    Market Structure Order Block Dashboard MT5는 시장 구조와 주요 가격 반응 구역을 차트에서 직접 읽고자 하는 트레이더를 위해 설계된 MT5 지표입니다. BOS, ChoCH, 오더 블록, Fair Value Gap (FVG), 유동성, Kill Zones, Volume Profile 그리고 빠른 분석을 위한 콤팩트한 대시보드를 결합합니다. 이 지표는 시장 구조, ICT 및 Smart Money 개념을 의사결정 프레임워크로 사용하는 트레이더를 대상으로 합니다. 추세 지속, 가능한 반전, 가격 불균형, 유동성 타겟 및 관심 구역을 보다 체계적으로 식별하는 데 도움을 줄 수 있습니다. 구매자를 위한 포함 리소스 구매 후 MQL5 개인 메시지로 요청하시면 완전한 PDF 사용 설명서와 파라미터 설정 팁을 제공해 드립니다. MQL5 개인 메시지를 통한 직접 기술 지원. 1.20 버전은 두 가지 주요 추가 기능을 제공합니다: Pending BOS / Pending
    Grabber System MT5
    Ihor Otkydach
    4.83 (23)
    탁월한 기술적 지표인 Grabber를 소개합니다. 이 도구는 즉시 사용 가능한 “올인원(All-Inclusive)” 트레이딩 전략으로 작동합니다. 하나의 코드 안에 강력한 시장 기술 분석 도구, 매매 신호(화살표), 알림 기능, 푸시 알림이 통합되어 있습니다. 이 인디케이터를 구매하신 모든 분들께는 다음의 항목이 무료로 제공됩니다: Grabber 유틸리티: 오픈 포지션을 자동으로 관리하는 도구 단계별 영상 매뉴얼: 설치, 설정, 그리고 실제 거래 방법을 안내 맞춤형 세트 파일: 인디케이터를 빠르게 자동 설정하여 최고의 성과를 낼 수 있도록 도와줍니다 다른 전략은 이제 잊어버리세요! Grabber만이 여러분을 새로운 트레이딩의 정점으로 이끌어 줄 수 있습니다. Grabber 전략의 주요 특징: 거래 시간 프레임: M5부터 H4까지 거래 가능한 자산: 어떤 자산이든 사용 가능하지만, 제가 직접 테스트한 종목들을 추천드립니다 (GBPUSD, GBPCAD, GBPCHF, AUDCAD, AU
    Basic Harmonic Patterns Dashboard MT5
    Mehran Sepah Mansoor
    4.36 (11)
    이 대시보드는 선택한 심볼에 대해 사용 가능한 최신 고조파 패턴을 표시하므로 시간을 절약하고 더 효율적으로 사용할 수 있습니다 /   MT4 버전 . 무료 인디케이터:   Basic Harmonic Pattern 인디케이터 열 Symbol :   선택한 심볼이 나타납니다 Trend :   강세 또는 약세 Pattern :   패턴 유형(가틀리, 나비, 박쥐, 게, 상어, 사이퍼 또는 ABCD) Entry :   진입 가격 SL:   스톱로스 가격 TP1:   1차 테이크프로핏 가격 TP2:   2차 테이크프로핏 가격 TP3:   3차 테이크프로핏 가격 Current price:   현재 가격 Age (in bars):   마지막으로 그려진 패턴의 나이 주요 입력 Symbols :   "28개 주요 통화쌍" 또는 "선택한 심볼" 중에서 선택합니다. Selected Symbols :   쉼표로 구분하여 모니터링하려는 원하는 심볼("EURUSD,GBPUSD,XAUUSD")을 선택
    SMC Intraday Formula
    Kareem Abbas
    5 (6)
    먼저 솔직하게 말하겠습니다. 어떤 인디케이터도 단독으로 당신을 수익성 있게 만들어주지 않습니다. 누군가 그렇게 말한다면, 그는 당신에게 꿈을 파는 것입니다. 완벽한 매수/매도 화살표를 보여주는 모든 인디케이터는 완벽하게 보이도록 만들 수 있습니다 — 단지 올바른 과거 구간을 확대하고 승리한 거래만 캡처하면 됩니다. 우리는 그렇게 하지 않습니다.  SMC Intraday Formula는 도구입니다. 시장 구조를 읽고, 가장 높은 확률의 가격 구간을 표시하며, 현재 스마트 머니의 흐름이 어떻게 보이는지 아주 단순한 언어로 보여줍니다. 최종 결정은 여전히 당신이 합니다. 실행도 당신이 합니다. 하지만 이제는 희망이 아니라 정확성으로 거래하게 됩니다. 우리는 이 인디케이터를 지난 약 3년 동안 골드(XAUUSD) 및 주요 외환 통화쌍의 데이 트레이딩 스캘핑에 사용해 왔습니다. M1, M5, M15, M30에서 우리의 핵심 도구입니다. 이 도구는 미래를 예측하려 하지 않습니다 — 지금 형성
    OmniSync Projection
    Antonio-alin Teculescu
    5 (1)
    Chronos Fractal Engine is an innovative price projection indicator for MetaTrader 5, designed to transform your technical analysis by intelligently identifying and projecting historical price patterns. Built upon an advanced correlation algorithm and the fractal principles of the market, this powerful tool visualizes potential future price movements, giving you a unique edge in your trading decisions. What is Chronos Fractal Engine? At its core, the Chronos Fractal Engine employs a sophisticat
    Meridian Pro
    Ottaviano De Cicco
    5 (1)
    Meridian Pro 2.00: Professional Multi-Timeframe Trend Matrix for MT5 Meridian Pro 2.00 is a professional adaptive trend matrix for MetaTrader 5. It combines the original Meridian trend engine, a clean chart ribbon, closed-bar signal arrows, an 8-timeframe dashboard, Fuel momentum, weighted consensus, synthetic HTF processing and chart-native higher-timeframe context lines. The goal is simple: read current trend, multi-timeframe structure, strength, momentum and EA-ready state from one discipline
    " Dynamic Scalper System MT5 " 지표는 추세 파동 내에서 스캘핑 방식으로 거래하도록 설계되었습니다. 주요 통화쌍 및 금에서 테스트되었으며, 다른 거래 상품과의 호환성이 가능합니다. 추가적인 가격 변동 지원을 통해 추세에 따라 단기 포지션 진입 신호를 제공합니다. 지표의 원리 큰 화살표는 추세 방향을 결정합니다. 작은 화살표 형태의 스캘핑 신호를 생성하는 알고리즘은 추세 파동 내에서 작동합니다. 빨간색 화살표는 상승 방향을, 파란색 화살표는 하락 방향을 나타냅니다. 민감한 가격 변동선은 추세 방향으로 그려지며, 작은 화살표의 신호와 함께 작용합니다. 신호는 다음과 같이 작동합니다. 적절한 시점에 선이 나타나면 진입 신호가 형성되고, 선이 있는 동안 미결제 포지션을 유지하며, 완료되면 거래를 종료합니다. 권장되는 작업 시간대는 M1~H4입니다. 화살표는 현재 캔들에 형성되며, 다음 캔들이 이미 시작되었더라도 이전 캔들의 화살표는 다시 그려지지 않습니다. 입
    Trend indicator AI mt5
    Ramil Minniakhmetov
    5 (17)
    트렌드 인공 지능 지표는 실행 가능한 진입 점 및 반전 경고와 추세 식별을 결합하여 상인의 시장 분석을 향상시킬 훌륭한 도구입니다. 이 표시기는 사용자가 자신감과 정밀도로 외환 시장의 복잡성을 탐색 할 수 있도록 지원합니다 기본 신호 외에도 트렌드 인공 지능 지표는 풀백 또는 되돌림 중에 발생하는 2 차 진입 점을 식별하여 거래자가 기존 트렌드 내에서 가격 수정을 활용할 수 있도록합니다. 중요한 장점: ·작동 4 및 5 *명확한 구매 또는 판매 신호 *다시 칠하지 않습니다 *모든 자산에서 작동 나는 전보 사기에 개 또는 세트를 판매하지 않도록주의. 모든 설정은 블로그에 여기에 무료.  중요! 지침 및 보너스를 얻기 위해 구입 후 즉시 저에게 연락! 진짜 가동 감시는 뿐 아니라 나의 다른 제품 여기에서 찾아낼 수 있습니다: https://www.mql5.com/en/users/mechanic/seller&nbsp ; 설정 및 입력: 모든 자산에 대해 기본 설정을 권
    Super Signal Market Slayer 비재페인트 | 고정확도 | 멀티 마켓 지능형 추세 지표 트레이딩에서 진짜 어려운 것은 주문이 아니라, 시장 변동 속에서 추세가 시작되는 순간을 정확히 파악하는 것입니다. Market Slayer 는 이를 위해 만들어졌습니다. 이 지표는 데이 트레이딩을 위해 설계된 비재페인트 지능형 지표입니다. 다중 확인 및 추세 필터링을 통해 중요한 시점에서만 명확하고 신뢰할 수 있는 Buy / Sell 신호를 제공합니다. 핵심 장점 비재페인트 신호 한 번 생성된 신호는 이동하거나 사라지지 않습니다. 고정확도 추세 판단 다양한 종목에서 테스트되었으며, 특히 골드 M5 / M15에서 안정적인 성과를 보입니다. 멀티 마켓 지원 골드, 외환, 지수, 주요 암호화폐 지원. 데이 트레이딩 최적화 M5, M15에 집중하여 노이즈를 줄이고 실행력을 향상. 직관적 구조 초보자도 쉽게 이해하고 사용할 수 있습니다. 기술 로직 요약 Market Slayer 는 단일
    FX Levels MT5
    Daniel Stein
    5 (13)
    FX Levels: 모든 시장을 위한 뛰어난 정확도의 지지와 저항 간단 요약 통화쌍, 지수, 주식, 원자재 등 어떤 시장이든 믿을 만한 지지·저항 레벨을 찾고 싶나요? FX Levels 는 전통적인 “Lighthouse” 기법과 첨단 동적 접근을 결합해, 거의 보편적인 정확성을 제공합니다. 실제 브로커 경험을 반영하고, 자동화된 일별 업데이트와 실시간 업데이트를 결합함으로써 FX Levels 는 가격 반전 포인트를 파악하고, 수익 목표를 설정하며, 자신 있게 트레이드를 관리할 수 있게 돕습니다. 지금 바로 시도해 보세요—정교한 지지/저항 분석이 어떻게 여러분의 트레이딩을 한 단계 끌어올릴 수 있는지 직접 확인하세요! 1. FX Levels가 트레이더에게 매우 유용한 이유 뛰어난 정확도의 지지·저항 존 • FX Levels 는 다양한 브로커 환경에서도 거의 동일한 존을 생성하도록 설계되어, 데이터 피드나 시간 설정 차이로 인한 불일치를 해소합니다. • 즉, 어떤 브로커를 사용하
    Gartley Hunter Multi
    Siarhei Vashchylka
    5 (11)
    Gartley Hunter Multi - An indicator for searching for harmonic patterns simultaneously on dozens of trading instruments and on all possible timeframes. Manual (Be sure to read before purchasing) | Version for MT4 Advantages 1. Patterns: Gartley, Butterfly, Shark, Crab. Bat, Alternate Bat, Deep Crab, Cypher 2. Simultaneous search for patterns on dozens of trading instruments and on all possible timeframes 3. Search for patterns of all possible sizes. From the smallest to the largest 4. All fou
    FX Power MT5 NG
    Daniel Stein
    5 (31)
    FX Power: 통화 강세 분석으로 더 스마트한 거래 결정을 개요 FX Power 는 어떤 시장 상황에서도 주요 통화와 금의 실제 강세를 이해하기 위한 필수 도구입니다. 강한 통화를 매수하고 약한 통화를 매도함으로써 FX Power 는 거래 결정을 단순화하고 높은 확률의 기회를 발견합니다. 트렌드를 따르거나 극단적인 델타 값을 사용해 반전을 예측하고자 한다면, 이 도구는 귀하의 거래 스타일에 완벽히 적응합니다. 단순히 거래하지 말고, FX Power 로 더 스마트하게 거래하세요. 1. FX Power가 거래자에게 매우 유용한 이유 통화와 금의 실시간 강세 분석 • FX Power 는 주요 통화와 금의 상대적 강세를 계산하고 표시하여 시장 역학에 대한 명확한 통찰력을 제공합니다. • 어떤 자산이 앞서고 있고 어떤 자산이 뒤처지는지 모니터링하여 보다 현명한 거래 결정을 내릴 수 있습니다. 포괄적인 멀티 타임프레임 뷰 • 단기, 중기 및 장기 타임프레임에서 통화와 금의 강세를
    소개       Quantum Breakout PRO   , 브레이크아웃 존 거래 방식을 변화시키는 획기적인 MQL5 지표! 13년 이상의 거래 경험을 가진 숙련된 트레이더 팀이 개발한       퀀텀 브레이크아웃 PRO       혁신적이고 역동적인 브레이크아웃 존 전략으로 거래 여정을 새로운 차원으로 끌어올리도록 설계되었습니다. Quantum Breakout Indicator는 5개의 이익 목표 영역이 있는 브레이크아웃 영역의 신호 화살표와 브레이크아웃 상자를 기반으로 한 손절 제안을 제공합니다. 초보자 거래자와 전문 거래자 모두에게 적합합니다. Quantum EA 채널:       여기를 클릭하세요 중요한! 구매 후 설치 매뉴얼을 받으려면 개인 메시지를 보내주십시오. 추천: 기간: M15 통화쌍: GBPJPY, EURJPY, USDJPY,NZDUSD, XAUUSD 계정 유형: 스프레드가 매우 낮은 ECN, Raw 또는 Razor 브로커 시간: GMT +3 중개인 :
    Market Structure Patterns
    Samuel Manoel De Souza
    4.47 (19)
    Market Structure Patterns   is an indicator based on   smart money concepts   that displays   SMC/ICT   elements that can take your trading decisions to the next level. Take advantage of the   alerts ,   push notifications   and   email messages   to keep informed from when an element is formed on the chart, the price crosses a level and/or enters in a box/zone. Developers can access the values of the elements of the indicator using the   global variables  what allows the automation of trading
    제작자의 제품 더 보기
    ZigZag Advanced MT5
    Do Kim Dang Khoi
    5 (1)
    If you love this indicator, please leave a positive rating and comment, it will be a source of motivation to help me create more products <3 Key Takeaways The Zig Zag  Advanced   indicator plot points on a chart whenever prices reverse by the percentage the trader sets in the input section. The Zig Zag Advanced indicator lowers the impact of random price fluctuations and is used to identify trends and changes in trends. The indicator lowers noise levels, highlighting trends higher and lower. Th
    FREE
    VWAP Original MT5
    Do Kim Dang Khoi
    4.67 (3)
    If you love this indicator, please leave a positive rating and comment, it will be a source of motivation to help me create more products <3 Key Takeaways VWAP is a trading benchmark that typically is most useful to short-term traders. VWAP is used in different ways by traders  . Traders may use it as   a trend confirmation tool   and build trading rules around it. Also, If prices below VWAP and move above it, c an be used by traders as a sell signal. If prices above VWAP and move below it,  ca
    FREE
    Range Breakout Alert MT5
    Do Kim Dang Khoi
    5 (2)
    If you love this indicator, please leave a positive rating and comment, it will be a source of motivation to help me create more products <3 Key Takeaways Automatically draws Range High and Range Low boundaries for a chosen time period. Alerts when price breaks above or below the defined range. Support sending notifications via alert, email, notification when breakout occurs. Can be used as a trade signal in breakout-based strategies. However, like all indicators, it isn't foolproof,  to avoid
    FREE
    Gann High Low Activator MT5
    Do Kim Dang Khoi
    5 (1)
    If you love this indicator, please leave a positive rating and comment, it will be a source of motivation to help me create more products <3 How to use Gann High-Low Activator? The Gann HiLo Activator helps the trader identify the current trend of the market. When the indicator is below the closing price, it can indicate that an uptrend is taking place. Conversely, when the indicator is above the closing price, it can indicate a downtrend. The Gann HiLo Activator also generates buy and sell sig
    FREE
    QQE Indicator MT5
    Do Kim Dang Khoi
    5 (1)
    If you love this indicator, please leave a positive rating and comment, it will be a source of motivation to help me create more products <3 How to use QQE? Determine trend when RSI MA ​​above 50 indicate a bullish market, while RSI MA ​​below 50 indicate a bearish market and   can server as a trend filter. Identify short-term up/down momentum, when the RSI MA crosses up Smoothed signals bullish momentum, and when the RSI MA crosses down Smoothed signals bearish momentum. It is also possible to
    FREE
    Laguerre RSI MT5
    Do Kim Dang Khoi
    5 (2)
    If you love this indicator, please leave a positive rating and comment, it will be a source of motivation to help me create more products <3 Key Takeaways The Laguerre RSI is an enhanced version of the traditional Relative Strength Index (RSI) that incorporates Laguerre filters to smooth the price data. This helps reduce the noise and volatility that are often seen in the standard RSI, providing a cleaner and more reliable indicator for spotting trends, reversals, and overbought or oversold con
    FREE
    If you love this indicator, please leave a positive rating and comment, it will be a source of motivation to help me create more products <3 What is  Schaff Trend Cycle indicator? The Schaff Trend Cycle (STC) is a technical analysis indicator used in trading and investing to identify trends and generate trading signals. The STC is designed to identify trends and trend reversals by measuring the strength of the trend and the speed of price changes. The STC indicator helps to identify trends in a
    FREE
    If you love this indicator, please leave a positive rating and comment, it will be a source of motivation to help me create more products <3 Key Takeaways Provides both trend and momentum signals in a single view. Entry and exit signals are based on the crossover of the RSI and Signal Line. Market Base Line offers insight into the overall trend direction. Volatility Bands help identify overbought and oversold market conditions.
    FREE
    Slope Direction Line MT5
    Do Kim Dang Khoi
    5 (2)
    If you love this indicator, please leave a positive rating and comment, it will be a source of motivation to help me create more products <3 How to use  Slope Direction Line Uptrend: When the SDL line slopes up and turns from red to green, it shows that the price is trending up. This is also considered a buy signal. Downtrend: When the SDL line slopes down and turns from green to red, it shows that the price is trending down. This is also considered a sell signal. Sideways: When the SDL line mo
    FREE
    StochRSI MT5
    Do Kim Dang Khoi
    If you love this indicator, please leave a positive rating and comment, it will be a source of motivation to help me create more products <3 Key Takeaways StochRSI is an oscillator that measures the RSI level relative to its high-low range over a period of time. It is more sensitive than the traditional RSI and can highlight overbought or oversold conditions in the market. StochRSI is typically used to generate more frequent and timely trading signals compared with the traditional RSI. StochRSI
    FREE
    Aroon Indicator MT5
    Do Kim Dang Khoi
    4 (1)
    If you love this indicator, please leave a positive rating and comment, it will be a source of motivation to help me create more products <3 How to use Aroon Indicator? The AroonUp and the AroonDown measure the strength of the uptrend and the strength of the downtrend, respectively. These lines fluctuate between zero and 100. Values close to 100 indicate a strong trend and values near zero indicate a weak trend where the lower the AroonUp, the weaker the uptrend and the stronger the downtrend,
    FREE
    If you love this indicator, please leave a positive rating and comment, it will be a source of motivation to help me create more products <3 Key Takeaways Fisher is a repaint indicator. It recalculates previous bars when new bars become available. Modified to avoid repainting to accommodate some merchants. Fisher indicator is quite a simple histogram indicator that detects the trend's direction and strength and signals about trend changes. Traders look for extreme readings to signal potential p
    FREE
    Key Takeaways This timer does not lag like other timer indicators Show the time end of candlesticks and spread Hide or Show Spread depending on user needs Works on all timeframes Adjust Text Size Adjust Text Color Adjust Text Font  If you love this indicator, please leave a positive rating and comment, it will be a source of motivation to help me create more products <3
    FREE
    Dots Indicator MT5
    Do Kim Dang Khoi
    If you love this indicator, please leave a positive rating and comment, it will be a source of motivation to help me create more products <3 Key Takeaways Generates buy and sell signals earlier than regular MA This indicator can detect a trend when it is just starting Filter :  A special parameter that is useful for filtering out spikes without causing lag. However, like all indicators, it isn't foolproof,  to avoid false signals, it's best to use the   Dots  indicator with other indicators. Te
    FREE
    Fuzzy Oscillator is developed for personal use in future EA projects, so Fuzzy Oscillator is not too special, but it will help make trading easier when you can use Fuzzy Oscillator to identify trends and entry and exit points. Why Choose Fuzzy Oscillator: Fuzzy Oscillator is not repaints. There are many ways to use it like trading pullback, reversals and many more. Can help traders identify potential trend reversals, momentum shifts. Catch the long wave when a new trend starts. Suitable for all
    FREE
    If you love this indicator, please leave a positive rating and comment, it will be a source of motivation to help me create more products <3 Key Takeaways Bulls Bears Eyes is another version of Laguerre RSI. Use Bull/Bear Power to calculate. One use of the  Bulls Bears Eyes is to identify trends. This is done by looking for sustained periods when the indicator is above or below the 0.5 line. Also, a buy signal is generated when the   Bulls Bears Eyes line crosses above the 0.15 level, while a s
    FREE
    필터:
    Gangadhar poonia
    38
    Gangadhar poonia 2025.09.12 10:10 
     

    its nice can we add this to EA

    rb569
    44
    rb569 2025.07.06 10:15 
     

    사용자가 평가에 대한 코멘트를 남기지 않았습니다

    79095082637
    24
    79095082637 2025.03.29 16:49 
     

    👍

    리뷰 답변