Spike Box Mitigation

📌 boom Spike Mitigation Zone Pro 📌

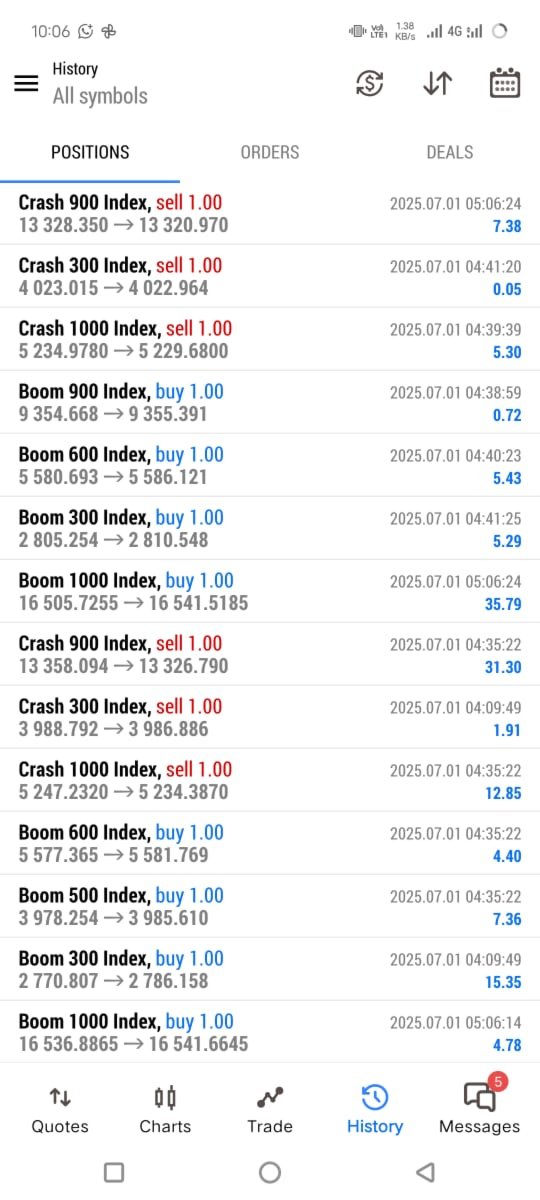
A professional spike pattern indicator built for synthetic traders who scalp and swing Boom 500/300/1000/600/900with precision. 

This indicator:
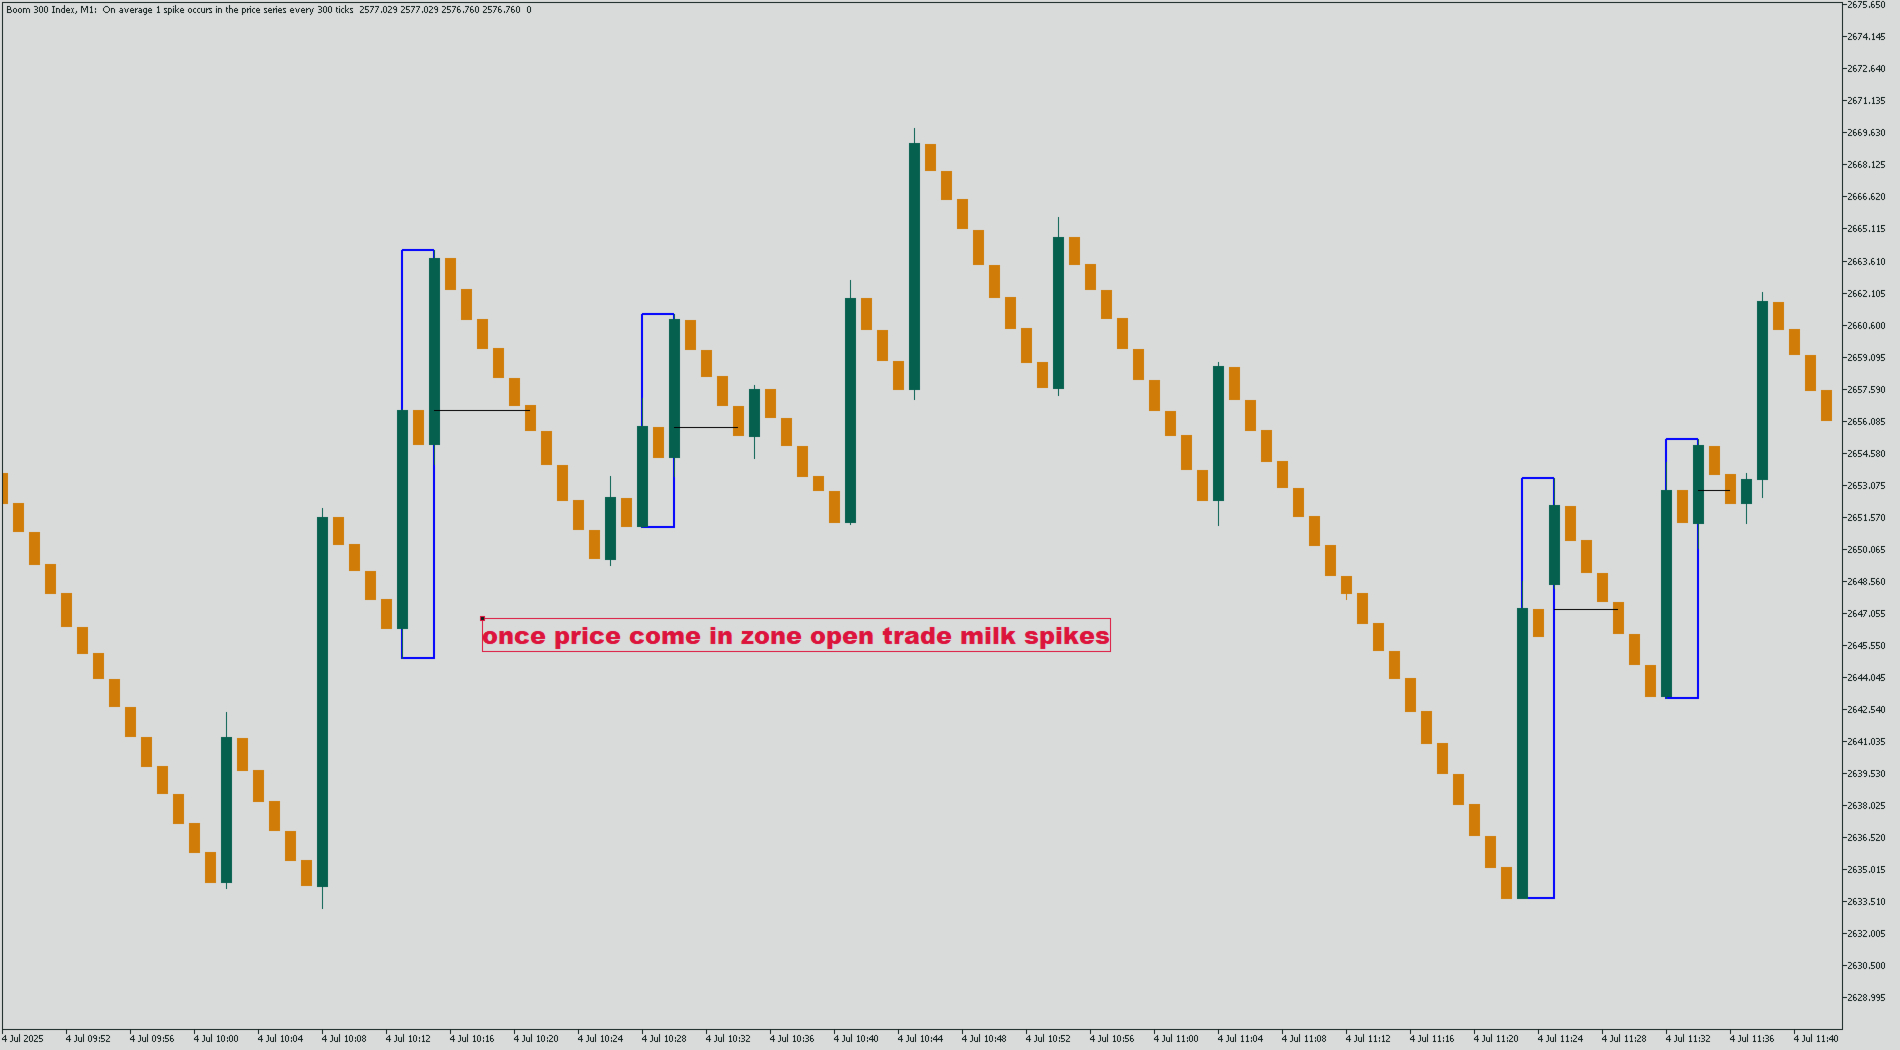
✅ Detects powerful 3-candle spike formations (Spike → Pullback → Spike)
✅ Automatically draws a clean box around the pattern
✅ Marks the entry price from the middle candle
✅ Extends a horizontal mitigation line to guide perfect sniper entries
✅ Automatically deletes & redraws the line once price touches it (mitigation)
✅ Keeps your charts clean – no repainting, no lag

Use cases:
🔹 Identify Smart Money return-to-zone entries
🔹 Trade spike continuation setups
🔹 Combine with price action or EMA filters
🔹 Perfect for scalpers & zone-based traders

📈 Recommended Chart:
- Symbol: bom 500 Index
- Timeframe: M1 or M5

🎯 Entry Strategy:
- Wait for the mitigation line (middle candle open) to be reached again
- Enter at mitigation for sniper sell
- Use your own SL/TP or wait for opposite signal

🎨 Customizable:
- Box color, line color, width, and style are adjustable

🔥 No repainting
🔥 Works in Strategy Tester
🔥 Zero lag

🛠️ License:
- 1 activation (MQL5 Market Standard)
- No DLL, no external libraries required

Buy once, use forever – become a smarter boom trader today!

추천 제품
Little useful tool - you manually select range on chart by dragging vertical blue lines and indicator shows support and resistance zones for this range and extends them outside of selected range.  Useful for: * Range trading * Range breakout * Range breakout & retest * Good entry during pullback in trend phase when previous high is retested * Good for scalping on short timeframes * Good for trades on longer timeframes around selected important zones like daily high or low
FREE
Value Chart Candlesticks
Flavio Javier Jarabeck
4.69 (13)
The idea of a Value Chart indicator was presented in the very good book I read back in 2020 , " Dynamic Trading Indicators: Winning with Value Charts and Price Action Profile ", from the authors Mark Helweg and David Stendahl. The idea is simple and the result is pure genius: Present candlestick Price analysis in a detrended way! HOW TO READ THIS INDICATOR Look for Overbought and Oversold levels. Of course, you will need to test the settings a lot to find the "correct" one for your approach. It
FREE
Zigzag Price Arrows
Aiman Saeed Salem Dahbag
The Zigzag Price Arrow indicator is an enhanced version of the classic Zigzag indicator, combining the traditional zigzag pattern with advanced visual features. It not only identifies major market turning points but also provides clear trading signals through: • Directional arrows: Displays colored arrows (green for buy, magenta for sell) indicating potential trend directions. • Price labels: Shows the exact price values at each pivot point directly on the chart. • Improved visual clarity: Make
FREE
MACD Enhanced
Nikita Berdnikov
5 (3)
Introducing the MACD  Enhanced – an advanced MACD (Moving Average Convergence Divergence) indicator that provides traders with extended capabilities for trend and momentum analysis in financial markets. The indicator uses the difference between the fast and slow exponential moving averages to determine momentum, direction, and strength of the trend, creating clear visual signals for potential entry and exit points. Attention! To achieve the best results, it is recommended to adapt the indicator
FREE
FlatBreakout MT5
Aleksei Vorontsov
FlatBreakout MT5 (Free Version) Flat Range Detector and Breakout Panel for MT5 — GBPUSD Only FlatBreakout MT5   is the free version of the professional FlatBreakoutPro MT5 indicator, specially designed for flat (range) detection and breakout signals on the   GBPUSD   pair only. Perfect for traders who want to experience the unique fractal logic of FlatBreakout MT5 and test breakout signals on a live market without limitations. Who Is This Product For? For traders who prefer to trade breakout of
FREE
Free automatic Fibonacci is an indicator that automatically plots a Fibonacci retracement based on the number of bars you select on the BarsToScan setting in the indicator. The Fibonacci is automatically updated in real time as new highest and lowest values appears amongst the selected bars. You can select which level values to be displayed in the indicator settings. You can also select the color of the levels thus enabling the trader to be able to attach the indicator several times with differe
FREE
Donchian Breakout And Rsi
Mattia Impicciatore
5 (1)
개요 이 지표는 클래식 돈치안 채널(Donchian Channel) 의 향상된 버전으로, 실전 트레이딩을 위한 다양한 기능이 추가되었습니다. 표준 세 개의 선(상단, 하단, 중앙선) 외에도 브레이크아웃 을 감지하여 차트에 화살표로 시각적으로 표시하며, 차트를 깔끔하게 보기 위해 현재 추세 방향의 반대 라인만 표시 합니다. 지표 기능: 시각적 신호 : 브레이크아웃 시 컬러 화살표 표시 자동 알림 : 팝업, 푸시 알림, 이메일 RSI 필터 : 시장의 상대 강도를 기반으로 신호 검증 사용자 맞춤 설정 : 색상, 선 두께, 화살표 코드, RSI 임계값 등 동작 원리 돈치안 채널은 다음을 계산합니다: 상단선 : 최근 N개의 종가 완료 캔들에서 가장 높은 고가 하단선 : 최근 N개의 종가 완료 캔들에서 가장 낮은 저가 중앙선 : 고가와 저가의 평균값 상방 브레이크아웃 은 종가가 상단선을 돌파할 때 발생하며, 하방 브레이크아웃 은 종가가 하단선 아래로 내려갈 때 발생합니다. 이 지표는: 세 개의
FREE
RSI abcd
Francisco Gomes Da Silva
4 (2)
RSI ABCD 패턴 파인더: 기술적 전략 1. 지표 작동 방식 클래식 RSI 와 ABCD 하모닉 패턴 자동 감지를 결합합니다. 주요 구성 요소 표준 RSI (조정 가능한 기간) 고점 및 저점 마커 (화살표) ABCD 패턴 (초록/빨강 선) 과매수 (70) 및 과매도 (30) 필터 2. MT5 설정 period = 14 ; // RSI 기간 size = 4 ; // 최대 패턴 크기 OverBought = 70 ; // 과매수 수준 OverSold = 30 ; // 과매도 수준 Filter = USE_FILTER_ YES ; // 확인 필터 3. 트레이딩 전략 3.1. 매수 진입 (강세 ABCD) 조건: RSI가 다음을 형성: 저점 ( A ) → 고점 ( B ) → 더 높은 저점 ( C ) D 는 과매도 (30) 위지만 C 아래 확인: A-B-C-D 연결 초록 선 목표: TP1: B-C의 61.8% TP2: B-C의 100% 손절: D 아래 3.2. 매도 진입 (약세 ABCD) 조건:
FREE
FX Clock
Abderrahmane Benali
FXClock – Professional Clock Indicator for Traders Please leave a 5 star rating if you like this free tool! Thank you so much :) The FXClock indicator is a practical and simple tool that displays time directly on your trading platform, allowing you to track multiple key pieces of information at the same time. It is specially designed to help traders synchronize their trading with market hours and global sessions. Key Features: Displays the broker server time with precision. Displays your local c
FREE
Daily Support and Resistance Levels 는 클래식 피벗 포인트 방식으로 일중 거래 핵심 가격 레벨을 자동 계산/표시하는 전문 지표입니다. 주요 기능: 피벗 포인트(PP) 자동 계산 3개의 저항 레벨(R1, R2, R3) 3개의 지지 레벨(S1, S2, S3) 전일 고가/저가 표시 실시간 정보 패널 상승/하락 바이어스 표시 최근 레벨까지 거리 표시 색상/표시 완전 사용자 설정 매일 자동 업데이트 모든 타임프레임 지원 계산 방식: 전일 고가/저가/종가 기반 클래식 피벗 포인트. 트레이딩 활용: 지지/저항 반등 매매 돌파 전략 레인지 거래 방향성 판단 목표가 설정 사용 방법: 차트에 인디케이터 적용 레벨 자동 생성 가격 > PP = 상승 바이어스 가격 < PP = 하락 바이어스 S1-S3 = 지지 구간 R1-R3 = 저항 구간 설정 옵션: 피벗/지지/저항 색상 라인 굵기/스타일 가격 라벨 표시/숨기기 정보 패널 ON/OFF 패널 위치/폰트 크기 전일 고가/저가 표
FREE
Pivot Points Indicator – a fast, reliable, and fully customizable pivot detection for MetaTrader 5. This indicator uses MetaTrader’s native iHighest and iLowest functions to identify pivot highs and lows by scanning for the highest and lowest prices within a user-defined window of bars. A pivot is confirmed only when the current bar is the absolute maximum or minimum within the selected range, ensuring accurate and timely signals based on robust built-in logic. Key Features No Repainting : Onc
FREE
WH Price Wave Pattern MT5
Wissam Hussein
4.25 (12)
FREE
PZ Three Drives MT5
PZ TRADING SLU
2.83 (6)
This indicator finds Three Drives patterns. The Three Drives pattern is a 6-point reversal pattern characterised by a series of higher highs or lower lows that complete at a 127% or 161.8% Fibonacci extension. It signals that the market is exhausted and a reversal can happen. [ Installation Guide | Update Guide | Troubleshooting | FAQ | All Products ] Customizable pattern sizes Customizable colors and sizes Customizable breakout periods Customizable 1-2-3 and 0-A-B ratios It implements visual/s
FREE
VolumeBasedColorsBars
Henrique Magalhaes Lopes
VolumeBasedColorsBars — Free Powerful Volume Analysis for All Traders Unlock the hidden story behind every price bar! VolumeBasedColorsBars is a professional-grade, 100% FREE indicator that colorizes your chart candles based on real, adaptive volume analysis. Instantly spot surges in market activity, identify exhaustion, and catch the moves that matter. This indicator gives you:    • Dynamic color-coded bars for instant volume context    • Adaptive thresholds based on historical, session-awar
FREE
Indicator and Expert Adviser  EA Available in the comments section of this product. Download with Indicator must have indicator installed for EA to work. Mt5 indicator alerts for bollinger band and envelope extremes occurring at the same time. Buy signal alerts occur when A bullish candle has formed below both the lower bollinger band and the lower envelope  Bar must open and close below both these indicators. Sell signal occur when A bear bar is formed above the upper bollinger band and upper
FREE
Cybertrade Keltner Channels
Emanuel Andriato
4.8 (5)
Cybertrade Keltner Channels - MT5 Created by Chester Keltner, this is a volatility indicator used by technical analysis. It is possible to follow the trend of financial asset prices and generate support and resistance patterns. In addition, envelopes are a way of tracking volatility in order to identify opportunities to buy and sell these assets. It works on periods longer than the period visible on the chart. All values ​​are available in the form of buffers to simplify possible automations.
FREE
Haven FVG Indicator
Maksim Tarutin
5 (7)
인디케이터   Haven FVG   는 시장을 분석하는 도구로, 차트에서 비효율성 영역(Fair Value Gaps, FVG)을 식별하여 트레이더에게 가격 분석 및 거래 결정을 위한 주요 수준을 제공합니다. 다른 제품 ->  여기 주요 특징: 개별 색상 설정: 상승 FVG 색상   (Bullish FVG Color). 하락 FVG 색상   (Bearish FVG Color). 유연한 FVG 시각화: FVG를 검색할 최대 캔들 수. FVG 영역을 특정 바 수만큼 추가로 연장. FVG에 대한 채우기를 활성화할 수 있습니다. 중앙선(Middle Line): 색상 및 선 스타일 선택(예: 점선). 더 정확한 선 두께 조정. 일반 설정: FVG를 현재 바까지 확장. 채우기가 있는 역사적 FVG 제외하여 최신 데이터에 집중. 차트에서 비효율성 영역을 분석하고 근거 있는 거래 결정을 내리는 간단하고 효과적인 방법.
FREE
Girassol Sunflower MT5 Indicator
Saullo De Oliveira Pacheco
4.33 (6)
This is the famous Sunflower indicator for Metatrader5. This indicator marks possible tops and bottoms on price charts. The indicator identifies tops and bottoms in the asset's price history, keep in mind that the current sunflower of the last candle repaints, as it is not possible to identify a top until the market reverses and it is also not possible to identify a bottom without the market stop falling and start rising. If you are looking for a professional programmer for Metatrader5, please
FREE
PZ Fibonacci MT5
PZ TRADING SLU
4.57 (14)
Are you tired of plotting Fibonacci retracements or extensions manually? This indicator displays Fibo retracements or extensions automatically, calculated from two different price points, without human intervention or manual object anchoring. [ Installation Guide | Update Guide | Troubleshooting | FAQ | All Products ] Easy to use Manual anchoring is not needed Perfect for price confluence studies The indicator evaluates if retracements or extensions are needed Once drawn, you can manually edit t
FREE
Heiken Ashi fxam
Ely Alsedy
5 (1)
헤이킨 아시 MT5 인디케이터 헤이킨 아시 MT5 인디케이터는 표준 가격 데이터를 더 부드럽고 추세 중심의 캔들스틱으로 변환하여 시장 트렌드와 잠재적인 역전 지점을 더 쉽게 식별할 수 있도록 하는 강력한 도구입니다. 주요 특징: 명확한 트렌드 식별: 다른 캔들 색상으로 상승 추세와 하락 추세를 시각적으로 구분합니다. 노이즈 감소: 가격 변동을 필터링하여 시장의 주요 움직임을 더 명확하게 표시합니다. 조기 트렌드 감지: 표준 차트에서 트렌드 변화가 명확해지기 전에 잠재적인 트렌드 변화를 예측합니다. 다용도성: 독립적으로 사용하거나 다른 기술적 지표와 함께 종합적인 분석에 사용할 수 있습니다. 사용자 정의 설정: 인디케이터를 특정 거래 선호도와 전략에 맞게 조정할 수 있습니다. 장점: 트렌드를 식별하고 잠재적인 진입 및 청산 지점을 파악하는 능력을 향상시킵니다. 시장 노이즈의 영향을 줄이고 중요한 가격 변동에 집중합니다. 시장 역학에 대한 더 명확한 이해를 바탕으로 더 나은 거래 결정
FREE
PZ Penta O MT5
PZ TRADING SLU
3.5 (4)
The Penta-O is a 6-point retracement harmonacci pattern which usually precedes big market movements. Penta-O patterns can expand and repaint quite a bit. To make things easier this indicator implements a twist: it waits for a donchian breakout in the right direction before signaling the trade. The end result is an otherwise repainting indicator with a very reliable trading signal. The donchian breakout period is entered as an input. [ Installation Guide | Update Guide | Troubleshooting | FAQ | A
FREE
Trend Duration Forecast
Israr Hussain Shah
4 (2)
Trend Duration Forecast It utilizes a Hull Moving Average (HMA) to detect trend direction and statistically forecasts the probable duration of the current move based on historical market behavior. Key Features Smooth Trend Detection:   Uses the Hull Moving Average (HMA) to filter noise while minimizing lag, providing clean Bullish/Bearish signals. Real-Time Duration Counter:   Displays a dynamic label at the start of the current trend showing the   "Real Length"   (number of bars the trend has b
FREE
Premium trend entry pro TZ Trade Logics, presents you,  the enhance version of Premium trend entry  This release, bring you much more relaxed trading state with advanced features for trend filtering and premium signal entry timings. For us, is not the creating of the product which matters! but continued maintenance and education to users. through our dedicated means of reaching to us, you will enjoy close guide on how to use the product and other relevant training related to trading.  This tradi
FREE
Pivot Point Fibo RSJ
JETINVEST
4.38 (21)
피봇 포인트 Fibo RSJ는 피보나치 비율을 사용하여 당일의 지지선과 저항선을 추적하는 지표입니다. 이 멋진 지표는 피보나치 비율을 사용하여 피벗 포인트를 통해 최대 7단계의 지지와 저항을 생성합니다. 가격이 작업의 가능한 진입/종료 지점을 인식할 수 있는 이 지원 및 저항의 각 수준을 어떻게 존중하는지 환상적입니다. 특징 최대 7단계 지원 및 7단계 저항 레벨의 색상을 개별적으로 설정 입력 피벗 유형 피벗 피보 RSJ1 = 피보 비율 1 계산 피벗 피보 RSJ2 = 피보 비율 2 계산 피벗 Fibo RSJ3 = Fibo 비율 3 계산 피벗 피보 클래식 = 클래식 피벗 계산 최소 피벗 수준 피벗 3 레벨 피벗 4 레벨 피벗 5 레벨 6단계 피벗 피벗 7 레벨 여전히 질문이 있는 경우 다이렉트 메시지로 저에게 연락하십시오: https://www.mql5.com/ko/users/robsjunqueira/
FREE
Swing Point BoS CHoCH Con Exp Alerts
Usiola Oluwadamilol Olagundoye
NOTE: Turn Pattern Scan ON This indicator identifies Swing Points, Break of Structure (BoS), Change of Character (CHoCH), Contraction and Expansion patterns which are plotted on the charts It also comes with Alerts & Mobile notifications so that you do not miss any trades. It can be used on all trading instruments and on all timeframes. The non-repaint feature makes it particularly useful in backtesting and developing profitable trading models. The depth can be adjusted to filter swing points.
FREE
Swing BOS Structure is a market structure indicator for MetaTrader 5. The indicator automatically detects: • Swing High (SH) • Swing Low (SL) • Break of Structure (BOS) • Change of Character (CHoCH) Swings are confirmed only after a defined number of candles, ensuring no repainting. BOS signals indicate trend continuation. CHoCH signals indicate a potential change in market structure and may appear less frequently depending on market conditions and timeframe. The indicator is lightweight, fa
FREE
Statistical Arbitrage Spread Generator for Cointegration [MT5] What is Pair Trading? Pair trading is a market-neutral strategy that looks to exploit the relative price movement between two correlated assets — instead of betting on the direction of the market. The idea? When two assets that usually move together diverge beyond a statistically significant threshold, one is likely mispriced. You sell the expensive one, buy the cheap one , and profit when they converge again. It’s a statistica
FREE
Bounce Zone MT5
Nguyen Thanh Cong
4.56 (9)
Introduction The Bounce Zone indicator is a cutting-edge non-repainting technical tool built to identify key areas on the price chart where market sentiment is likely to cause a significant price reversal. Using advanced algorithms and historical price data analysis, this indicator pinpoints potential bounce zones. Combined with other entry signal, this indicator can help forex traders place the best trades possible Signal A possible buy signal is generated when price is in the green zone an
FREE
Envolventes con alertas
Juan Manuel Rojas Perez
MT5 Enveloping Pattern Detector: Your competitive advantage in trading Are you looking for a tool to help you accurately identify the best trading opportunities in the forex market? Our Engulfing Pattern Detector provides you with a highly reliable buy or sell signal, based on one of the most recognized and effective Japanese candlestick patterns: the engulfing pattern. With an average success rate of 70%, this indicator will allow you to make safer and more profitable investment decisions. Don'
FREE
Super Trend eu
Emin Ulucanli
4.83 (6)
SUPERTREND; It is a trend following indicator based on the SuperTrend ATR created by Olivier Seban. It can be used to detect changes in trend direction and locate stops. When the price falls below the indicator curve, it turns red and indicates a downtrend. Conversely, when the price moves above the curve, the indicator turns green, indicating an uptrend. Like other indicators, it works well on SuperTrend when used in conjunction with other indicators such as MACD, parabolik SAR, Bollinger Band
FREE
이 제품의 구매자들이 또한 구매함
ARICoins
Temirlan Kdyrkhan
ARICoin is a powerful trading companion designed to generate high-probability entry signals with dynamic TP/SL/DP levels based on volatility. Built-in performance tracking shows win/loss stats, PP1/PP2 hits, and success rates all updated live. Key Features: Buy/Sell signals with adaptive volatility bands Real-time TP/SL/DP levels based on ATR Built-in MA Filter with optional ATR/StdDev volatility Performance stats panel (Success, Profit/Loss, PP1/PP2) Alerts via popup, sound, push, or email Cust
SuperScalp Pro
Van Minh Nguyen
5 (8)
SuperScalp Pro – 고급 다중 필터 스캘핑 인디케이터 시스템 SuperScalp Pro는 클래식 Supertrend와 여러 지능형 확인 필터를 결합한 고급 스캘핑 인디케이터 시스템입니다. 해당 인디케이터는 M1부터 H4까지 모든 타임프레임에서 효율적으로 작동하며, 특히 XAUUSD, BTCUSD 및 주요 외환 통화쌍에 적합합니다. 독립형 시스템으로 사용하거나 기존 거래 전략에 유연하게 통합할 수 있습니다. 이 인디케이터는 11개 이상의 필터를 통합하며, 빠른/느린 EMA, 추세 판별용 3개의 EMA, EMA 기울기(EMA slope), RSI, ADX, 거래량(Volume), VWAP, 볼린저 밴드 돌파(Bollinger Bands Breakout) 및 MACD 다이버전스 필터 등을 포함합니다. 스마트 캔들 필터는 캔들 종가를 확인하여 약한 신호를 제거하고, 3 EMA와 MACD 다이버전스 필터를 결합한 추세 인식 메커니즘은 더 높은 승률의 신호를 선별하는 데 도움을 줍니
AriX
Temirlan Kdyrkhan
1 (4)
AriX Indicator for MT5 A powerful trend-following and signal-evaluation tool AriX is a custom MT5 indicator that combines Moving Averages and ATR-based risk/reward logic to generate clear buy/sell signals. It visualizes dynamic SL/TP levels, evaluates past trade outcomes, and displays win/loss statistics in a clean on-chart panel. Key features include: Buy/Sell signals based on MA crossovers ATR-based SL/TP1/TP2/TP3 levels with visual lines and labels Signal outcome tracking with real-time stat
이 지표를 구매하면 제 프로페셔널 트레이드 매니저를 무료로 드립니다. 우선 이 거래 시스템이 리페인팅, 리드로잉 및 레이그 인디케이터가 아니라는 점을 강조하는 것이 중요합니다. 이는 수동 및 로봇 거래 모두에 이상적인 것으로 만듭니다. 온라인 강좌, 설명서 및 프리셋 다운로드. "스마트 트렌드 트레이딩 시스템 MT5"은 새로운 및 경험이 풍부한 트레이더를 위해 맞춤형으로 제작된 종합적인 거래 솔루션입니다. 10개 이상의 프리미엄 인디케이터를 결합하고 7개 이상의 견고한 거래 전략을 특징으로 하여 다양한 시장 조건에 대한 다목적 선택이 가능합니다. 트렌드 추종 전략: 효과적인 트렌드 추이를 타기 위한 정확한 진입 및 손절 관리를 제공합니다. 반전 전략: 잠재적인 트렌드 반전을 식별하여 트레이더가 범위 시장을 활용할 수 있게 합니다. 스캘핑 전략: 빠르고 정확한 데이 트레이딩 및 단기 거래를 위해 설계되었습니다. 안정성: 모든 인디케이터가 리페인팅, 리드로잉 및 레이그가 아니므로 신뢰
Divergence Bomber
Ihor Otkydach
4.89 (83)
이 지표를 구매하신 분께는 다음과 같은 혜택이 무료로 제공됩니다: 각 거래를 자동으로 관리하고, 손절/익절 수준을 설정하며, 전략 규칙에 따라 거래를 종료하는 전용 도우미 툴 "Bomber Utility" 다양한 자산에 맞게 지표를 설정할 수 있는 셋업 파일(Set Files) "최소 위험", "균형 잡힌 위험", "관망 전략" 모드로 설정 가능한 Bomber Utility의 셋업 파일 이 전략을 빠르게 설치, 설정, 시작할 수 있도록 돕는 단계별 영상 매뉴얼 주의: 위의 모든 보너스를 받기 위해서는 MQL5 개인 메시지 시스템을 통해 판매자에게 연락해 주세요. 독창적인 커스텀 지표인 “Divergence Bomber(다이버전스 봄버)”를 소개합니다. 이 지표는 MACD 다이버전스(괴리) 전략을 기반으로 한 올인원(All-in-One) 거래 시스템입니다. 이 기술 지표의 주요 목적은 가격과 MACD 지표 간의 다이버전스를 감지하고, **향후 가격이 어느 방향으로 움직일지를 알려주는
FX Trend MT5 NG
Daniel Stein
5 (4)
FX Trend NG: 차세대 멀티 마켓 트렌드 인텔리전스 개요 FX Trend NG 는 다중 시간 프레임 기반의 전문 트렌드 분석 및 시장 모니터링 도구입니다. 몇 초 만에 전체 시장 구조를 파악할 수 있도록 설계되었습니다. 여러 차트를 일일이 전환할 필요 없이, 어떤 종목이 추세에 있는지, 어디에서 모멘텀이 약화되고 있는지, 그리고 어떤 시간 프레임이 서로 정렬되어 있는지 즉시 확인할 수 있습니다. 출시 기념 특별 혜택 – FX Trend NG 를 $30 (6개월) 또는 $80 평생 라이선스 로 이용할 수 있습니다. 이미 Stein Investments 고객이신가요? -> 메시지를 보내 전용 고객 그룹에 참여하세요. 설정이나 사용 방법이 필요하신가요? -> Stein Investments 공식 페이지 를 방문하세요. 1. FX Trend NG가 특별한 이유 3단계 추세 로직 – 단순한 Buy / Sell이 아닙니다 • 대부분의 지표는 Buy 또는 Sell 두 가지 상태만 제
Entry In The Zone and SMC Multi Timeframe is a real-time market analysis tool developed based on Smart Money Concepts (SMC). It is designed to analyze market structure, price direction, reversal points, and key zones across multiple timeframes in a systematic way. The system displays Points of Interest (POI) and real-time No Repaint signals, with instant alerts when price reaches key zones or when signals occur within those zones. It functions as both an Indicator and a Signal System (2-in-1), c
Game Changer Indicator mt5
Vasiliy Strukov
4.8 (20)
Game Changer는 모든 금융 상품에 적용 가능한 혁신적인 추세 지표로, MetaTrader를 강력한 추세 분석 도구로 탈바꿈시켜 줍니다. 모든 시간대에서 작동하며 추세 식별, 잠재적 반전 신호 제공, 트레일링 스톱 기능, 그리고 신속한 시장 대응을 위한 실시간 알림 기능을 제공합니다. 숙련된 전문가든 이제 막 시작하는 초보자든, Game Changer는 추세의 역학을 명확하게 이해하고 자신감 있고 규율 있는 거래를 할 수 있도록 도와줍니다. 이 지표는 차트 재구성 기능을 지원합니다. 구매 후 즉시 연락 주시면 특별 보너스를 드립니다. Strong Support 및 Trend Scanner 지표를 무료로 제공해 드립니다. [email protected]으로 메시지를 보내주세요. 참고로, 저는 텔레그램에서 EA나 특별 세트를 판매하지 않습니다. 모든 EA는 MQL5에서만 사용 가능하며, 세트 파일은 제 블로그(여기)에서만 다운로드하실 수 있습니다. 사기꾼을 조심하시고 다른 사
RFI levels PRO MT5
Roman Podpora
3.67 (3)
이 지표는 추세 반전 지점과 가격 반등 영역을 정확하게 보여줍니다.       주요 투자자들   . 새로운 트렌드가 형성되는 곳을 파악하고 최대한 정확하게 의사결정을 내리며 모든 거래를 완벽하게 통제합니다. TREND LINES PRO   지표와 함께 사용할 때 최대의 잠재력을 발휘합니다.  VERSION MT4 지표가 보여주는 내용: 새로운 추세의 시작 시 활성화되는 반전 구조 및 반전 수준. 최소한의 위험 대비 수익률을 갖는 이익 실현   (TAKE PROFIT)   및   손절매(STOP LOSS)   레벨 표시       RR 1:2   . 지능형 손실 감소 로직이 적용된 손절매 기능. 지정된 지표에서 두 가지 추세 유형에 대한 반전 패턴을 표시합니다. 지표: 트렌드를 따라   트렌드 라인 프로   (글로벌 트렌드 변화) 트렌드 프로   (빠른 트렌드 변화) 간단하고 효과적입니다       스캐너       실시간 추세 (신규). 다중 시간 프레임 도구 필터링. 표시하다  
Gold Entry Sniper
Tahir Mehmood
5 (5)
Gold Entry Sniper – 골드 스캘핑 & 스윙 트레이딩을 위한 전문 다중 시간 프레임 ATR 대시보드 Gold Entry Sniper 는 XAUUSD 및 기타 종목에 대해 정확한 매수/매도 신호 를 제공하는 고급 MetaTrader 5 지표입니다. ATR 트레일링 스톱 로직 과 다중 시간 프레임 분석 을 기반으로 설계되어 스캘핑과 스윙 트레이딩 모두에 적합합니다. 주요 기능 및 장점 다중 시간 프레임 분석 – M1, M5, M15 추세를 한눈에 확인. ATR 기반 트레일링 스톱 – 변동성에 따라 자동 조정. 전문 차트 대시보드 – 신호 상태, ATR 레벨, 회귀선, 매매 방향 표시. 명확한 매수/매도 마커 – 자동 화살표와 텍스트 라벨. 종료 알림 & 거래 관리 – 수익 보호를 위한 자동 종료 감지. 완전 사용자 설정 가능 – 대시보드 위치, 색상, ATR/회귀선 파라미터 조정. 골드(XAUUSD) 최적화 – M1~M15 스캘핑에 완벽, 외환/지수/암호화폐에도 적용 가능.
Power Candles MT5
Daniel Stein
5 (6)
Power Candles – 모든 시장을 위한 강도 기반 진입 신호 Power Candles 는 Stein Investments의 검증된 강도 분석을 가격 차트에 직접 제공합니다. 가격 움직임에만 반응하는 대신, 각 캔들은 실제 시장 강도를 기준으로 색상화되어 모멘텀 형성, 강도 가속, 명확한 추세 전환을 즉시 파악할 수 있습니다. 모든 시장을 위한 단일 로직 Power Candles는 모든 거래 심볼 에서 자동으로 작동합니다. 현재 심볼이 Forex인지 비-Forex 시장인지 자동으로 감지하여 내부적으로 적절한 강도 모델을 적용합니다. Forex 및 Gold 는 FX Power Delta 값을 사용합니다 (절대값 범위 최대 100) 지수, 크립토 및 CFD 는 IX Power Strength 값을 사용합니다 (절대값 범위 최대 50) 필요한 강도 계산은 Power Candles에 완전히 내장되어 있습니다. 캔들 색상이나 신호 로직을 위해 추가 인디케이터는 필요하지 않습니다. 가격
FX Power MT5 NG
Daniel Stein
5 (31)
FX Power: 통화 강세 분석으로 더 스마트한 거래 결정을 개요 FX Power 는 어떤 시장 상황에서도 주요 통화와 금의 실제 강세를 이해하기 위한 필수 도구입니다. 강한 통화를 매수하고 약한 통화를 매도함으로써 FX Power 는 거래 결정을 단순화하고 높은 확률의 기회를 발견합니다. 트렌드를 따르거나 극단적인 델타 값을 사용해 반전을 예측하고자 한다면, 이 도구는 귀하의 거래 스타일에 완벽히 적응합니다. 단순히 거래하지 말고, FX Power 로 더 스마트하게 거래하세요. 1. FX Power가 거래자에게 매우 유용한 이유 통화와 금의 실시간 강세 분석 • FX Power 는 주요 통화와 금의 상대적 강세를 계산하고 표시하여 시장 역학에 대한 명확한 통찰력을 제공합니다. • 어떤 자산이 앞서고 있고 어떤 자산이 뒤처지는지 모니터링하여 보다 현명한 거래 결정을 내릴 수 있습니다. 포괄적인 멀티 타임프레임 뷰 • 단기, 중기 및 장기 타임프레임에서 통화와 금의 강세를
Azimuth Pro
Ottaviano De Cicco
5 (4)
LAUNCH PROMO Azimuth Pro price is initially set at 299$ for the first 100 buyers. Final price will be 499$ . THE DIFFERENCE BETWEEN RETAIL AND INSTITUTIONAL ENTRIES ISN'T THE INDICATOR — IT'S THE LOCATION. Most traders enter at arbitrary price levels, chasing momentum or reacting to lagging signals. Institutions wait for price to reach structured levels where supply and demand actually shift. Azimuth Pro maps these levels automatically: swing-anchored VWAP, multi-timeframe structure lines, an
Trend Lines PRO MT5
Roman Podpora
5 (1)
트렌드 라인즈 프로       이 지표는 시장이 실제로 어떤 방향으로 전환되는지 파악하는 데 도움이 됩니다. 실제 추세 반전 지점과 주요 시장 참여자들이 다시 진입하는 지점을 보여줍니다. 보시다시피       BOS 라인       복잡한 설정이나 불필요한 노이즈 없이 더 높은 시간대의 추세 변화와 주요 레벨을 확인할 수 있습니다. 신호는 차트에 다시 그려지지 않고 캔들이 마감된 후에도 계속 표시됩니다. MT4 버전   -   RFI LEVELS PRO   표시기   와 결합 시 최대 잠재력을 발휘합니다. 지표가 보여주는 내용: 실제 변화       추세(BOS 라인) 한 번 신호가 나타나면 그 신호는 계속 유효합니다! 이는 신호를 발생시킨 후 변경될 수 있는 리페인팅 방식의 지표와 중요한 차이점입니다. 리페인팅 방식의 지표는 잠재적으로 자금 손실로 이어질 수 있습니다. 이제 더욱 높은 확률과 정확도로 시장에 진입할 수 있습니다. 또한 화살표가 나타난 후 목표가(익절)에 도달하거나
Smart Stop Indicator – 차트 위에서 직접 작동하는 지능형 스톱로스 시스템 개요 Smart Stop Indicator는 감이나 추측이 아닌 명확하고 체계적인 방식으로 스톱로스를 설정하고 싶은 트레이더를 위한 맞춤형 솔루션입니다. 이 도구는 클래식 프라이스 액션 논리(고점, 저점 구조)와 현대적인 브레이크아웃 인식을 결합하여 실제로 가장 논리적인 다음 스톱 레벨을 정확히 식별합니다. 추세, 박스권, 빠른 브레이크아웃 상황 등 어떤 시장에서도 인디케이터는 최적의 SL 구역과 상태(“new”, “broken”, “valid”)를 차트에 직접 표시합니다. 새로운 기능으로 SL 거리의 %ADR 표시가 추가되었습니다. 핵심 기능 자동 시장구조 기반 스톱 설정 • 시장 구조와 실시간 가격 움직임을 기반으로 의미 있는 스톱로스 레벨을 자동으로 탐지합니다. 스마트 브레이크아웃 감지 • 빠른 방향 변화나 돌파 상황에서도 불필요한 조기 스톱 조정을 강요하지 않으며 유연하게 반응합
Atomic Analyst MT5
Issam Kassas
4.1 (29)
우선적으로 언급할 점은이 거래 지표가 다시 그리지 않고 지연되지 않으며 이를 통해 수동 및 로봇 거래 모두에 이상적이라는 점입니다. 사용자 매뉴얼: 설정, 입력 및 전략. Atomic Analyst는 가격의 강도와 모멘텀을 활용하여 시장에서 더 나은 이점을 찾는 PA Price Action Indicator입니다. 고급 필터를 장착하여 잡음과 거짓 신호를 제거하고 거래 잠재력을 높이는 데 도움이 됩니다. 복잡한 지표의 다중 레이어를 사용하여 Atomic Analyst는 차트를 스캔하고 복잡한 수학적 계산을 간단한 신호와 색상으로 변환하여 초보 트레이더가 이해하고 일관된 거래 결정을 내릴 수 있도록합니다. "Atomic Analyst"는 새로운 및 경험이 풍부한 트레이더를위한 종합적인 거래 솔루션입니다. 프리미엄 지표와 최고 수준의 기능을 하나의 거래 전략에 결합하여 모든 종류의 트레이더에 대한 다재다능한 선택지가되었습니다. 인트라데이 거래 및 스캘핑 전략 : 빠르고 정확한 일일
Trend Screener Pro MT5
STE S.S.COMPANY
4.84 (101)
트렌드 표시기, 트렌드 트레이딩 및 필터링을 위한 획기적인 고유 솔루션, 하나의 도구 안에 내장된 모든 중요한 트렌드 기능! Forex, 상품, 암호 화폐, 지수 및 주식과 같은 모든 기호/도구에 사용할 수 있는 100% 다시 칠하지 않는 다중 시간 프레임 및 다중 통화 표시기입니다. Trend Screener는 차트에 점이 있는 화살표 추세 신호를 제공하는 효율적인 지표 추세 추종 지표입니다. 추세 분석기 표시기에서 사용할 수 있는 기능: 1. 트렌드 스캐너. 2. 최대 이익 분석이 있는 추세선. 3. 추세 통화 강도 측정기. 4. 경고가 있는 추세 반전 점. 5. 경고가 있는 강력한 추세 점. 6. 추세 화살표 Trend Screener Indicator가 있는 일일 분석 예, 일일 신호 성능...등은 여기에서 찾을 수 있습니다. 여기를 클릭하십시오. LIMITED TIME OFFER : Trend Screener Indicator는 50$ 및 평생 동안만 사용할 수 있습니다.
Quantum TrendPulse
Bogdan Ion Puscasu
5 (20)
SuperTrend   ,   RSI   ,   Stochastic   의 힘을 하나의 포괄적인 지표로 결합하여 트레이딩 잠재력을 극대화하는 궁극의 트레이딩 도구   인 Quantum TrendPulse를   소개합니다. 정밀성과 효율성을 추구하는 트레이더를 위해 설계된 이 지표는 시장 추세, 모멘텀 변화, 최적의 진입 및 종료 지점을 자신 있게 식별하는 데 도움이 됩니다. 주요 특징: SuperTrend 통합:   주요 시장 추세를 쉽게 따라가고 수익성의 물결을 타세요. RSI 정밀도:   매수 과다 및 매도 과다 수준을 감지하여 시장 반전 시점을 파악하는 데 적합하며 SuperTrend 필터로 사용 가능 확률적 정확도:   변동성이 큰 시장에서 숨겨진 기회를 찾기 위해 확률적 진동   을 활용하고 SuperTrend의 필터로 사용 다중 시간대 분석:   M5부터 H1 또는 H4까지 다양한 시간대에 걸쳐 시장을 최신 상태로 유지하세요. 맞춤형 알림:   맞춤형 거래 조건이 충족되면
FX Levels MT5
Daniel Stein
5 (13)
FX Levels: 모든 시장을 위한 뛰어난 정확도의 지지와 저항 간단 요약 통화쌍, 지수, 주식, 원자재 등 어떤 시장이든 믿을 만한 지지·저항 레벨을 찾고 싶나요? FX Levels 는 전통적인 “Lighthouse” 기법과 첨단 동적 접근을 결합해, 거의 보편적인 정확성을 제공합니다. 실제 브로커 경험을 반영하고, 자동화된 일별 업데이트와 실시간 업데이트를 결합함으로써 FX Levels 는 가격 반전 포인트를 파악하고, 수익 목표를 설정하며, 자신 있게 트레이드를 관리할 수 있게 돕습니다. 지금 바로 시도해 보세요—정교한 지지/저항 분석이 어떻게 여러분의 트레이딩을 한 단계 끌어올릴 수 있는지 직접 확인하세요! 1. FX Levels가 트레이더에게 매우 유용한 이유 뛰어난 정확도의 지지·저항 존 • FX Levels 는 다양한 브로커 환경에서도 거의 동일한 존을 생성하도록 설계되어, 데이터 피드나 시간 설정 차이로 인한 불일치를 해소합니다. • 즉, 어떤 브로커를 사용하
Trend indicator AI mt5
Ramil Minniakhmetov
5 (15)
트렌드 인공 지능 지표는 실행 가능한 진입 점 및 반전 경고와 추세 식별을 결합하여 상인의 시장 분석을 향상시킬 훌륭한 도구입니다. 이 표시기는 사용자가 자신감과 정밀도로 외환 시장의 복잡성을 탐색 할 수 있도록 지원합니다 기본 신호 외에도 트렌드 인공 지능 지표는 풀백 또는 되돌림 중에 발생하는 2 차 진입 점을 식별하여 거래자가 기존 트렌드 내에서 가격 수정을 활용할 수 있도록합니다. 중요한 장점: ·작동 4 및 5 *명확한 구매 또는 판매 신호 *다시 칠하지 않습니다 *모든 자산에서 작동 나는 전보 사기에 개 또는 세트를 판매하지 않도록주의. 모든 설정은 블로그에 여기에 무료.  중요! 지침 및 보너스를 얻기 위해 구입 후 즉시 저에게 연락! 진짜 가동 감시는 뿐 아니라 나의 다른 제품 여기에서 찾아낼 수 있습니다: https://www.mql5.com/en/users/mechanic/seller&nbsp ; 설정 및 입력: 모든 자산에 대해 기본 설정을 권
Grabber System MT5
Ihor Otkydach
4.82 (22)
탁월한 기술적 지표인 Grabber를 소개합니다. 이 도구는 즉시 사용 가능한 “올인원(All-Inclusive)” 트레이딩 전략으로 작동합니다. 하나의 코드 안에 강력한 시장 기술 분석 도구, 매매 신호(화살표), 알림 기능, 푸시 알림이 통합되어 있습니다. 이 인디케이터를 구매하신 모든 분들께는 다음의 항목이 무료로 제공됩니다: Grabber 유틸리티: 오픈 포지션을 자동으로 관리하는 도구 단계별 영상 매뉴얼: 설치, 설정, 그리고 실제 거래 방법을 안내 맞춤형 세트 파일: 인디케이터를 빠르게 자동 설정하여 최고의 성과를 낼 수 있도록 도와줍니다 다른 전략은 이제 잊어버리세요! Grabber만이 여러분을 새로운 트레이딩의 정점으로 이끌어 줄 수 있습니다. Grabber 전략의 주요 특징: 거래 시간 프레임: M5부터 H4까지 거래 가능한 자산: 어떤 자산이든 사용 가능하지만, 제가 직접 테스트한 종목들을 추천드립니다 (GBPUSD, GBPCAD, GBPCHF, AUDCAD, AU
RelicusRoad Pro MT5
Relicus LLC
5 (24)
RelicusRoad Pro: 퀀트 시장 운영 체제 70% 할인 평생 이용권 (한정 시간) - 2,000명 이상의 트레이더와 함께하세요 왜 대부분의 트레이더는 "완벽한" 지표를 가지고도 실패할까요? 진공 상태에서 단일 개념 만으로 거래하기 때문입니다. 문맥 없는 신호는 도박입니다. 지속적인 승리를 위해서는 컨플루언스(중첩) 가 필요합니다. RelicusRoad Pro는 단순한 화살표 지표가 아닙니다. 완전한 퀀트 시장 생태계 입니다. 독점적인 변동성 모델링을 사용하여 가격이 이동하는 "공정 가치 로드"를 매핑하고, 단순 노이즈와 실제 구조적 돌파를 구분합니다. 추측은 그만두세요. 기관급 로드 로직으로 거래를 시작하세요. 핵심 엔진: "Road" 알고리즘 시스템의 중심에는 시장 상황에 실시간으로 적응하는 동적 변동성 채널인 Road Algo 가 있습니다. 세이프 라인(평형) 과 가격이 수학적으로 반전될 가능성이 높은 확장 레벨 을 투영합니다. Simple Road: 일반적인 시장을 위
Entry Points Pro for MT5
Yury Orlov
4.48 (138)
다시 색을 칠하지 않고 거래에 진입할 수 있는 정확한 신호를 제공하는 MT5용 지표입니다. 외환, 암호화폐, 금속, 주식, 지수 등 모든 금융 자산에 적용할 수 있습니다. 매우 정확한 추정값을 제공하고 매수와 매도의 가장 좋은 시점을 알려줍니다. 하나의 시그널로 수익을 내는 지표의 예와 함께 비디오 (6:22)시청하십시오! 대부분의 거래자는 Entry Points Pro 지표의 도움으로 첫 거래 주 동안 트레이딩 결과를 개선합니다. 저희의   Telegram Group 을 구독하세요! Entry Points Pro 지표의 좋은점. 재도색이 없는 진입 신호 신호가 나타나고 확인되면(시그널 캔들이 완성된 경우) 신호는 더 이상 사라지지 않습니다. 여타 보조지표의 경우 신호를 표시한 다음 제거되기 때문에 큰 재정적 손실로 이어집니다. 오류 없는 거래 게시 알고리즘을 통해 트레이드(진입 또는 청산)를 할 이상적인 순간을 찾을 수 있으며, 이를 통해 이를 사용하는 모든 거래자의 성공률이
IX Power MT5
Daniel Stein
4.92 (13)
IX Power: 지수, 원자재, 암호화폐 및 외환 시장 통찰력을 발견하세요 개요 IX Power 는 지수, 원자재, 암호화폐 및 외환 시장의 강도를 분석할 수 있는 다목적 도구입니다. FX Power 는 모든 가용 통화 쌍 데이터를 사용하여 외환 쌍에 대해 가장 높은 정확도를 제공하는 반면, IX Power 는 기초 자산 시장 데이터에만 초점을 맞춥니다. 이로 인해 IX Power 는 비외환 시장에 이상적이며, 다중 쌍 분석이 필요하지 않은 간단한 외환 분석에도 신뢰할 수 있는 도구입니다. 모든 차트에서 매끄럽게 작동하며, 거래 결정을 향상시키기 위한 명확하고 실행 가능한 통찰력을 제공합니다. 1. IX Power가 트레이더에게 유용한 이유 다양한 시장 강도 분석 • IX Power 는 지수, 원자재, 암호화폐 및 외환 심볼의 강도를 계산하여 각 시장에 맞는 통찰력을 제공합니다. • US30, WTI, 금, 비트코인 또는 통화 쌍과 같은 자산을 모니터링하여 거래 기회를 발견
FX Dynamic MT5
Daniel Stein
5 (5)
FX Dynamic: 맞춤형 ATR 분석으로 변동성과 트렌드를 파악하세요 개요 FX Dynamic 는 Average True Range(ATR) 계산을 활용하여 트레이더에게 일간 및 일중 변동성에 대한 뛰어난 인사이트를 제공하는 강력한 도구입니다. 80%, 100%, 130%와 같은 명확한 변동성 임계값을 설정함으로써 시장이 평소 범위를 초과할 때 빠르게 경고를 받고, 유망한 수익 기회를 재빨리 식별할 수 있습니다. FX Dynamic 는 브로커의 시간대를 인식하거나 수동으로 조정할 수 있으며, 변동성 측정 기준을 일관되게 유지하며, MetaTrader 플랫폼과 완벽하게 연동되어 실시간 분석을 지원합니다. 1. FX Dynamic이 트레이더에게 매우 유용한 이유 실시간 ATR 인사이트 • 하루 및 일중 변동성을 한눈에 모니터링하세요. ATR의 80%, 100%, 130% 임계값이 도달 또는 초과되면, 시장의 중요한 지점에 있음을 알 수 있습니다. • 변동성이 완전히 폭발하기
ARIPoint
Temirlan Kdyrkhan
ARIPoint is a powerful trading companion designed to generate high-probability entry signals with dynamic TP/SL/DP levels based on volatility. Built-in performance tracking shows win/loss stats, PP1/PP2 hits, and success rates all updated live. Key Features: Buy/Sell signals with adaptive volatility bands Real-time TP/SL/DP levels based on ATR Built-in MA Filter with optional ATR/StdDev volatility Performance stats panel (Success, Profit/Loss, PP1/PP2) Alerts via popup, sound, push, or email Cu
Candle Smart Range
Gianny Alexander Lugo Sanchez
MetaTrader 5용 Candle Smart Range (CSR) Candle Smart Range는 여러 타임프레임에서 가격 범위를 자동으로 식별하도록 설계된 기술 지표입니다. 이 도구는 캔들 형성 및 이전 고점/저점과의 상호작용을 바탕으로 시장 구조를 분석합니다. 주요 기능: 범위 감지: 급격한 변동 전의 횡보 구간을 자동으로 식별합니다. 거짓 돌파 식별: 가격이 이전 수준을 넘어섰으나 캔들 종가 기준으로 범위 내에서 마감된 경우를 표시합니다. 멀티 타임프레임 분석: 사용자 정의 주기를 포함하여 최대 19개의 타임프레임 데이터를 한 차트에 표시합니다. 내부 시각화 (줌): 차트 변경 없이 상위 타임프레임 캔들 내부의 가격 움직임을 확인할 수 있습니다. 시간 필터: 주요 시장 세션 등 특정 시간대에만 작동하도록 설정 가능합니다. 과거 데이터 복기 모드: 과거 데이터를 단계별로 탐색하며 지표의 작동을 분석할 수 있습니다. 알림 시스템: 캔들 마감 및 새로운 범위 감지에 대한 사용
Trend Forecaster
Alexey Minkov
5 (7)
The Trend Forecaster indicator utilizes a unique proprietary algorithm to determine entry points for a breakout trading strategy. The indicator identifies price clusters, analyzes price movement near levels, and provides a signal when the price breaks through a level. The Trend Forecaster indicator is suitable for all financial assets, including currencies (Forex), metals, stocks, indices, and cryptocurrencies. You can also adjust the indicator to work on any time frames, although it is recommen
Mirage Trading System — False Breakout Reversal Indicator for MT5 False breakouts occur when price moves beyond a key level and then reverses back inside. The Mirage Trading System scans for this formation — the Fakey pattern — and identifies the point where the breakout fails and price returns to the prior range. Every detected pattern is evaluated by a 17-factor quality scoring system and classified through a 4-layer Signal Engine before it appears on the chart. USER MANUAL ,  Elite Trading S
" Dynamic Scalper System MT5 " 지표는 추세 파동 내에서 스캘핑 방식으로 거래하도록 설계되었습니다. 주요 통화쌍 및 금에서 테스트되었으며, 다른 거래 상품과의 호환성이 가능합니다. 추가적인 가격 변동 지원을 통해 추세에 따라 단기 포지션 진입 신호를 제공합니다. 지표의 원리 큰 화살표는 추세 방향을 결정합니다. 작은 화살표 형태의 스캘핑 신호를 생성하는 알고리즘은 추세 파동 내에서 작동합니다. 빨간색 화살표는 상승 방향을, 파란색 화살표는 하락 방향을 나타냅니다. 민감한 가격 변동선은 추세 방향으로 그려지며, 작은 화살표의 신호와 함께 작용합니다. 신호는 다음과 같이 작동합니다. 적절한 시점에 선이 나타나면 진입 신호가 형성되고, 선이 있는 동안 미결제 포지션을 유지하며, 완료되면 거래를 종료합니다. 권장되는 작업 시간대는 M1~H4입니다. 화살표는 현재 캔들에 형성되며, 다음 캔들이 이미 시작되었더라도 이전 캔들의 화살표는 다시 그려지지 않습니다. 입
제작자의 제품 더 보기
Strong Bull V7 B&C  The ultimate M5 indicator for Boom & Crash indices, providing clear, filtered buy/sell signals to eliminate market noise and enhance your trading precision. Benefit-Focused Master the volatile Boom & Crash markets with Strong Bull V7 B&C . This intelligent indicator provides clear visual arrows and text labels for high-probability setups on the M5 timeframe. Its unique symbol-filtering technology automatically hides conflicting signals (no buys on Crash, no sells on Boom), en
1. Tool Description The   Dynamic Liquidity HeatMap Profile   is an advanced technical indicator originally designed by BigBeluga (Pine Script) and ported to MQL5. Unlike a standard Volume Profile which shows where volume   has   occurred, this tool attempts to visualize where liquidity (limit orders and stop losses) is   likely waiting   (resting liquidity). It works by identifying pivots (local highs and lows) weighted by volume and ATR.   Crucially, if price moves through a level, that liquid
Market voleum profile
Israr Hussain Shah
Description The Market Profile & Volume Profile Indicator is a powerful technical analysis tool designed to visualize market activity and price distribution over specific timeframes. Unlike standard technical indicators that focus solely on price over time, this indicator organizes price data to show where the market spent the most time (TPO) and where the most volume was traded (Volume Profile). It automatically calculates and displays key structural levels such as the Point of Control (POC) ,
Binary Rise Fall
Israr Hussain Shah
Fractals_Price Indicator Description The Fractals_Price indicator is a technical analysis tool that identifies fractal patterns on price charts. Fractals are recurring patterns that signal potential trend reversals or continuation points. This indicator marks both upward and downward fractals with colored arrows and can display price labels at these points. Key Features  Identifies upward fractals (magenta arrows) marking potential resistance levels Identifies downward fractals (blue arrows)
Trend Duration Forecast
Israr Hussain Shah
4 (2)
Trend Duration Forecast It utilizes a Hull Moving Average (HMA) to detect trend direction and statistically forecasts the probable duration of the current move based on historical market behavior. Key Features Smooth Trend Detection:   Uses the Hull Moving Average (HMA) to filter noise while minimizing lag, providing clean Bullish/Bearish signals. Real-Time Duration Counter:   Displays a dynamic label at the start of the current trend showing the   "Real Length"   (number of bars the trend has b
FREE
Visualize Hidden Liquidity & Stop Runs The    Liquidity Heatmap   is a sophisticated institutional trading tool designed to reveal where over-leveraged traders are trapped. By calculating estimated liquidation levels based on volume spikes and leverage, this indicator draws a dynamic "heatmap" of support and resistance zones that traditional technical analysis misses. Price is often attracted to these liquidity pools like a magnet. When price hits these lines, positions are forced to close, ofte
Buy Sell Range
Israr Hussain Shah
The Range Filter Buy and Sell indicator is a trend-following technical analysis tool designed to identify optimal entry and exit points in the market. It filters out market noise by creating dynamic bands around price movements, generating clear buy and sell signals when price breaks through these bands. Key Features Dynamic Range Filtering : Uses a sophisticated algorithm to calculate adaptive bands that adjust to market volatility Trend Identification : Clearly visualizes the current trend dir
FREE
Market Profile with Dashboard Indicator - Complete User Guide indicator Overview The Market Profile with Dashboard is a comprehensive trading analysis tool for MetaTrader 4 that displays market profile data, volume analysis, and key market structure information directly on your chart. This indicator helps traders identify significant price levels, market balance areas, and potential trading opportunities based on market profile theory. Core Components and Features Market Profile Display - Sh
Spike Blast Pro
Israr Hussain Shah
Spike Blaster Pro – The Ultimate Spike Detection Tool Spike Blaster Pro is a next-generation MT5 indicator designed specifically for synthetic markets. It works seamlessly on Boom Index and Weltrade Index , providing traders with sharp, reliable spike detection signals. What makes Spike Blaster Pro powerful is its 5 Core Strategies built into one system, giving traders a multi-layer confirmation before signals appear. This ensures high accuracy and reduces false alerts. 5 Core Strategies B
Crash Spike Mitigation Zone Pro A professional spike pattern indicator built for synthetic traders who scalp and swing Crash 500/300/1000 with precision.  This indicator: Detects powerful 3-candle spike formations (Spike → Pullback → Spike) Automatically draws a clean box around the pattern Marks the entry price from the middle candle Extends a horizontal mitigation line to guide perfect sniper entries Automatically deletes & redraws the line once price touches it (mitigation)
FREE
Major Swing Fibonacci Indicator - Professional Trading Tool What It Does Automatically detects major swing points not internal noise Generates buy/sell signals at key Fibonacci levels Displays professional GUI panel with real-time analysis Marks major swings with visual indicators Trading Strategy BUY at 38.2%-61.8% Fibonacci support in uptrends SELL  Past performance is not indicative of future results. This indicator is for educational and informational purposes only and does not constitute in
FREE
Auto Analysis
Israr Hussain Shah
5 (1)
FiboPivot TrendLines - Comprehensive Market Analysis Indicator This powerful indicator combines Fibonacci pivot point analysis with automatic trend line detection, providing traders with a complete technical analysis toolkit in a single tool. Key Features : - Fibonacci Pivot Points: Automatically calculates and displays R1-R3, Pivot, and S1-S3 levels using previous day's data - Fractal-Based Trend Lines: Automatically draws channel trend lines based on fractal patterns - Interactive
FREE
Big Bull Scalper
Israr Hussain Shah
Big bull scalper Short Description Master market structure with the precision of the popular Big bull scalper  This tool automatically identifies key pivot highs and lows, plotting unique "angling" trend lines that dynamically define market context. It visually confirms Breaks of Structure (BOS) and Changes of Character (CHoCH), removing all guesswork from your analysis. Key Features:    Automatic Pivot Detection Instantly spots significant swing highs and lows.    Dynamic Angling Lines Visual
FREE
Super Trend Live
Israr Hussain Shah
super trend version is to help you to have real time view of market move it will help you to get a live view of current market  buy signal line and arrow to help you understand batter the direction sell signal line and arrow to help you understand batter the direction trade what you see not what you think this is an simple and best trading tool for our traders of any market crypto gold 
FREE
Smart trend pro
Israr Hussain Shah
Smart Trend pro New - Advanced Trend Indicator with Interactive GUI Professional trend-following indicator with comprehensive visualization and control panel Key Features: Advanced Trend Detection Reliable Half Trend algorithm for precise trend identification Color-coded trend lines (Blue for bullish, Orange for bearish) Customizable amplitude parameter for different trading styles Interactive GUI Panel Real-time market strength visualization (Bulls vs Bears) Current signal display (Buy/Se
FREE
Trade Like Pro
Israr Hussain Shah
A Smart Price Imbalance Tool with Arrows, Labels, and FVG Zones The Fair Value Gap (FVG) Indicator is designed to automatically detect price imbalance zones on the chart – a widely used concept in Smart Money Concepts (SMC) and Institutional Trading Models (ICT) . These gaps, also known as imbalances or inefficiencies , often highlight areas where price may return to "rebalance" liquidity. Many professional traders consider these levels as high-probability zones for potential reversals, retrace
Analysis Professor
Israr Hussain Shah
FiboPivot Dashboard - Professional Pivot Point Indicator What It Does FiboPivot Dashboard is a powerful technical analysis tool that automatically calculates and displays Fibonacci-based pivot points on your chart. It identifies key support and resistance levels based on the previous day's price action, helping traders anticipate potential price reversal points and breakout levels.   How to Use 1. **Install & Apply**: Simply attach the indicator to any chart (time frames below D1) 2. **
FREE
Volume Profile Advance
Israr Hussain Shah
Daily & Composite Volume Profile   This is a professional-grade market profile tool designed for MetaTrader 5. It utilizes a   Dual-Profile System   to visualize supply, demand, and liquidity concentrations. Key Features Left Side: Daily Session Profiles Automatically identifies the start and end of every trading day. Generates a unique Volume Profile for each individual day. Allows you to see how value migrated from yesterday to today (e.g., Is today's volume higher or lower than yesterday?).
Trading Guide MT5 Indicator - Ultimate Trading Psychology Assistant Description The Trading Guide MT5 Indicator is a powerful psychological trading assistant designed to keep traders disciplined, focused, and emotionally balanced. This innovative indicator displays real-time motivational messages, trading rules, and analysis guidelines directly on your chart, with vibrant blinking colors to capture your attention and reinforce proper trading habits.  Key Features Real-Time Trading Psychology
FREE
Liquidity Strength pro
Israr Hussain Shah
Liquidity Channels Pro  MT5 VERSION HERE   Liquidity Channels  is a sophisticated Smart Money Concepts (SMC) tool designed to automate the identification of     Buy Side Liquidity (BSL)   and     Sell Side Liquidity (SSL) . Unlike standard support and resistance indicators, this tool doesn't just draw lines; it projects     dynamic expanding channels   based on volatility (ATR) from key pivot points. Crucially, it follows the "Mitigation" logic used by institutional traders:     once liquidity i
2025 Spike Killer Dashboard - Advanced Trading Signals & Market Analytics Transform Your Trading with Intelligent Market Insights! The 2025 Spike Killer Dashboard is a powerful MQL5 indicator that combines cutting-edge signal generation with an intuitive crystal dashboard for real-time market analysis. Designed for traders who demand precision and clarity, this all-in-one tool delivers actionable signals and comprehensive market metrics at a glance. Key Features: Dual Signal System Shved S
Risk Control Tool
Israr Hussain Shah
Smart Risk Manager – Risk/Reward Ratio & Position Sizing Tool for MT5 Overview (Short Description) A professional risk management indicator that helps traders calculate lot size, risk percentage, and reward ratio in real time. Perfect for Forex, Indices, Gold, and Synthetic Indices traders who want precise control over their capital. Full Description Trading without proper risk management is like driving without brakes. The Smart Risk Manager for MT5 gives you full control over your position siz
Bollinger Fibo Pro: The Ultimate Fusion of Volatility, Fibonacci, and Trend Analysis Short Description: Stop overloading your charts with dozens of indicators.   Bollinger Fibo  Pro   is a sophisticated, all-in-one trading system for MetaTrader 5 that merges two legendary concepts into a single, powerful tool. It enhances standard Bollinger Bands with precise Fibonacci extension levels and couples them with a non-repainting ZigZag to accurately identify trends, reversals, and key market structu
11 Modules Description & Final Analyzer Trading Guide 1. Reaction Engine 2.0 Purpose : Measures market pressure by analyzing tick movements, volume, and speed within a time window.   How it works : Calculates weighted price changes, considers tick velocity and volatility, and applies EMA smoothing.   Trading use : Strong positive values indicate buying pressure Strong negative values indicate selling pressure Use as confirmation for entry/exit signals 2. Flow Pattern Detector Purpose : Identifie
Color schemes
Israr Hussain Shah
Colors schemes powerful MetaTrader 5 script designed for traders who value speed and a personalized trading environment. With a single click, you can instantly transform your chart's appearance using one of several professional, pre-designed color schemes, including popular styles like ICT/SMC. How to Use: In your MetaTrader 5 terminal, open the Navigator window (Ctrl+N). Find the Colors schemes script under the "Scripts" section. Drag and drop the script onto the chart you want to customize. A
The   Trend Analysis Dashboard   is a powerful, all-in-one technical analysis tool designed for traders who need a clear, consolidated view of market momentum across multiple timeframes. Instead of cluttering your chart with numerous separate indicators, this tool aggregates signals from four key oscillators (Stochastic, RSI, and dual CCI) into a single, easy-to-read panel. It calculates the directional bias (Buy, Sell, or Neutral) for each enabled timeframe and provides a visual summary of over
Trade Manger
Israr Hussain Shah
You Give an Instruction: When you run the script, a window pops up with a dropdown menu. You choose exactly what you want it to do from the list (e.g., "Close Profit Only" or "Delete Pending Orders"). It Scans Your Positions: The script then reads your instruction and systematically goes through your open trades and/or pending orders on the current chart. It Applies Your Rule: For each trade it finds, it checks if it matches the rule you selected. If you chose "Close Buy Only," it will only clo
How the Chart Cleaner Script Works The Chart Cleaner is a one-click tool designed to instantly wipe your chart clean. When you drag and drop the script onto a chart, it scans for and removes all visual objects—including trend lines, horizontal lines, text labels, shapes, and any other drawings you have placed. The result is a completely clean, uncluttered chart, giving you a fresh workspace for your analysis. It's the fastest way to reset your chart to its default state.
Traders Master pack
Israr Hussain Shah
Comprehensive Trading Analysis Tool This tool has four main parts that help traders understand the market and manage risk in a simple way 1 Risk and Reward Visual Tool It shows two boxes on the chart a pink box for risk and a navy blue box for reward It shows the risk to reward ratio You can move and resize the boxes It shows pips and possible money for risk and reward It gives a clear picture of possible profit and loss It helps plan trades before entering It keeps risk levels consistent It hel
Order Blocks Trading
Israr Hussain Shah
What It Does Finds Order Blocks (ANN + SMC) on big and small timeframes. Marks them with clean bullish/bearish zones. Drops arrows (blue = BUY, red = SELL) right inside each block. Shows an info panel on the right with the exact high/low of the newest blocks. Lets you change chart colors (background, bull candle, bear candle) instantly. How To Use It Drop the indicator into MQL5/Indicators → restart MT5. Add it to your chart. In the settings: Pick your background , bull candle , and bear candle
필터:
리뷰 없음
리뷰 답변