Accurate Gold MT5
- 지표
- 버전: 3.0
- 업데이트됨: 16 5월 2026
- 활성화: 5
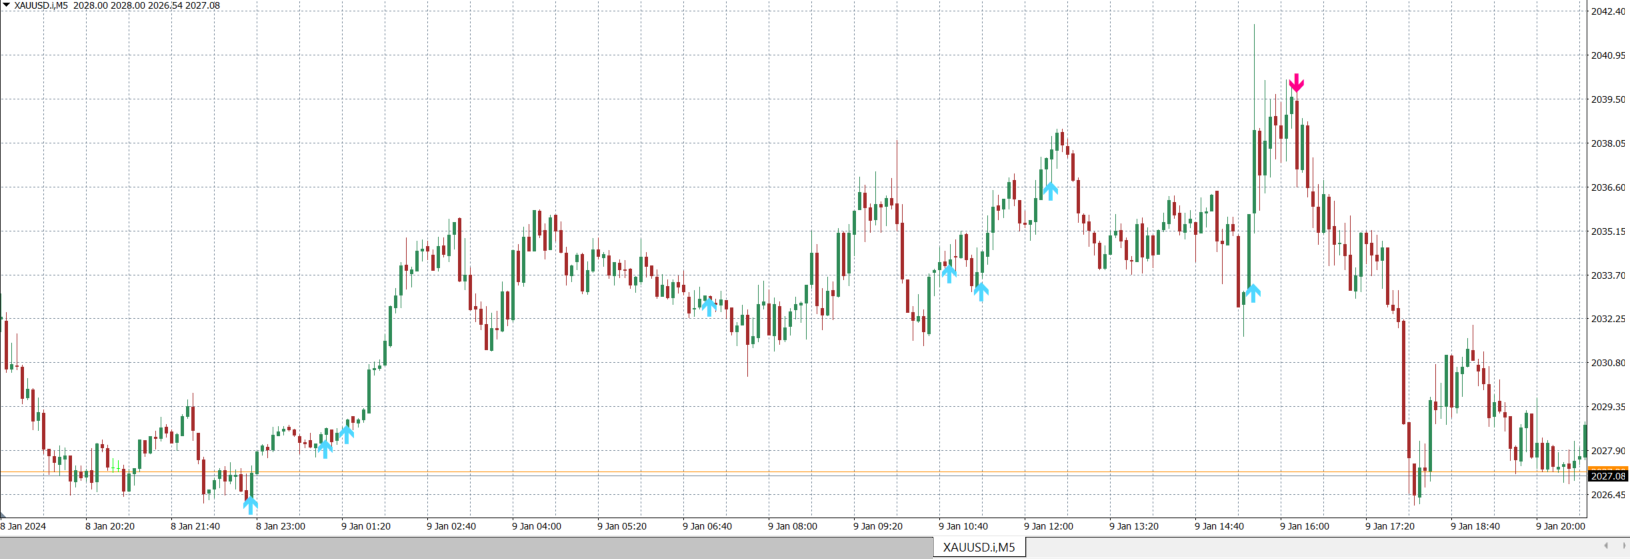
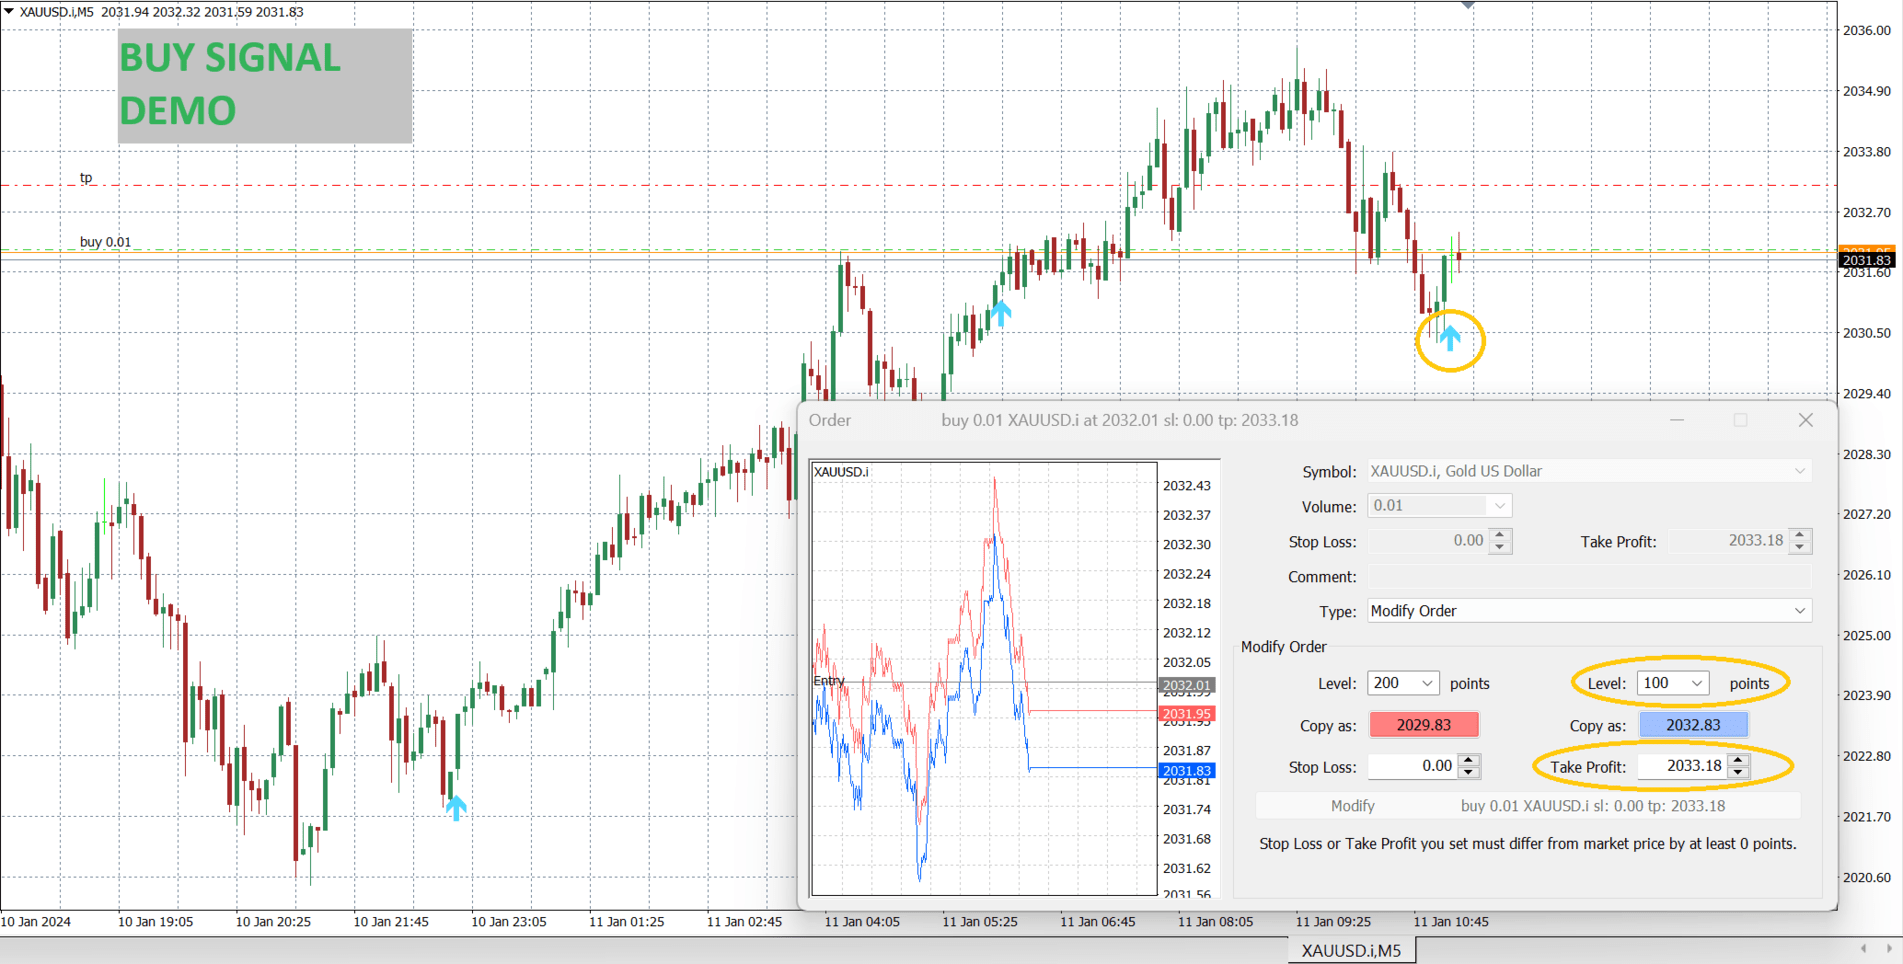
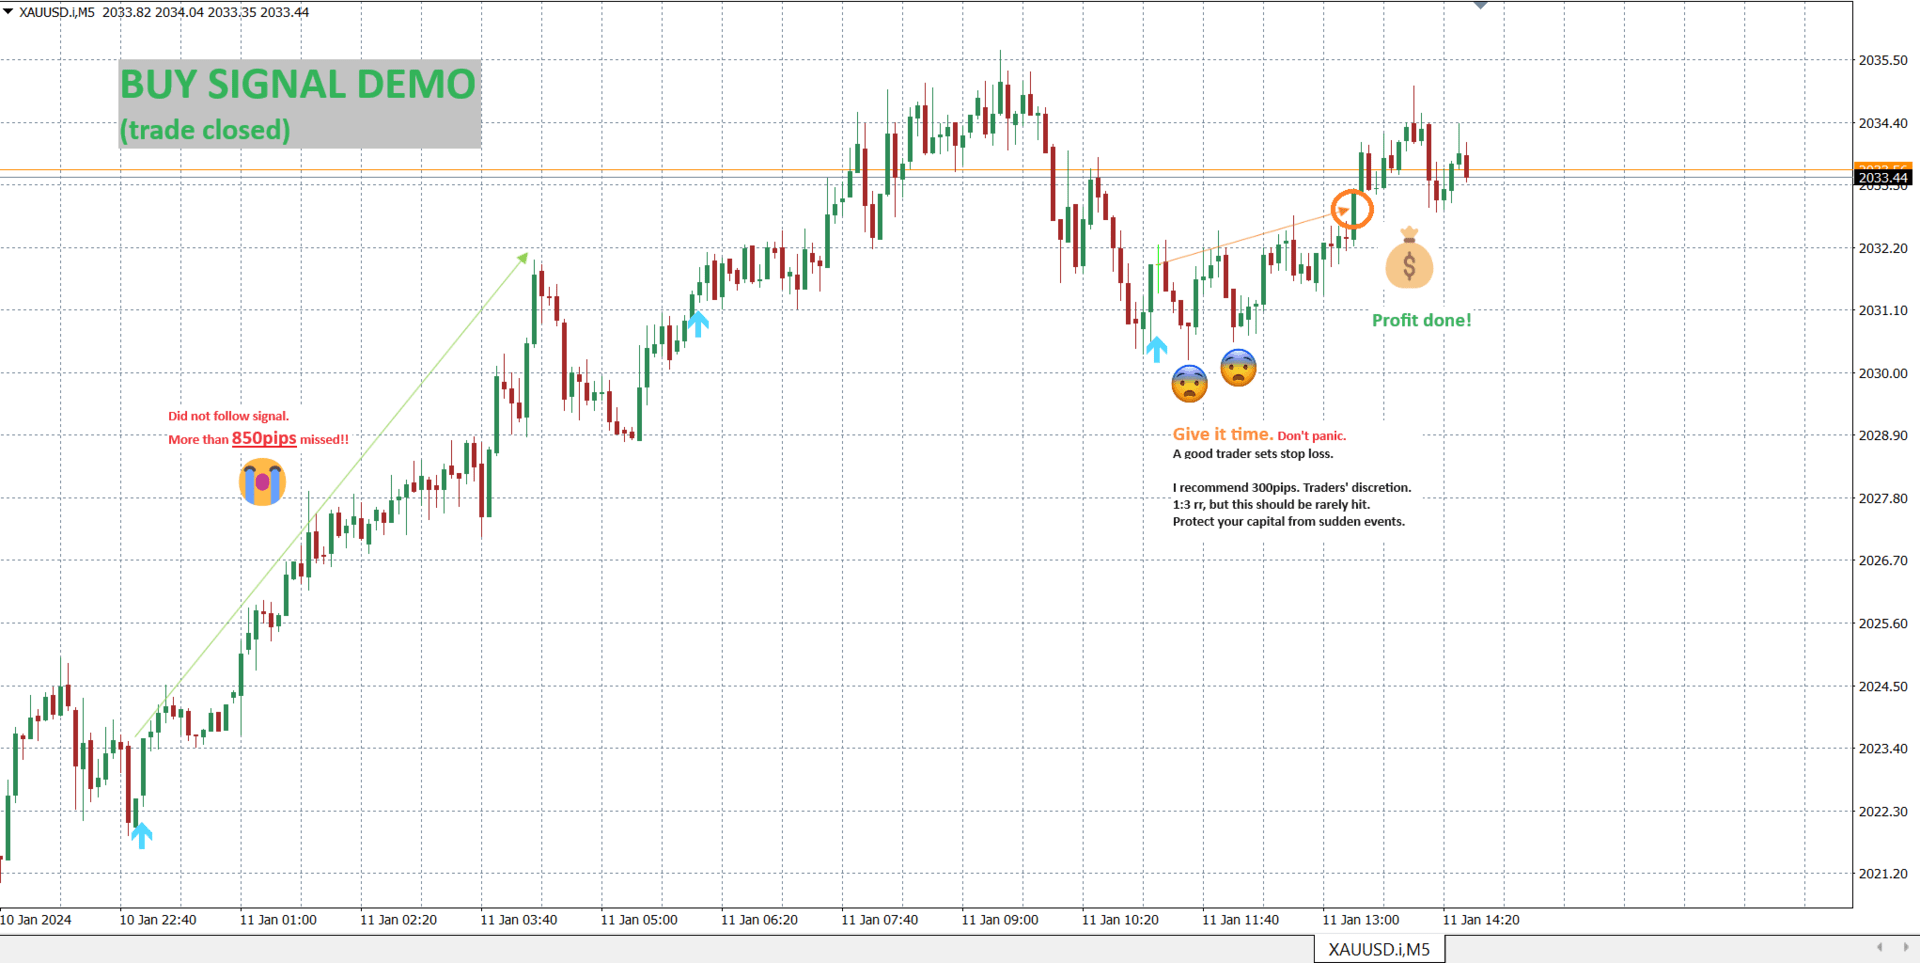
Accurate Gold 지표는 트레이더들의 경험 수준과 관계없이 직관적이고 사용하기 쉬운 사용자 친화적인 도구입니다. 이 지표는 황금 시장의 M5 시간 프레임에서 정확한 신호를 찾는 트레이더들을 위해 설계되었습니다. 이 지표는 가격 움직임과 거래량 동태를 분석하기 위해 고급 수학적 알고리즘을 사용하여 정확한 매수 및 매도 신호를 생성합니다. 이 지표의 비리페인트 특성을 포함한 독특한 기능은 트레이더들에게 잠재적인 시장 반전에 대한 가치 있는 통찰력을 제공하여 판단력 있은 의사 결정을 가능케 합니다. 차트 상의 시각적 표현과 함께 청취 가능한 경고 및 푸시 알림이 사용자 경험을 향상시켜 황금 트레이더들의 도구 상자에 정확성과 신뢰성을 찾는 데 유용한 추가 요소가 됩니다.
⛔ $XX – 한정된 기간 동안, 가격은 처음 5명의 후원자에게 $ XX 입니다. ( 💯% 매진)
✅ $88 – 그 후, 출시 가격은 $88로 재개되며 골드 심볼로만 제한됩니다.
⛔ $88 + X ($100) – 3회 구매 시마다 가격이 $100씩 인상됩니다.
MT5 신호는 여기에서 확인하고 토론 포럼은 여기에서 확인하세요.
권장 사항:
- 타임프레임: M5 전용
- 통화 쌍: XAUUSD 전용
- 계정 유형: 매우 낮은 스프레드를 갖춘 ECN, Raw 또는 Razor 브로커 시간: 어떤 시간이든
- 브로커: 최저 스프레드를 위해 IC Markets, Pepperstone의 Raw 및 Razor 계정 이익 실현 수준: 트레이더의 경험 및 리스크 수용도에 따라 10픽 센트 이상
주의:
- 놓친 신호를 추격하지 마십시오
기술적인 사양:
- 지표가 리페인트되지 않습니다
- 높은 정밀도로 매수 및 매도 신호 식별
- 시각적 및 소리 경고 사용 가능 (사용자 정의 가능)
- 설치 파일이 필요하지 않음
면책사항:
- 과거 성과는 향후 결과를 보장하지 않습니다
- 내 제품은 mql5.com에서만 제공됩니다
- 저는 개인적으로 여러분에게 연락하거나 제품을 판매하지 않을 것입니다