Dashboard Multi Currency MTF Double CCI
- インディケータ
- バージョン: 1.30
- アップデート済み: 6 2月 2025
- アクティベーション: 20

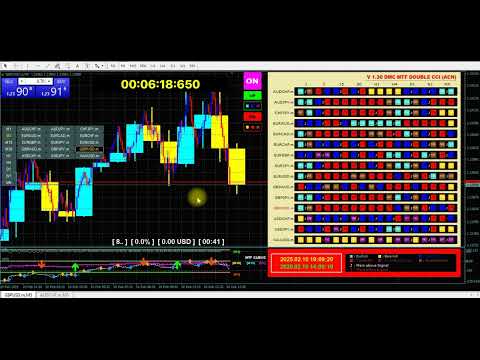
この取引ツールを使用すると、15の市場を同時にスキャンできます。
新しい取引インジケーター2024のご紹介:
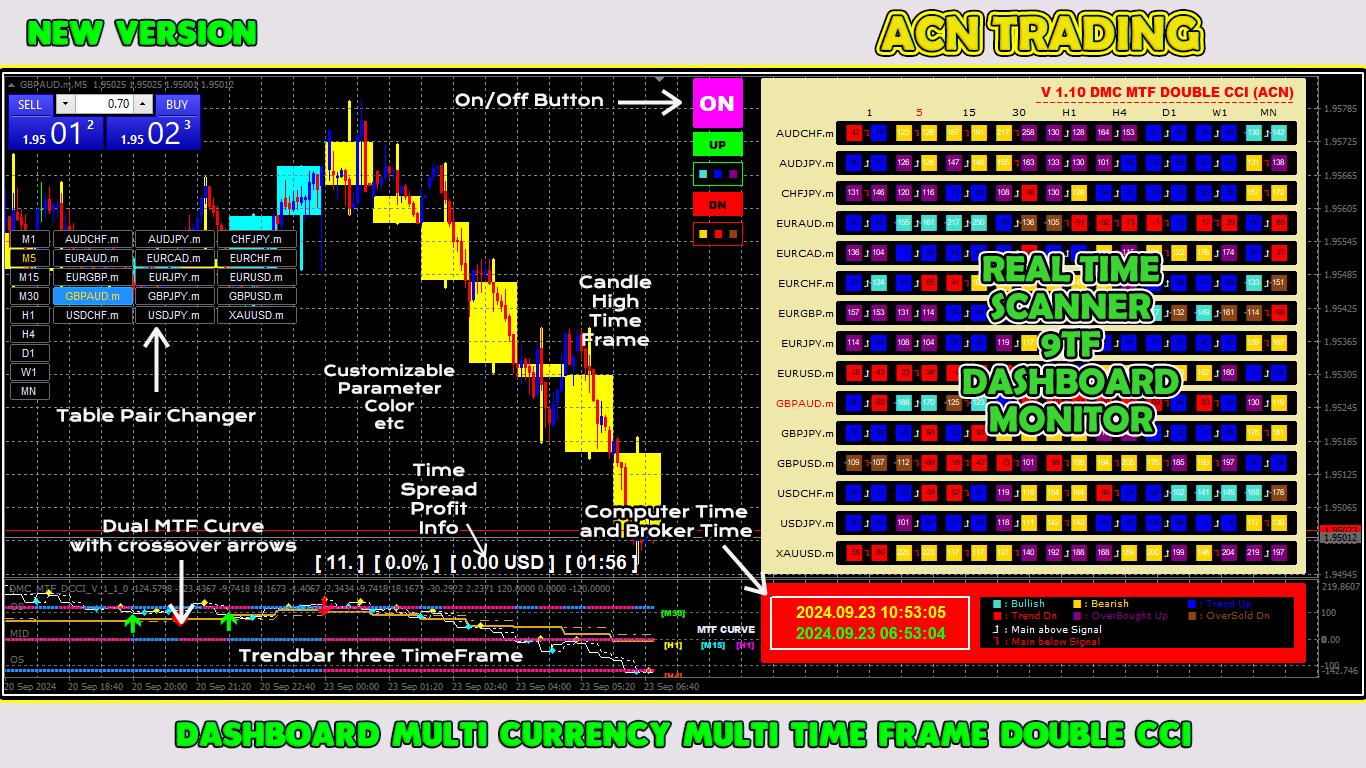
➡️ダッシュボード マルチ通貨 マルチタイムフレーム ダブルCCI。
この取引ツールを作成した理由は少なくとも2つあります。
まず、1つの市場だけを観察することに飽き飽きしています。
次に、別の市場でのエントリーの瞬間を失いたくないのです。
そのため、同時に他の市場の状況を知りたいのです。
このため、複数の市場の状況を同時にスキャンできるスキャナーが必要です。
私は、高速CCIライン> (または<=) 低速CCIラインがM1からH4 (またはM1からM30のみ) から始まる市場をよく探します。
私の分析に同意するなら、これはあなたが探していた取引インジケーターです。
市場の状況が上記の要件を満たす瞬間を逃さないでください。
これは、多くの優れた機能を備えたストキャスティクスのスキャナーまたはダッシュボードです。
高速 CCI ラインのデータを表示できます
低速 CCI ラインのデータを表示できます
高速 CCI ラインと低速 CCI ラインの位置を表示できます (高速ラインが低速ラインの上にあるか、高速ラインが低速ラインの下にあるか)
高速 CCI ラインと低速 CCI ラインの両方のデータ レベルを表示できます (強気、弱気、上昇傾向、下降傾向、買われ過ぎだがまだ上昇、売られ過ぎだがまだ下降)
M1 から MN1 までのリアルタイム データを表示できます
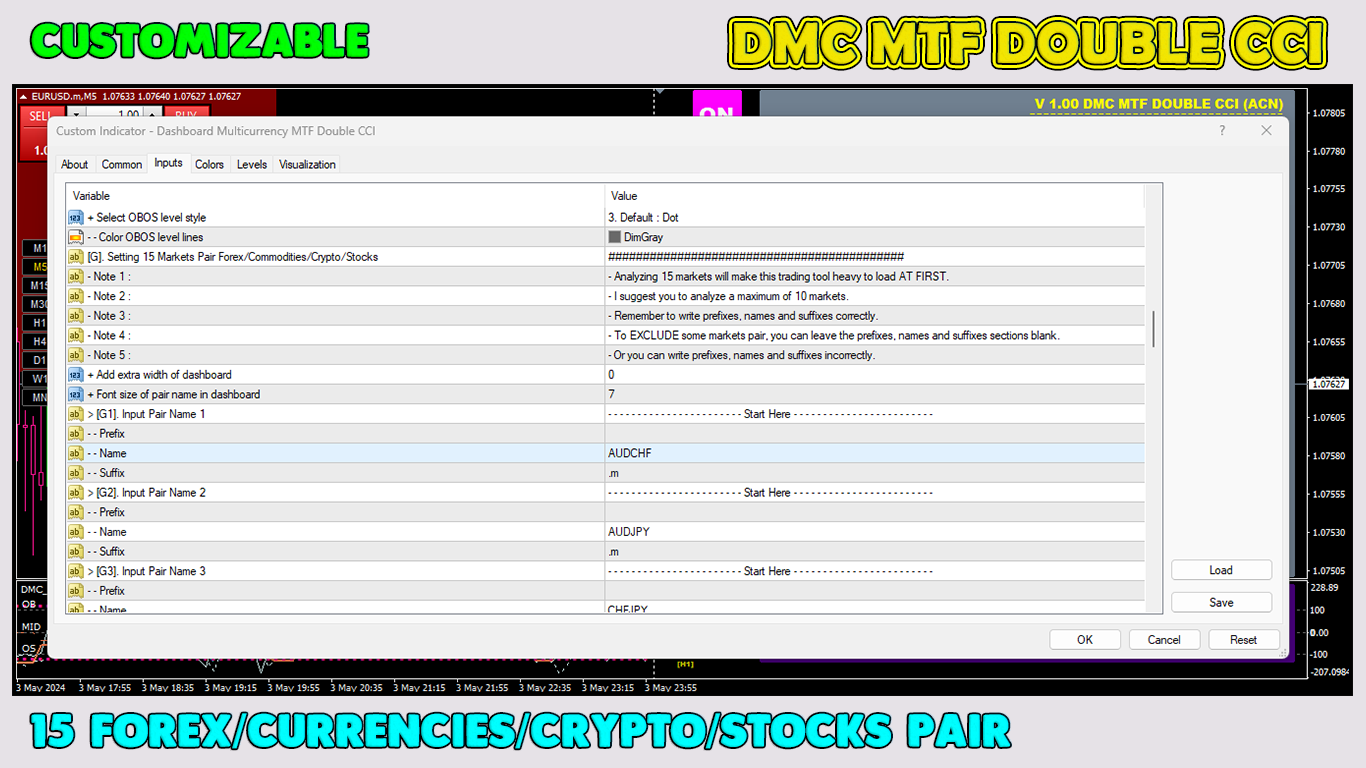
15 通貨ペアのデータを表示できます (マルチ通貨の外国為替/商品/暗号通貨/株式)
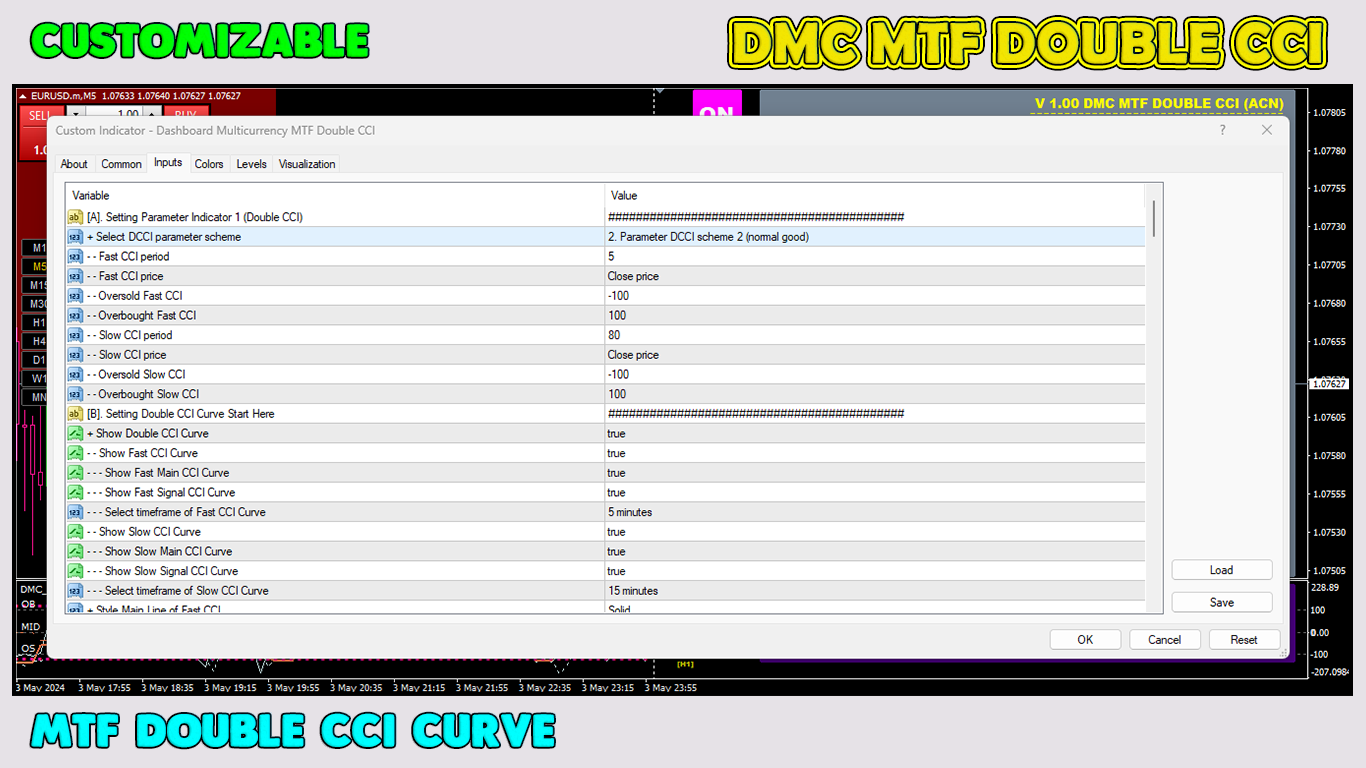
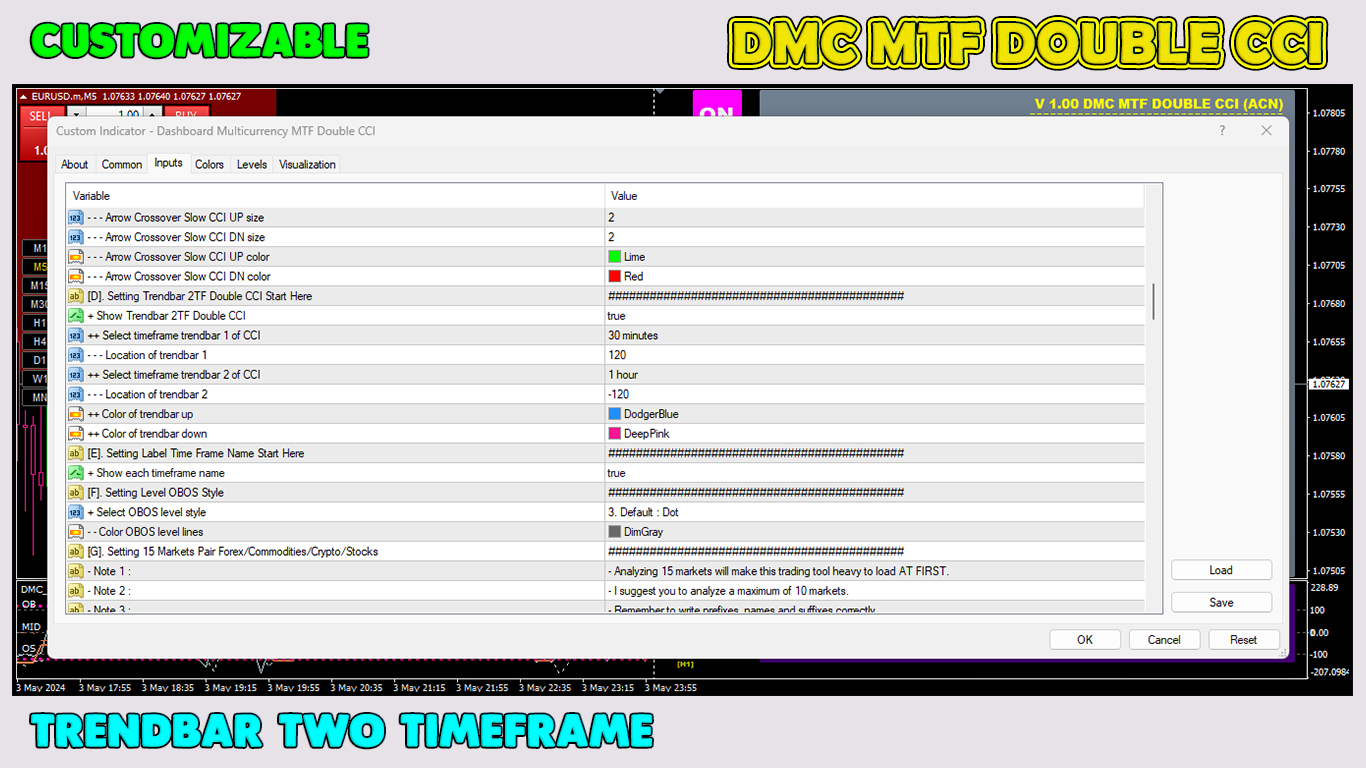
カスタマイズ可能なパラメーター
カスタマイズ可能な色 OBOS レベル
美しい 20 ダッシュボード カラー スキーム
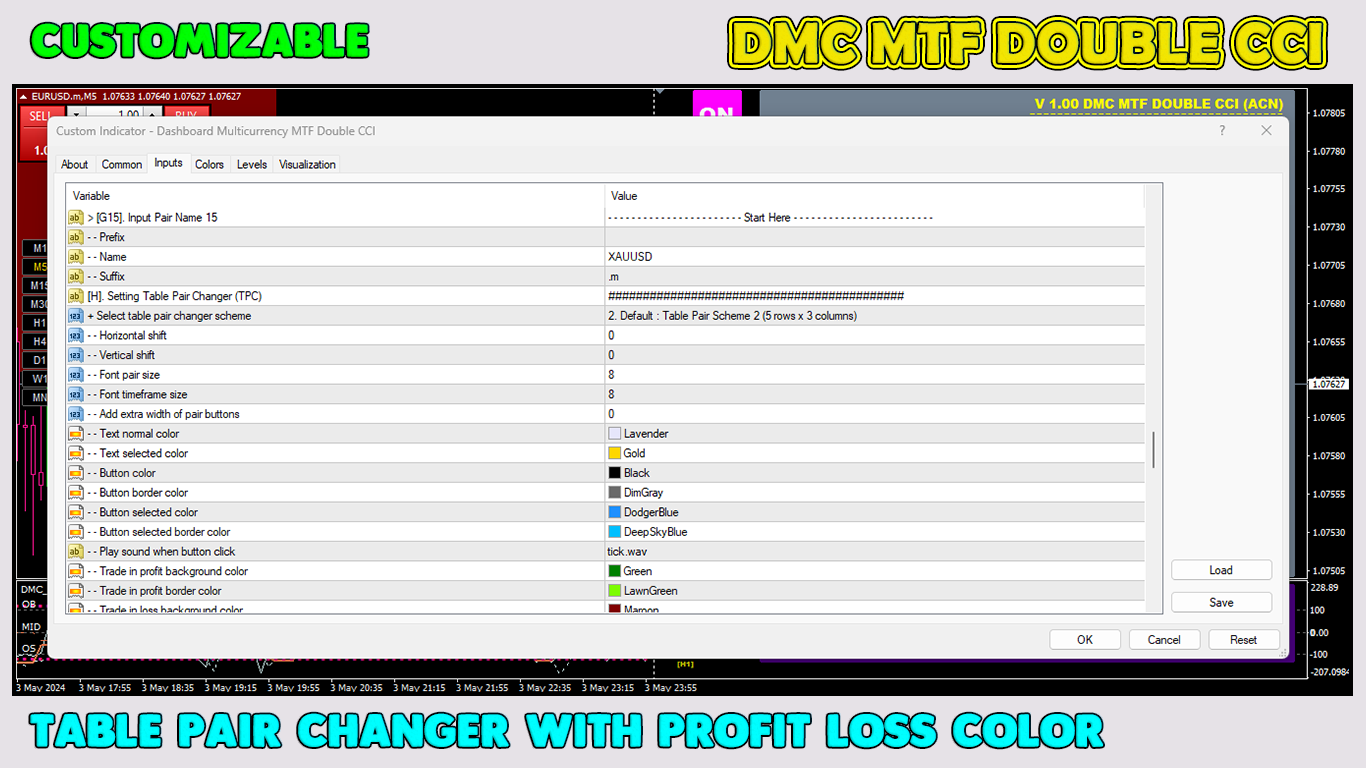
オン/オフの通貨ペア チェンジャーを搭載
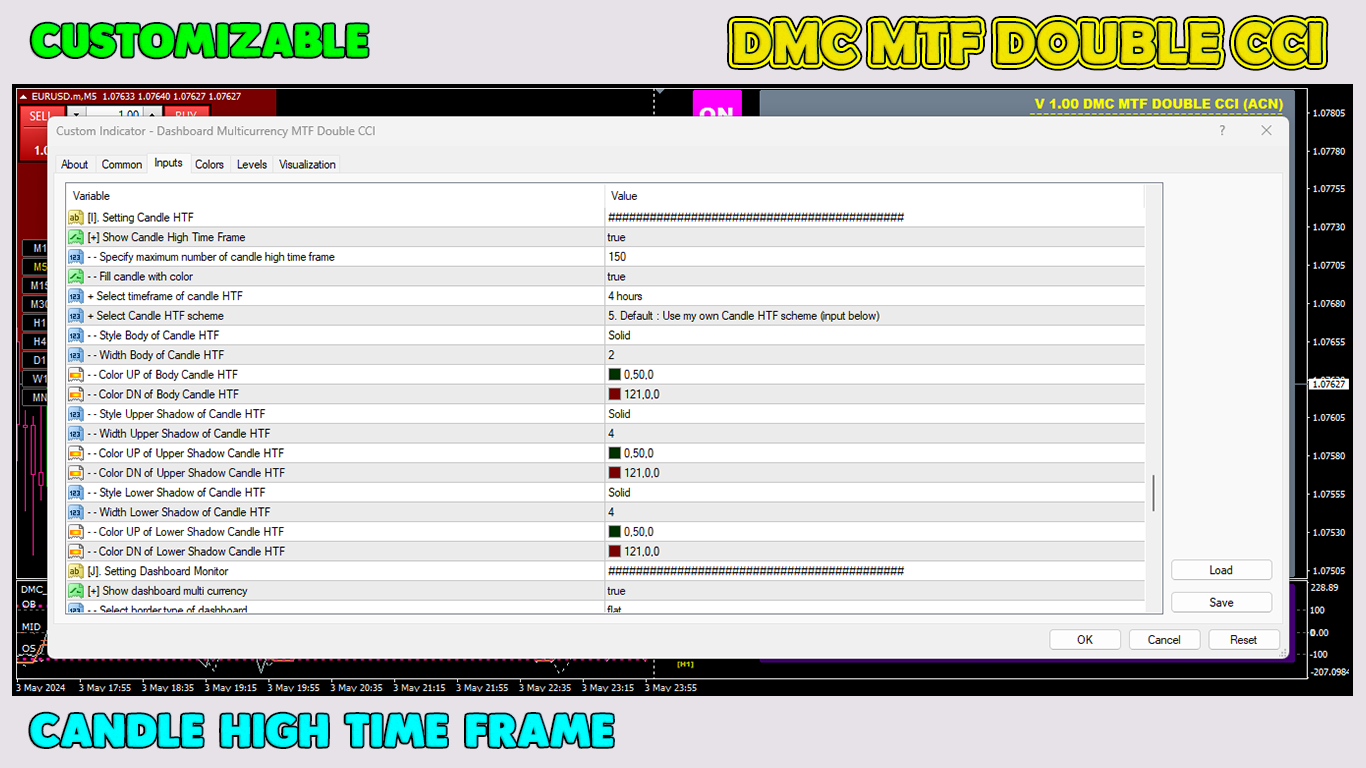
キャンドルの高値時間枠を搭載
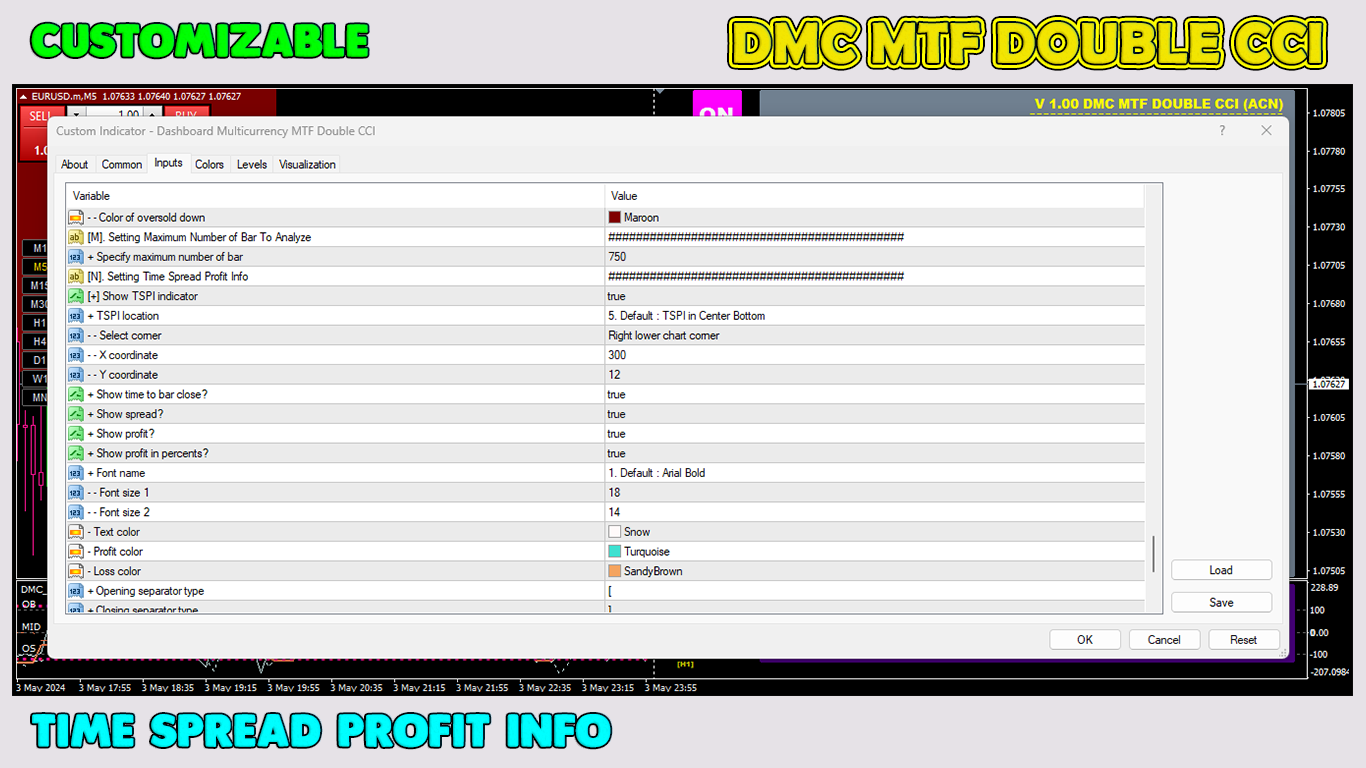
時間差利益情報を搭載
現在のローカル コンピューターの時間とブローカー時間を搭載
MTF ダブル CCI 曲線を搭載
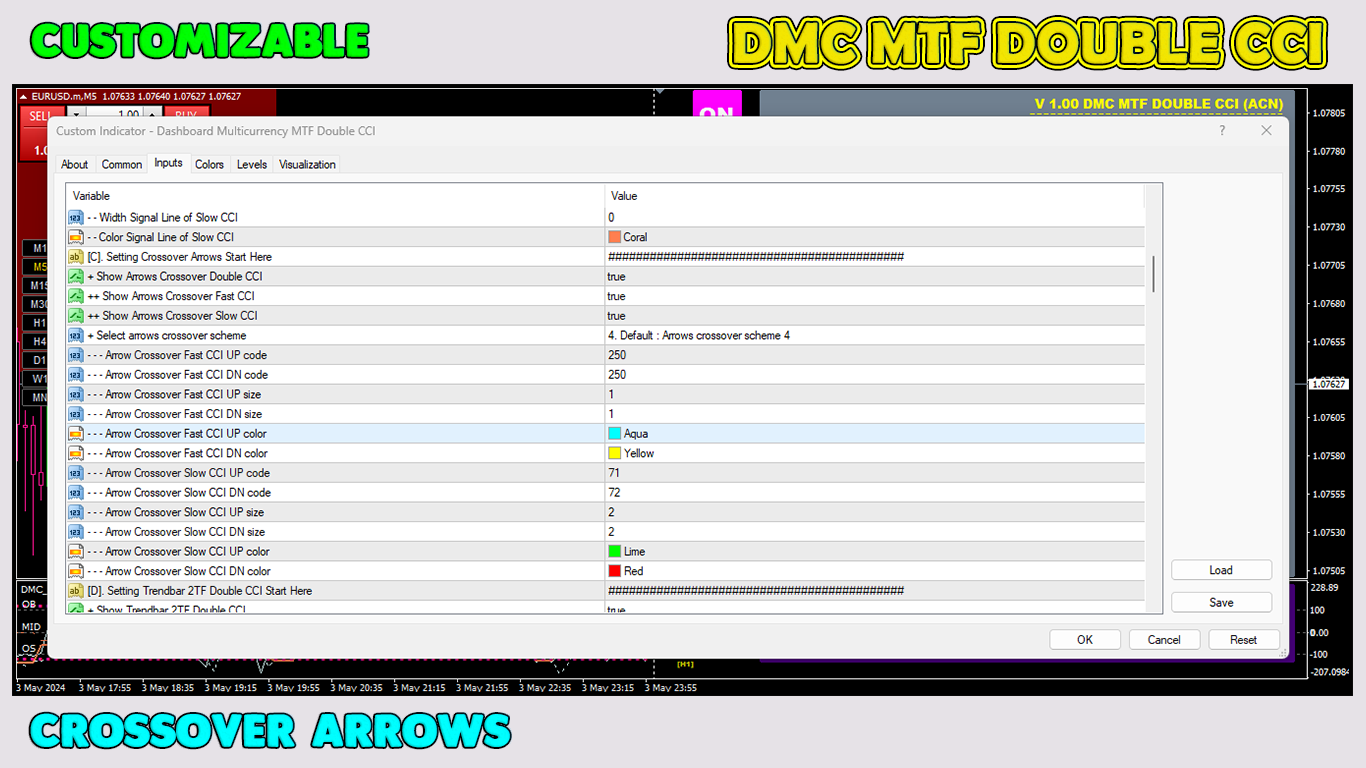
MTF ダブル CCI のクロスオーバー矢印を搭載カーブ
トレンドバー 2TF ダブル CCI 搭載
このトレーディングツールは、すべてのトレーダーが絶対に必要とするものです。
今すぐダウンロードしてください。
自信を持ってエントリーし、プロのようにトレードしましょう!
ありがとうございます。
このプロモーション価格をご利用ください。
さまざまな高度な機能を備えたこのトレーディングツールは、200 ドルで販売されるはずです。
今すぐこのトレーディングインジケーターを購入してください!
#dashboardCCI #multicurrency #multitimeframe #CCItradingstrategy