Double Trend Signals
- インディケータ
- バージョン: 2.0
- アクティベーション: 10
Double Trend Signals (MT4 Indicator)
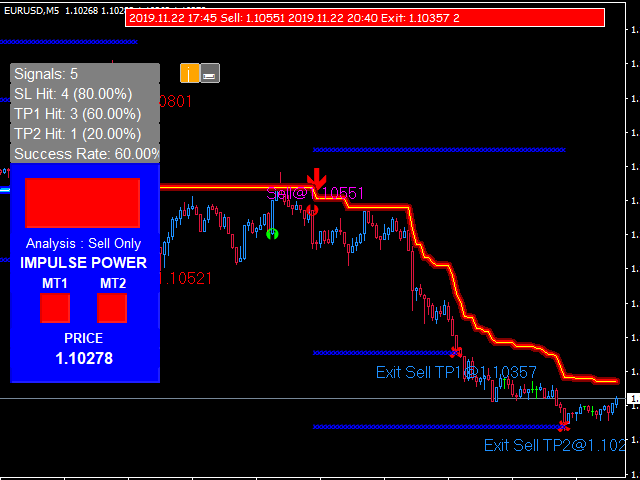
A powerful, non‑repainting trend‑following indicator built to deliver clean, visually intuitive Buy signals powered by smart filtering and dual‑trend confirmation layers.
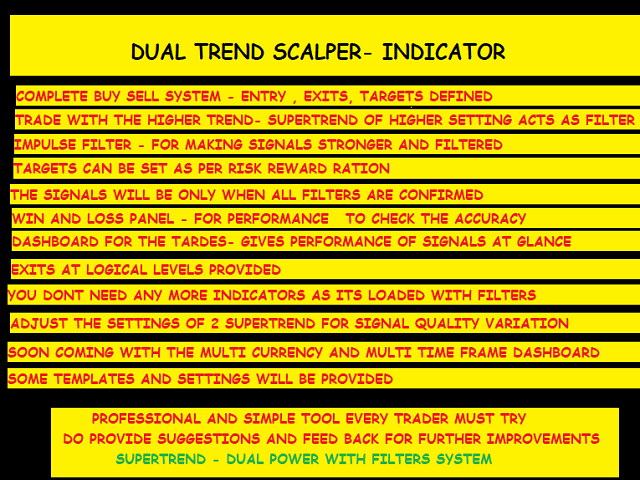
The Double Trend Signals indicator simplifies trend trading by combining a unique impulse‑based trend filter with two SuperTrend confirmation layers.
This multi‑filter design strengthens signal quality, filters out market noise, and gives traders confidently confirmed Buy opportunities.
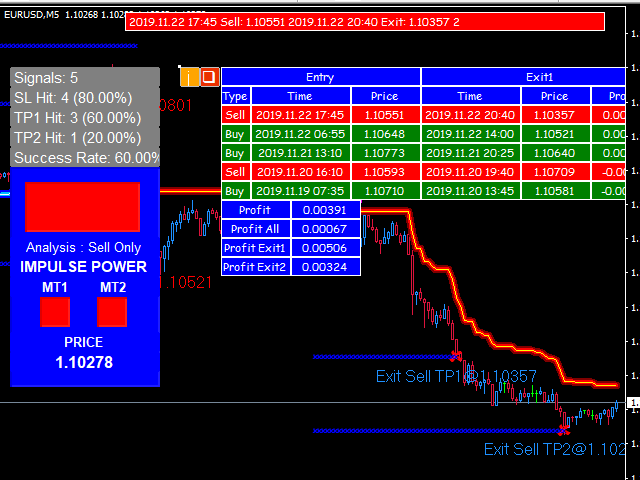
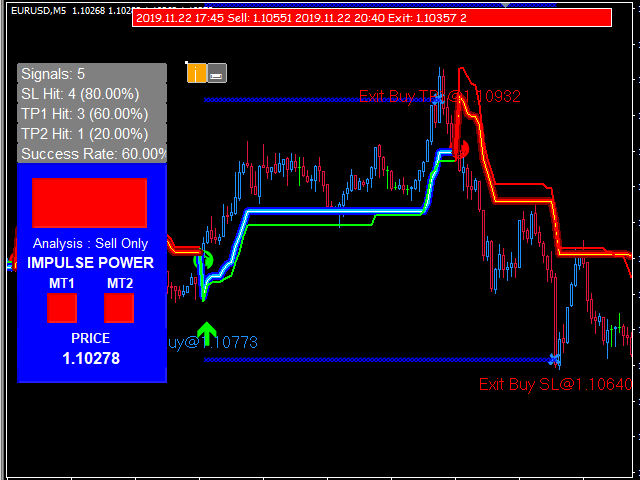
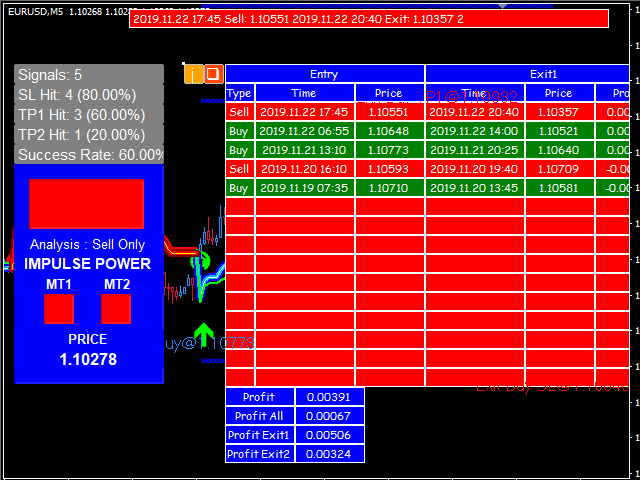
Every signal is strictly generated on bar close (Shift = 1), ensuring permanent, reliable, non‑repainting entries. With customizable stats, precise Take Profit/Exit levels, and universal market compatibility, this tool provides everything needed for disciplined trend trading.
Why Traders Love Double Trend Signals
• Non‑Repainting Accuracy: Every signal is permanent — no repainting, backpainting, or recalculation.
• Visual Trend Clarity: The impulse color panel shows immediate trend direction and strength.
• Two SuperTrend Filters: Strong dual‑layer confirmation reduces false signals and market noise.
• Enhanced Strategy Precision: Built‑in statistics calculate optimized entry levels, TP zones, and exit signals.
• Universal Compatibility: Works on all symbols — forex, gold, indices, crypto — and all timeframes.
• Full Alert System: Get pop-ups, sounds, email alerts, and push notifications instantly.
Key Indicator Features
• Platform: MetaTrader 4 (MT4)
• Primary Purpose: Buy‑side trend‑following signal generation
• Trend Visualization:
– Impulse color panel to display trend direction
– Dual SuperTrend filters for multi‑layer validation
• Non‑Repainting Engine:
– Signals appear only at candle close (Shift = 1)
– Guaranteed no repainting or reshaping
• Built‑In Statistics:
– Recommended entry price
– Take Profit calculations
– Exit signal logic
• Adjustable Inputs:
– Entry parameter settings
– TP & exit configurations
– SuperTrend behavior
• Works on All Markets & Timeframes:
– M1 to MN1
– Forex, metals, indices, crypto, stocks
• Alert System:
– Pop‑up alerts
– Email notifications
– Push notifications (mobile)
– Sound alerts
• Current Version: 2.0 (Published December 20, 2020)
Why Choose Double Trend Signals?
This indicator is perfect for traders seeking a clean, dependable, visually clear trend‑following system.
Its combination of impulse filtering, dual SuperTrend confirmation, and non‑repainting precision makes it highly effective for improving entry quality and boosting profitability.
If you want Buy signals that are simple, reliable, and fully confirmed — this tool delivers exactly that.
Master Trend Trading with Confidence. Get the Double Trend Signals Indicator Today!