Dashboard 9TF Double RSI Double MA Angle Button
- インディケータ
- バージョン: 1.0
- アクティベーション: 15

1 つのウィンドウで通貨ペアの複数の時間枠を分析すると、混乱する可能性があります。
複数の時間枠を分析するには、信頼できるインジケーターが必要です。
そのうちの1つが9TF Double RSI Double MAを使用しています。
シンプルでありながら信頼性が高く、1 つのインジケーターで 9 つの時間枠すべてをカバーするコードを作成するために、昼夜を問わず取り組んできました。
このインジケーターの利点のいくつかを見てみましょう。
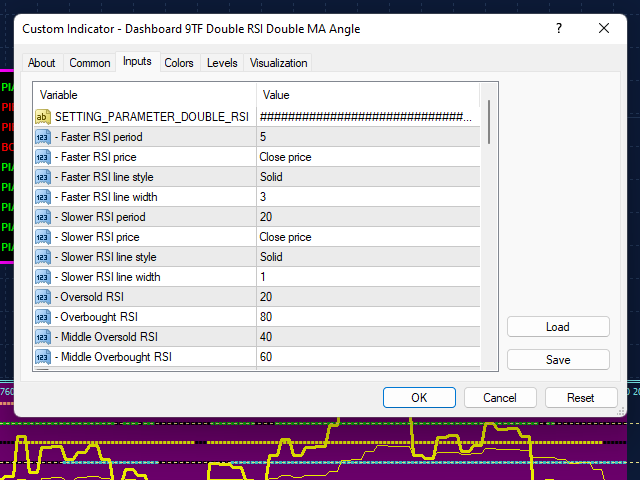
RSI を 2 倍にします。つまり、RSI が速く、RSI が遅くなります。
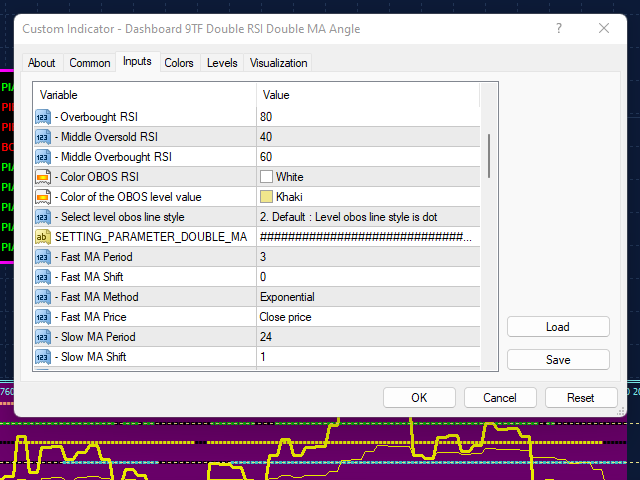
MA を 2 倍にします。つまり、MA が速くなり、MA が遅くなります。
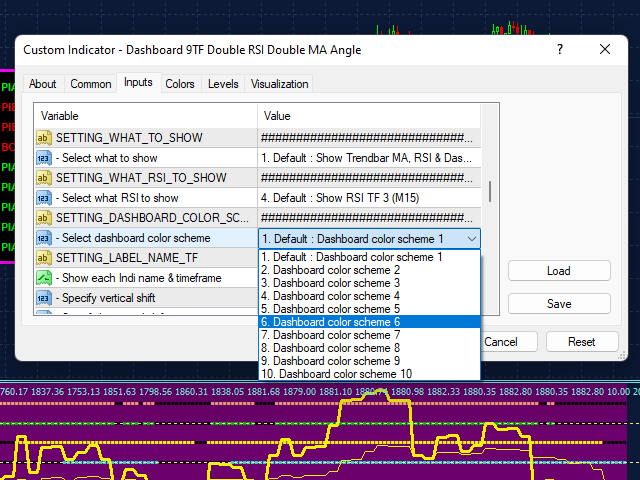
10配色。
各時間枠の曲線の色は互いに異なります。
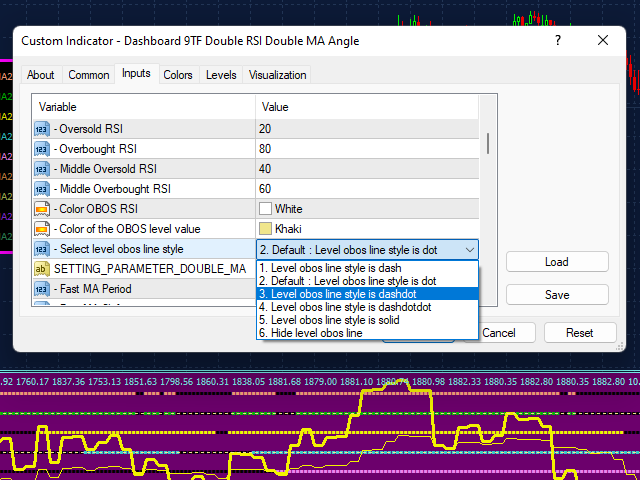
RSIのOBOSレベルライン。
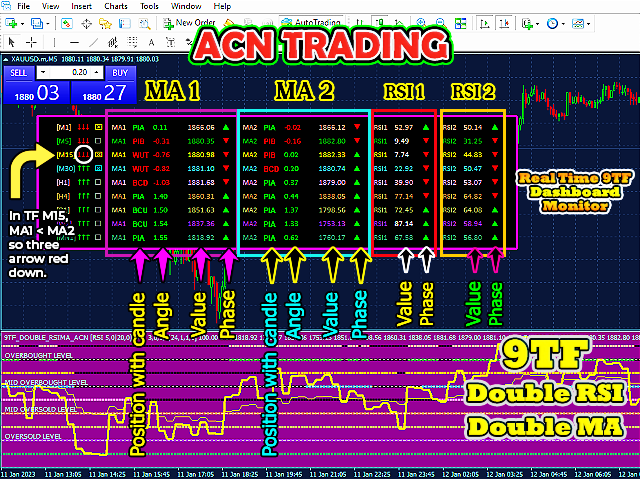
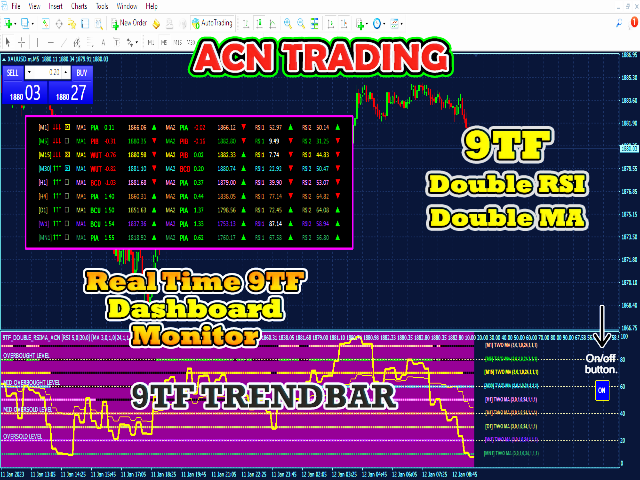
リアルタイム 9TF ダッシュボード モニター。
ある時間枠から別の時間枠に変更しても、9TF ダッシュボード モニターの計算は非常に正確です。
どの RSI 曲線が買われ過ぎのレベルを上回っており、どの RSI 曲線が売られ過ぎのレベルを下回っているかを監視します。
MA ファスト ラインが MA スロー ラインを上回っているかどうか、またはその逆かどうかを曲線で監視します。
MA ファスト ラインと MA スロー ラインの間に交差があるかどうか、曲線を監視します。
前の信号で現在の信号の動きを監視します。 上昇中または下降中。 (注: これはスキャルピングにとって非常に重要な機能です!)
長期的なトレンドを見つけるための非常に重要なトレンド バー機能です。
色を変える能力。
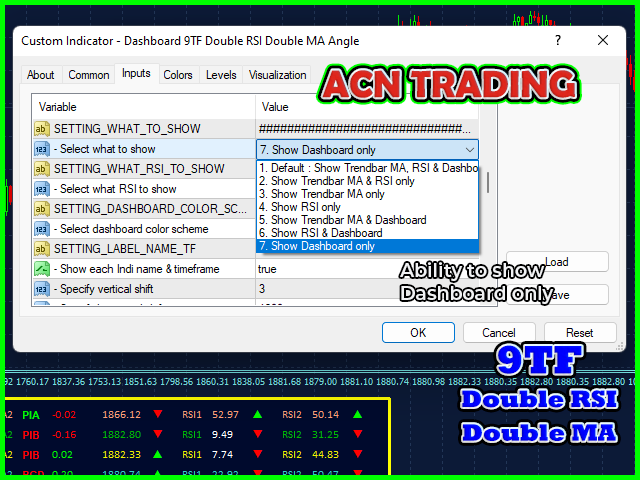
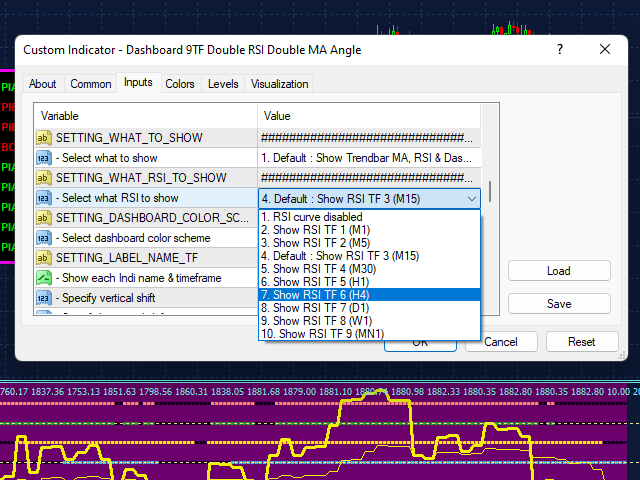
表示する曲線を選択する機能。
RSI のみ、MA のみ、ダッシュボードのみなどを表示する機能。
9TF ダッシュボード モニターを希望の場所に配置する機能。
ボタンを 1 回クリックするだけでインジケーターを表示または非表示にする機能。
高い時間枠から短い時間枠までの価格行動の動きを監視する機能。
外国為替、指数、金属/エネルギー、株式、暗号通貨の分析に使用できます。
Q1. 現在の RSI ラインが前の RSI ラインより大きいかどうか、またはその逆かどうかを知る方法は?
A1. RSI フェーズ (三角形の形で表現) を見てください。 現在の RSI ライン > 前の RSI ラインの場合、フェーズは上向きの三角形の形で、ライム色です。 反対側は下向き三角形で赤です。
Q2. 現在の MA ラインが前の MA ラインよりも大きいかどうか、またはその逆かどうかを知る方法は?
A2. MAフェーズ(三角形の形で表現)を見てください。 現在の MA ライン > 前の MA ラインの場合、フェーズは上向きの三角形の形で、ライム色です。 反対側は下向き三角形で赤です。
Q3. 現在の MA の速い線が現在の MA の遅い線よりも大きいかどうか、またはその逆かどうかを知るにはどうすればよいですか?
A3. 3 つの矢印を見てください。 現在の移動平均の速い線 > 現在の移動平均の遅い線の場合、3 つの矢印は上向きで、ライム色です。 反対側は下向きで赤です。
私の YouTube チャンネルで全編を見ることができます。 隠すことは何もない。
この指標を作成する私の意図は、あなたの勝利と利益を増やすことです.
最高の Double RSI Double MA 取引指標で自信を持ってエントリーしましょう。
今すぐプロのように取引しましょう。
ありがとう。