パブリッシュされたプロダクト

インジケーターを 1 つしか使用しないためにトレードで頻繁に負ける場合は、この取引ツールを試してください。 この取引ツールは複数のインジケーターを使用します。 私はRSIインジケーターのみを使用するトレーダーをよく観察します。 市場は売られすぎているのにまだ下落している、または市場は買われすぎているのにまだ上昇していることがよくあります。 このため、複数のインジケーターを使用する必要があります。 新しいバージョン V 3.40 MTF PPAAF の紹介: マルチ タイム フレームの正確なプライス アクション矢印フィルター。 この取引ツールは、市場の動きの方向性を強化するためにさまざまな指標を使用します。
この取引ツールで使用される最初の指標はデュアル ストキャスティクスです。 ここでは、ファスト ストキャスティクスとスロー ストキャスティクスという 2 つのストキャスティクスを使用します。 ファストストキャスティクスには、ファストストキャスティクスメインラインとファストストキャスティクスシグナルラインがあります。 同様に、スロー ストキャスティックには、スロー ストキャスティック
Looking for a trading tool based on the RSI indicator that can display crossovers arrows on all time frames? Introducing trading indicator : All Time Frame Double RSI Model S ready to help you achieve daily profits. This tool is created using the intersection of two RSI (Double RSI) indicator lines: the main RSI and the signal RSI. Using this tool makes it easier to observe the real-time dashboard and intersections of multiple timeframes simultaneously. Viewing both higher and lower timeframes
Looking for a trading tool based on the RSI indicator that can display crossovers arrows on all time frames? Introducing trading indicator : All Time Frame Double RSI Model T ready to help you achieve daily profits. This tool is created using the intersection of two RSI (Double RSI) indicator lines: the main RSI and the signal RSI. Using this tool makes it easier to observe the real-time dashboard and intersections of multiple timeframes simultaneously. Viewing both higher and lower timeframes

Looking for a trading tool based on the Stochastic indicator that can display crossovers arrows on all time frames? Introducing trading indicator : All Time Frame Stochastic Model S ready to help you achieve daily profits. This tool is created using the intersection of two indicator lines of Stochastic : the main Stochastic and the signal Stochastic . Using this tool makes it easier to observe the real-time dashboard and intersections of multiple timeframes simultaneously. Viewing both higher

Looking for a trading tool based on the Stochastic indicator that can display crossovers arrows on all time frames? Introducing trading indicator : All Time Frame Stochastic Model T ready to help you achieve daily profits. This tool is created using the intersection of two indicator lines of Stochastic : the main Stochastic and the signal Stochastic . Using this tool makes it easier to observe the real-time dashboard and intersections of multiple timeframes simultaneously. Viewing both higher
Looking for a trading tool based on the MACD indicator that can display crossovers arrows on all time frames? Introducing trading indicator : All Time Frame MACD Model S ready to help you achieve daily profits. This tool is created using the intersection of two indicator lines of MACD : the main MACD and the signal MACD. Using this tool makes it easier to observe the real-time dashboard and intersections of multiple timeframes simultaneously. Viewing both higher and lower timeframes simultaneou

Looking for a trading tool based on the MACD indicator that can display crossovers arrows on all time frames? Introducing trading indicator : All Time Frame MACD Model T ready to help you achieve daily profits. This tool is created using the intersection of two indicator lines of MACD : the main MACD and the signal MACD. Using this tool makes it easier to observe the real-time dashboard and intersections of multiple timeframes simultaneously. Viewing both higher and lower timeframes simultaneou
Looking for a trading tool based on the CCI indicator that can display crossovers arrows on all time frames? Introducing trading indicator : All Time Frame Double CCI Model S ready to help you achieve daily profits. This tool is created using the intersection of two CCI (Double CCI) indicator lines: the main CCI and the signal CCI. Using this tool makes it easier to observe the real-time dashboard and intersections of multiple timeframes simultaneously. Viewing both higher and lower timeframes
Looking for a trading tool based on the CCI indicator that can display crossovers arrows on all time frames? Introducing trading indicator : All Time Frame Double CCI Model T ready to help you achieve daily profits. This tool is created using the intersection of two CCI (Double CCI) indicator lines: the main CCI and the signal CCI. Using this tool makes it easier to observe the real-time dashboard and intersections of multiple timeframes simultaneously. Viewing both higher and lower timeframes
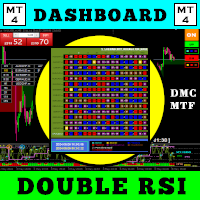
この取引ツールを使用すると、15 の市場を同時にスキャンできます。
新しい取引指標 2024 のご紹介:
️ ダッシュボードのマルチ通貨マルチタイムフレームダブルRSI。
私がこの取引ツールを作成した理由は少なくとも 2 つあります。
まず、1 つの市場だけを観察することに飽きました。 次に、別の市場への参入の瞬間を逃したくないです。
だからこそ、他の市況も同時に知りたいのです。
このため、複数の市場の状況を同時にスキャンできるスキャナーが必要です。
私は、高速 RSI ライン > (または <=) 低速 RSI ラインが M1 から H4 (または単に M1 から M30) で始まる市場をよく探します。
また、M1 から M30 まで売られすぎ/買われすぎの市場をよく探します。
私の分析に同意するなら、これがあなたが探していた取引指標です。
市況が上記の要件を満たす瞬間を見逃さないでください。
これは、多くの優れた機能を備えたストキャスティックのスキャナーまたはダッシュボードです。
高速RSIラインのデータを表示可能 遅いRSIラインのデータも表示可能 高
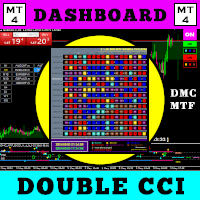
この取引ツールを使用すると、15の市場を同時にスキャンできます。
新しい取引インジケーター2024のご紹介:
️ダッシュボード マルチ通貨 マルチタイムフレーム ダブルCCI。
この取引ツールを作成した理由は少なくとも2つあります。
まず、1つの市場だけを観察することに飽き飽きしています。
次に、別の市場でのエントリーの瞬間を失いたくないのです。
そのため、同時に他の市場の状況を知りたいのです。
このため、複数の市場の状況を同時にスキャンできるスキャナーが必要です。
私は、高速CCIライン> (または<=) 低速CCIラインがM1からH4 (またはM1からM30のみ) から始まる市場をよく探します。
私の分析に同意するなら、これはあなたが探していた取引インジケーターです。
市場の状況が上記の要件を満たす瞬間を逃さないでください。
これは、多くの優れた機能を備えたストキャスティクスのスキャナーまたはダッシュボードです。
高速 CCI ラインのデータを表示できます 低速 CCI ラインのデータを表示できます 高速 CCI ラインと低速 CCI ラインの位置を表示

この取引ツールを使用すると、15 の市場を同時にスキャンできます。
新しい取引指標 2024 のご紹介:
️ ダッシュボード マルチ通貨 マルチタイムフレーム 確率的。
私がこの取引ツールを作成した理由は少なくとも 2 つあります。
まず、1 つの市場だけを観察することに飽きました。 次に、別の市場への参入の瞬間を逃したくないです。
だからこそ、他の市況も同時に知りたいのです。
このため、複数の市場の状況を同時にスキャンできるスキャナーが必要です。
私は確率的メインライン > (または <=) 確率的シグナルラインが M1 から H4 (または単に M1 から M30) で始まる市場をよく探します。
私の分析に同意するなら、これがあなたが探していた取引指標です。
市況が上記の要件を満たす瞬間を見逃さないでください。
これは、多くの優れた機能を備えたストキャスティックのスキャナーまたはダッシュボードです。
確率的メインラインのデータを表示可能 確率シグナルラインのデータを表示可能 確率的メインラインとシグナルラインの位置を表示可能(シグナルラインの上のメインライ

トレーダーの皆様、こんにちは。
私の最高の取引ツールを紹介します。
機動部隊 PPAAF モデル T.
マルチタイムフレーム 正確なプライスアクションアローフィルタリングされたモデル T。
この取引ツールは、長年さまざまな取引ツールを作成してきた私の最高傑作です。
なぜこの取引ツールが最高で信頼できるのでしょうか?
1. このツールは 6 つのインジケーターを使用します。
ダブル CCI = 高速 CCI x 低速 CCI デュアル ストキャスティクス = 高速ストキャスティクス (高速ストキャスティクス メイン ライン x 高速ストキャスティクス シグナル ライン) & スロー ストキャスティクス (低速ストキャスティクス メイン ライン x 低速ストキャスティクス シグナル ライン) デュアルMACD = 高速MACD (高速MACDメインライン x 高速MACDシグナルライン) & スローMACD (低速MACDメインライン x 低速MACDシグナルライン) 6 つの移動平均 = MA 1 x MA 2 、MA 3 x MA 4 および
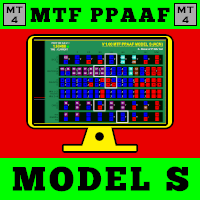
Introducing the advanced trading tools of 2023. MTF PPAAF Model S. This is sub window version of my best trading tool : MTF Precise Price Action Arrow Filtered. Click here to learn more about MTF PPAAF . This trading tool is equipped with various powerful features : MTF = Multi Time Frame = Time Frame can be changed. On/off button. Non Repaint Arrows. Customizable parameter, color etc. Can show all time frame (ATF) crossover arrows of fast stochastic main line & fast stochastic signal line (
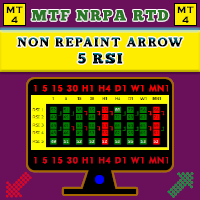
【V1.00】MTF NRPA 5 RSI RTDがリリースされました!
非再描画矢印リアルタイム ダッシュボード。
さまざまな RSI インジケーターを使用するのにうんざりしていて、それらが不正確であると感じた場合は、このツールを試してください。 通常、時間枠内の OBOS レベルを決定するために RSI を 1 つだけインストールします。 悪いニュースは、さまざまな時間枠の OBOS レベルと傾向を一度に確認できないことです。 それが私がこの取引ツールを開発した理由です。
それは次のように説明されています。
この取引ツールでは、5 つの RSI を使用します。 はい、5つです! デフォルトでは、RSI 1 と RSI 2 を大きな時間枠、つまり M30 に設定します。 RSI 1 と RSI 2 の交差は、M30 タイムフレームでトレンドの変化があることを意味します。 次に、現在の(小さい)時間枠に RSI 3 と RSI 4 を設定します。たとえば、M5 でチャートを開いたとします。 RSI 3 と RSI 4 の交差点は、現在のタイムフレーム (M5) でトレンドの変
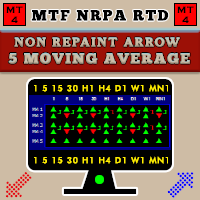
【V 1.00】MTF NRPA 5 移動平均RTDがリリースされました!
非再描画矢印リアルタイム ダッシュボード。
最適な移動平均インジケーターをお探しなら、ここが正しいページです。 一般に、2 つの移動平均の交点 (クロスオーバー) が次の価格トレンドの方向を決定するため、2 つの移動平均を設定します。 高速移動平均が低速移動平均と交差し、高速 > 低速の場合、トレンドは上昇しています。 逆に、速い移動平均が遅い移動平均と交差し、速い < 遅い場合、トレンドは下降しています。 2 つの移動平均の欠点は、長期的な傾向が見えないことです。 それが私がこの取引ツールを開発した理由です。
それは次のように説明されています。
この取引ツールでは、5 つの移動平均を使用します。 はい、5つです! デフォルトでは、MA 1 と MA 2 を大きな時間枠 (H1) に設定します。 MA 1 と MA 2 の交差は、上半期の時間枠でトレンドの変化があることを意味します。 次に、現在の時間枠(小さい)に MA 3 と MA 4 を設定します。たとえば、M5 でチャートを開きます。 MA 3
Looking for a trading tool based on the moving average indicator that can display crossovers arrows on all time frames? Introducing trading indicator : All Time Frame Two MA Model T ready to help you achieve daily profits. This tool is created using the intersection of two moving average indicator lines: the main MA1 and the signal MA2. Using this tool makes it easier to observe the real-time dashboard and intersections of multiple timeframes simultaneously. Viewing both higher and lower timef
Looking for a trading tool based on the moving average indicator that can display crossovers arrows on all time frames? Introducing trading indicator : All Time Frame Two MA Model S ready to help you achieve daily profits. This tool is created using the intersection of two moving average indicator lines: the main MA1 and the signal MA2. Using this tool makes it easier to observe the real-time dashboard and intersections of multiple timeframes simultaneously. Viewing both higher and lower timefr