M W Pattern Pro
- インディケータ
- バージョン: 1.6
- アップデート済み: 1 7月 2023
- アクティベーション: 10

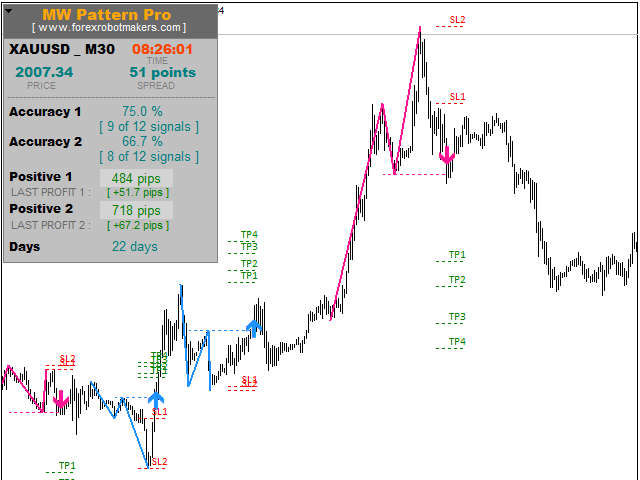
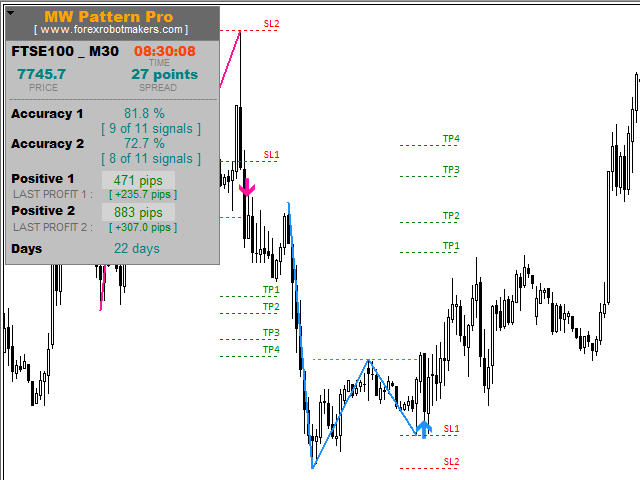
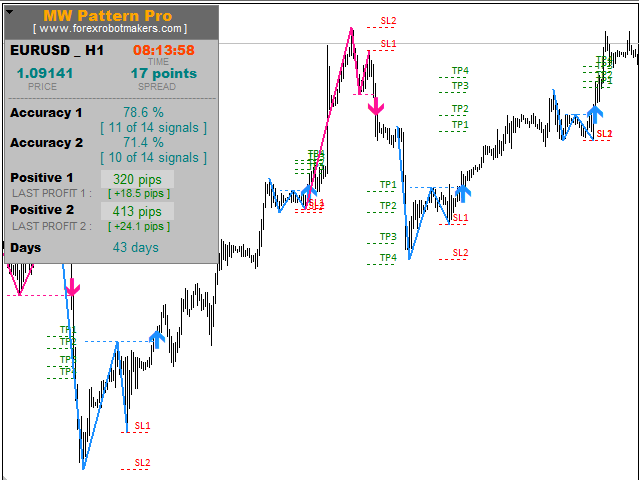
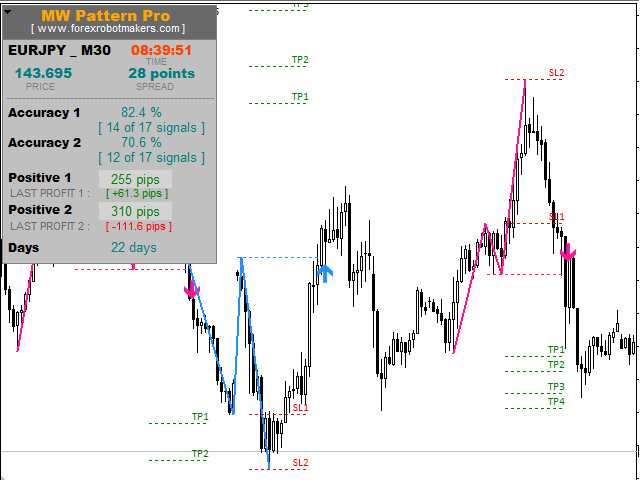
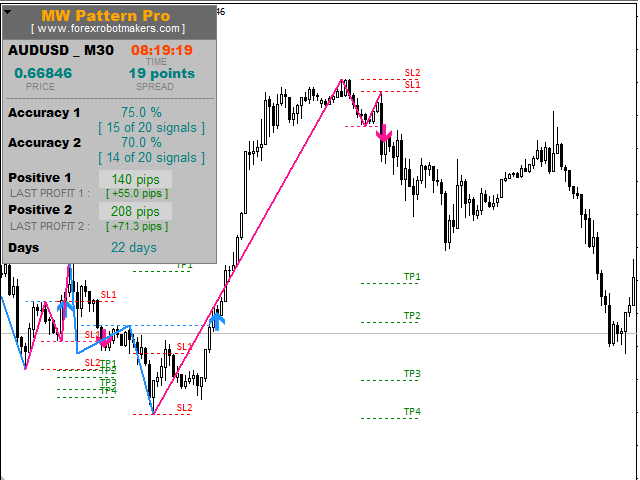
M & W Pattern Pro is an advanced scanner for M and W patters , it uses extra filters to ensure scanned patterns are profitable.
The indicator can be used with all symbols and time frames.
The indicator is a non repaint indicator with accurate statistics calculations.
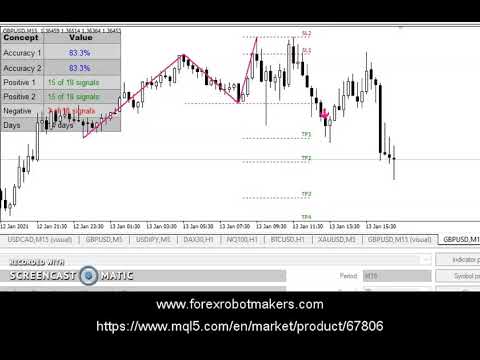
To use , simply scan the most profitable pair using the statistics dashboard accuracy , then enter trades on signal arrow and exit at the TP and SL levels.
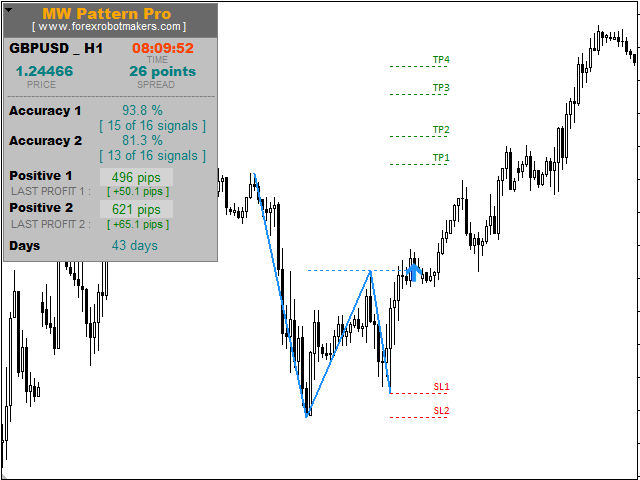
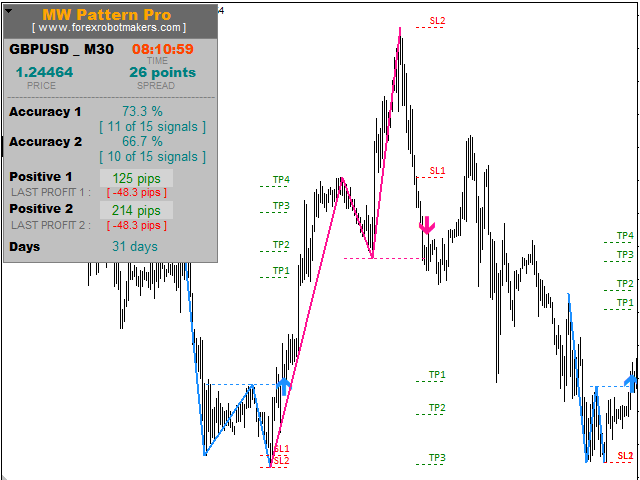
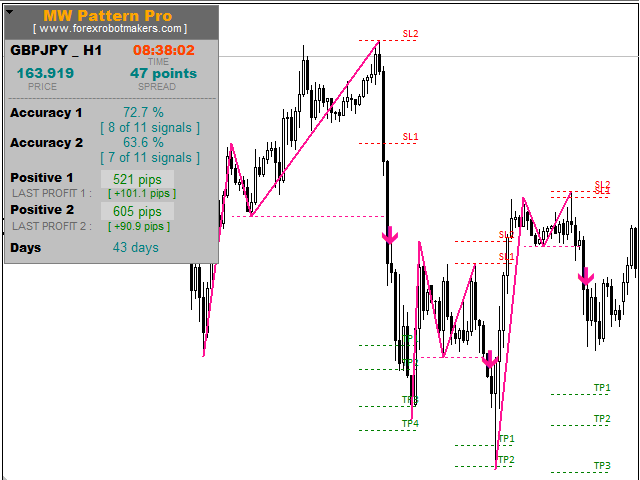
STATISTICS :
Accuracy 1 : This is the percentage of the times price hits TP1 before it hits stop loss.
Accuracy 1= (Total TP1 Hit /Total signals )*100
Accuracy 2 : This is the percentage of the times price hits TP2 before it hits stop loss.
Accuracy 2= (Total TP2 Hit /Total signals )*100
Positive 1 : This is the percentage of the times price hits TP1.
Positive 2 : This is the percentage of the times price hits TP2.
Negative : This is the percentage of the times price hits stop loss (SL 2) .
Days : The number of days scanned in the historical data.
SL 1 vs. SL 2
SL 1 : Sl1 1 is the first stop loss and it is meant for exiting trades after a partial profit has been taken. When you close a trade partially at TP1 or TP2 , then place stop loss at SL 1 to reduce risk.
SL2 : SL2 is the final stop loss for all trades and should serve as the risk factor in every trade.
INPUT MENU SETTINGS
- Pattern History : This is the range of historical bars scanned. This number affects how fast the indicator loads , the larger the number , the slower the indicator loads.
- Pattern Amplitude : This is basically the most important setting for this indicator. It affects both the accuracy and number of daily signals . For a more filtered signal with less noise, this number should be increased . But if you want to see more signals, then the number should be reduced but the more the signals , the more the noise.
YOU CAN NOW DOWNLOAD FREE VERSIONS OF OUR PAID INDICATORS . IT'S OUR WAY OF GIVING BACK TO THE COMMUNITY !


This is an absolutely fantastic indicator – one of the best I have ever seen. The freezing problem has definitely been fixed. The winning percentages are very good on certain pairs. I recommend only using it on the majors. I am currently chatting with the creator to see if this can be the basis of an EA. Sometimes, by the time you enter the trade, much of the move as already happened. Auto entry with an EA will fix that problem. Also, to make the percentages work in your favor, you need to be available to enter every trade. An EA will make that possible.