Advanced Indicator Scanner MT5
- インディケータ
- バージョン: 2.2
- アップデート済み: 13 6月 2026
- アクティベーション: 15

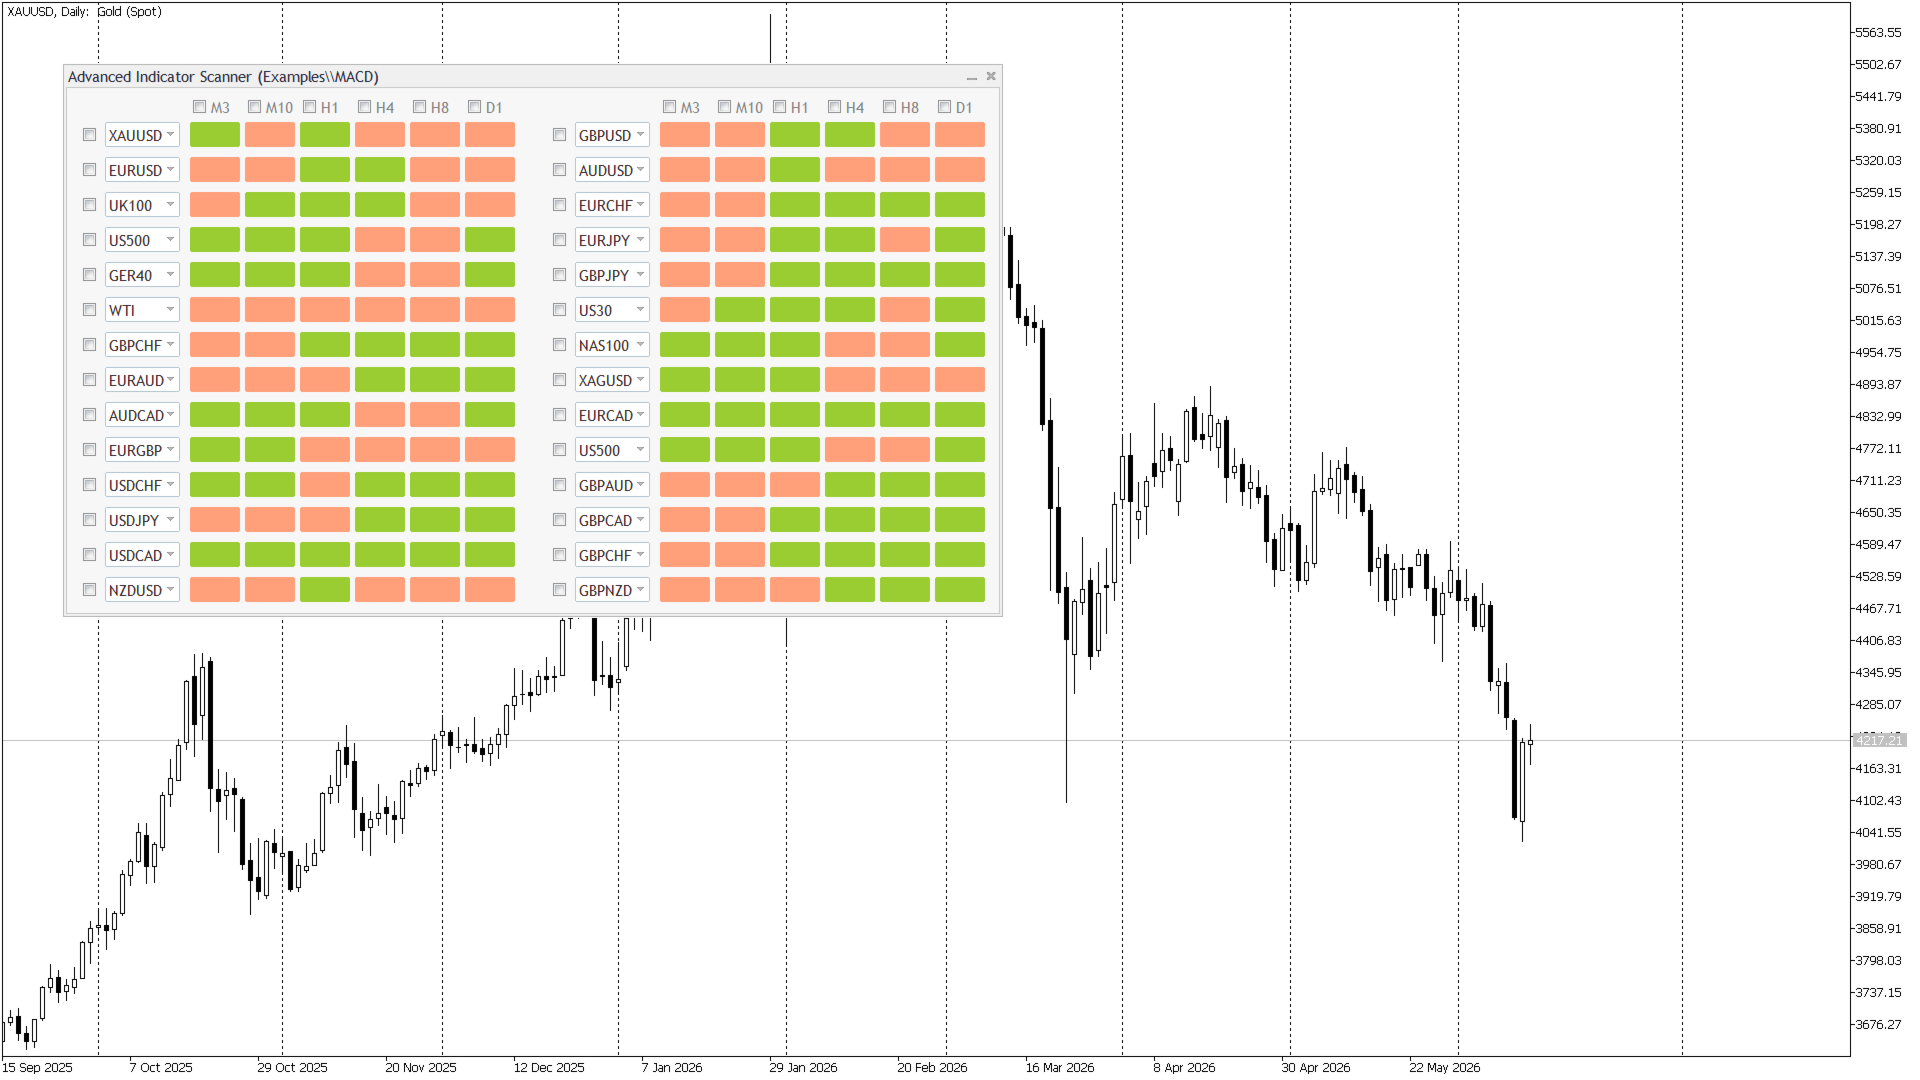
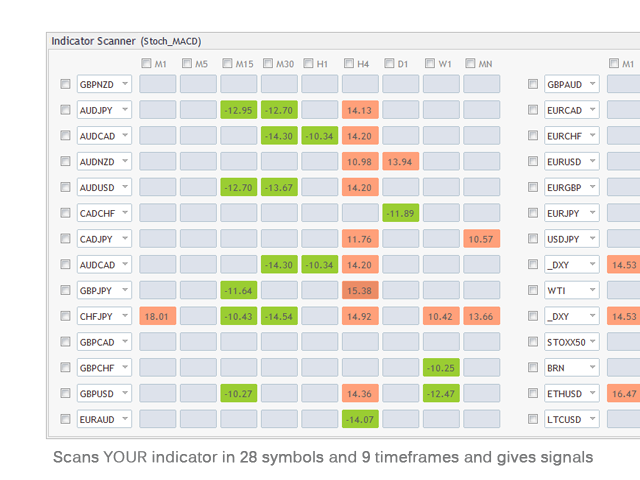
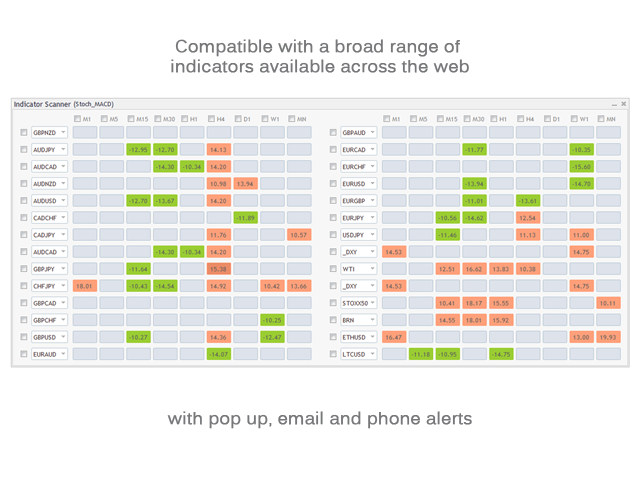
Advanced Indicator Scanner is a multi-symbol multi-timeframe scanner that works with hundreds of custom indicators available across the web including mql5 website market and codebase indicators.
Advanced Indicator Scanner features:
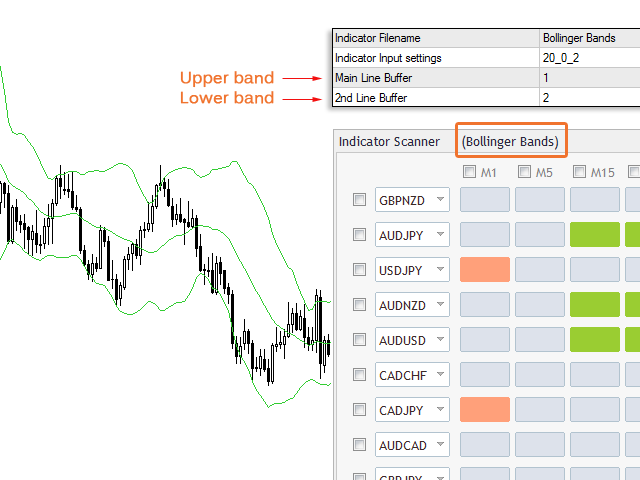
- Scans your indicator in 28 customizable instruments and 9 timeframes.
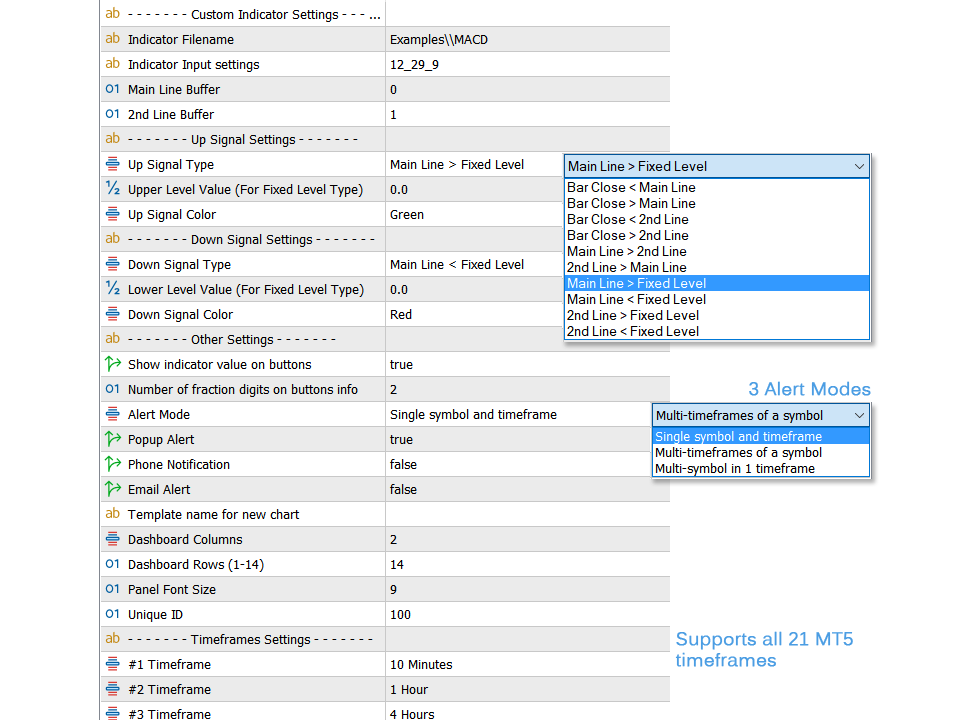
- Monitors up to 2 lines(buffers) of an indicator.
- Showing of indicator value on buttons.
- You can choose between 3 alert modes:
- Single symbol and timeframe
- Multiple timeframes of a symbol
- Multiple symbols for a timeframe
- Support all 21 timeframes of MT5.
- Popup, email, and phone notification alerts for selected symbols and timeframes.
- Quick review of signals in new chart by clicking on signal buttons.
- Easy arrangement of symbols in any order with any instrument.
After the purchase, don't forget to message me to receive a copy of the MT4 full version for 1 trading account as a bonus.
This scanner works with more than 30 Metatrader default indicators, including:
- Moving Average
- Adaptive Moving Average (AMA)
- Average Directional Movement Index (ADX) (Main line)
- Bollinger Bands (upper & lower bands)
- Double Exponential Moving Average (DEMA)
- Triple Exponential Moving Average (TEMA)
- Envelopes
- Average True Range (ATR)
- Parabolic SAR
- Standard Deviation (StdDev)
- Chaikin Oscillator (CHO)
- Variable Index Dynamic Average (VIDYA)
- Commodity Channel Index (CCI)
- DeMarker (DeM)
- Force Index (FRC)
- MACD
- Momentum
- Moving Average of Oscillator (OsMA)
- Relative Strength Index (RSI)
- Relative Vigor Index (RVI)
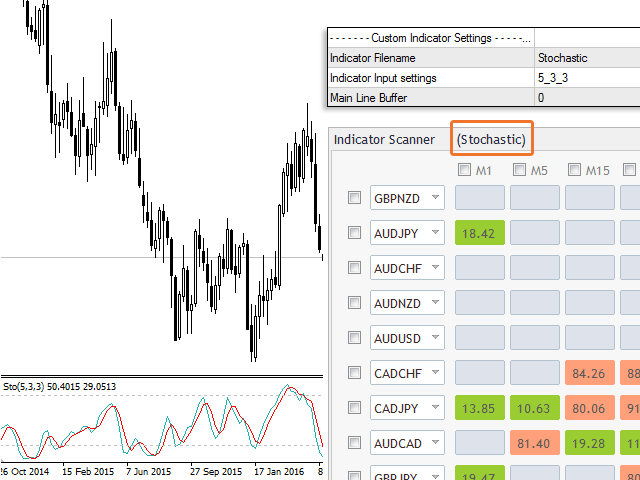
- Stochastic Oscillator
- Williams Percent Range (%R)
- Accumulation/Distribution
- Money Flow Index (MFI)
- On Balance Volume (OBV)
- Triple Exponential Average (TRIX)
- Accumulation Swing Index (ASI)
- Detrended Price Oscillator (DPO)
- Price and Volume Trend (PVT)
- Price Rate of Change (ROC)
- Ultimate Oscillator
- Volume Rate of Change (VROC)
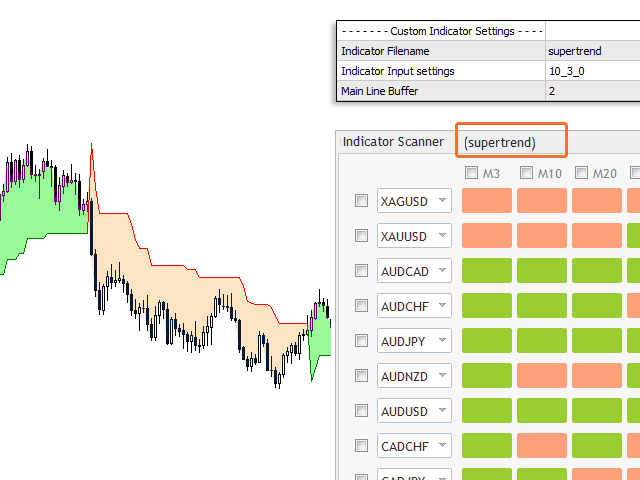
- SuperTrend by FxGeek
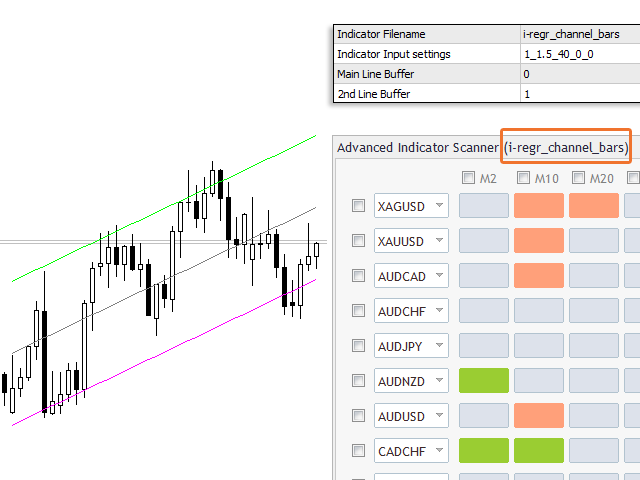
- i-Regr by Vladimir Karputov
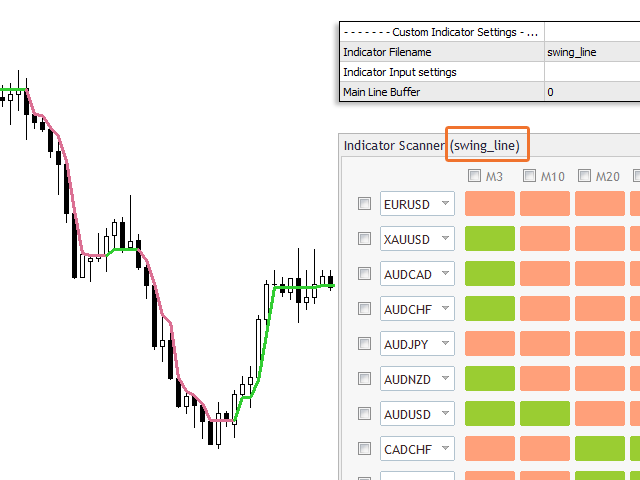
- Swing Line by Mladen Rakic
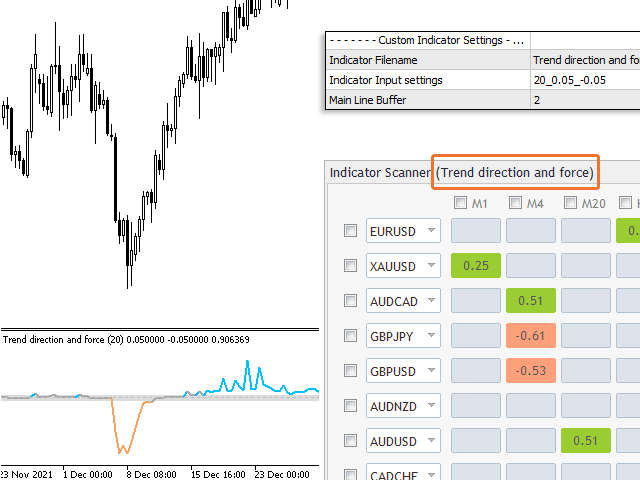
- Trend direction and force - JMA smoothed by Mladen Rakic
- Keltner Channel by Nikolay Kositsin
- Hull moving average by Mladen Rakic
Notes:
- To make the best use of this Scanner without confusion you should have basic experience in compiling ".mq5" files.
- This dashboard supports up to 2 lines(buffers) for given indicator. Some indicators have more than 2 lines like the Ichimoku indicator that has 5. We can't set up the dashboard to monitor all 5 lines. Although we can choose 2 of them for example kijun-sen and tenkan-sen and scan for the cross of them but not all 5 lines. So this dashboard has limited compatibility with such indicators.
- The symbols you want to add to the dashboard must be visible in the MetaTrader market watch window. The first time you run the scanner or load a new symbol in that it might take a few seconds to update its data and show signals.
If you trade consolidation breakouts or any type of strong price moves, you may want to try the Reward Multiplier tool.


ユーザーは評価に対して何もコメントを残しませんでした