Join our fan page
- Views:
- 38746
- Rating:
- Published:
- Updated:
-
Need a robot or indicator based on this code? Order it on Freelance Go to Freelance
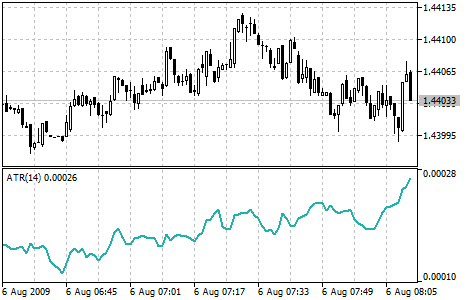
Average True Range (ATR) is a technical indicator that shows market volatility.
It was introduced by Welles Wilder in his book "New concepts in technical trading systems". This indicator has been used as a component of numerous other indicators and trading systems ever since.
Average True Range can often reach a high value at the bottom of the market after a sheer fall in prices occasioned by panic selling. Low values of the indicator are typical for the periods of sideways movement of long duration which happen at the top of the market and during consolidation.
Average True Range can be interpreted according to the same principles as other volatility indicators. The principle of forecasting based on this indicator can be worded the following way: the higher the value of the indicator, the higher the probability of a trend change; the lower the indicator’s value, the weaker the trend’s movement is.

Calculation:
True Range is the greatest of the following three values:
- Difference between the current maximum and minimum (high and low);
- Difference between the previous closing price and the current maximum;
- Difference between the previous closing price and the current minimum.
The indicator of Average True Range is a moving average of values of the true range.
Translated from Russian by MetaQuotes Ltd.
Original code: https://www.mql5.com/ru/code/12
 Accumulation Swing Index (ASI)
ASI was created by Wales Wilder as an ordinary fluctuations indicator that gets signals from previous maximums and minimums of price.
 Adaptive Moving Average (AMA)
The Adaptive Moving Average Indicator is used for constructing a moving average with low sensitivity to price series noises and is characterized by the minimal lag for trend detection.
 Awesome Oscillator (AO)
Bill Williams's Awesome Oscillator Indicator (AO) is a 34-period simple moving average, plotted through the middle points of the bars (H+L)/2, which is subtracted from the 5-period simple moving average, built across the central points of the bars (H+L)/2. It shows us quite clearly what’s happening to the market driving force at the present moment.
 Plombiers - oscillator in the channel.
Sometimes this is useful - to observe the behavior of the oscillator in the channel. Greatly simplifies the evaluation of the situation.