PZ Support Resistance MT5
- インディケータ
- バージョン: 7.0
- アップデート済み: 19 7月 2024
- アクティベーション: 20

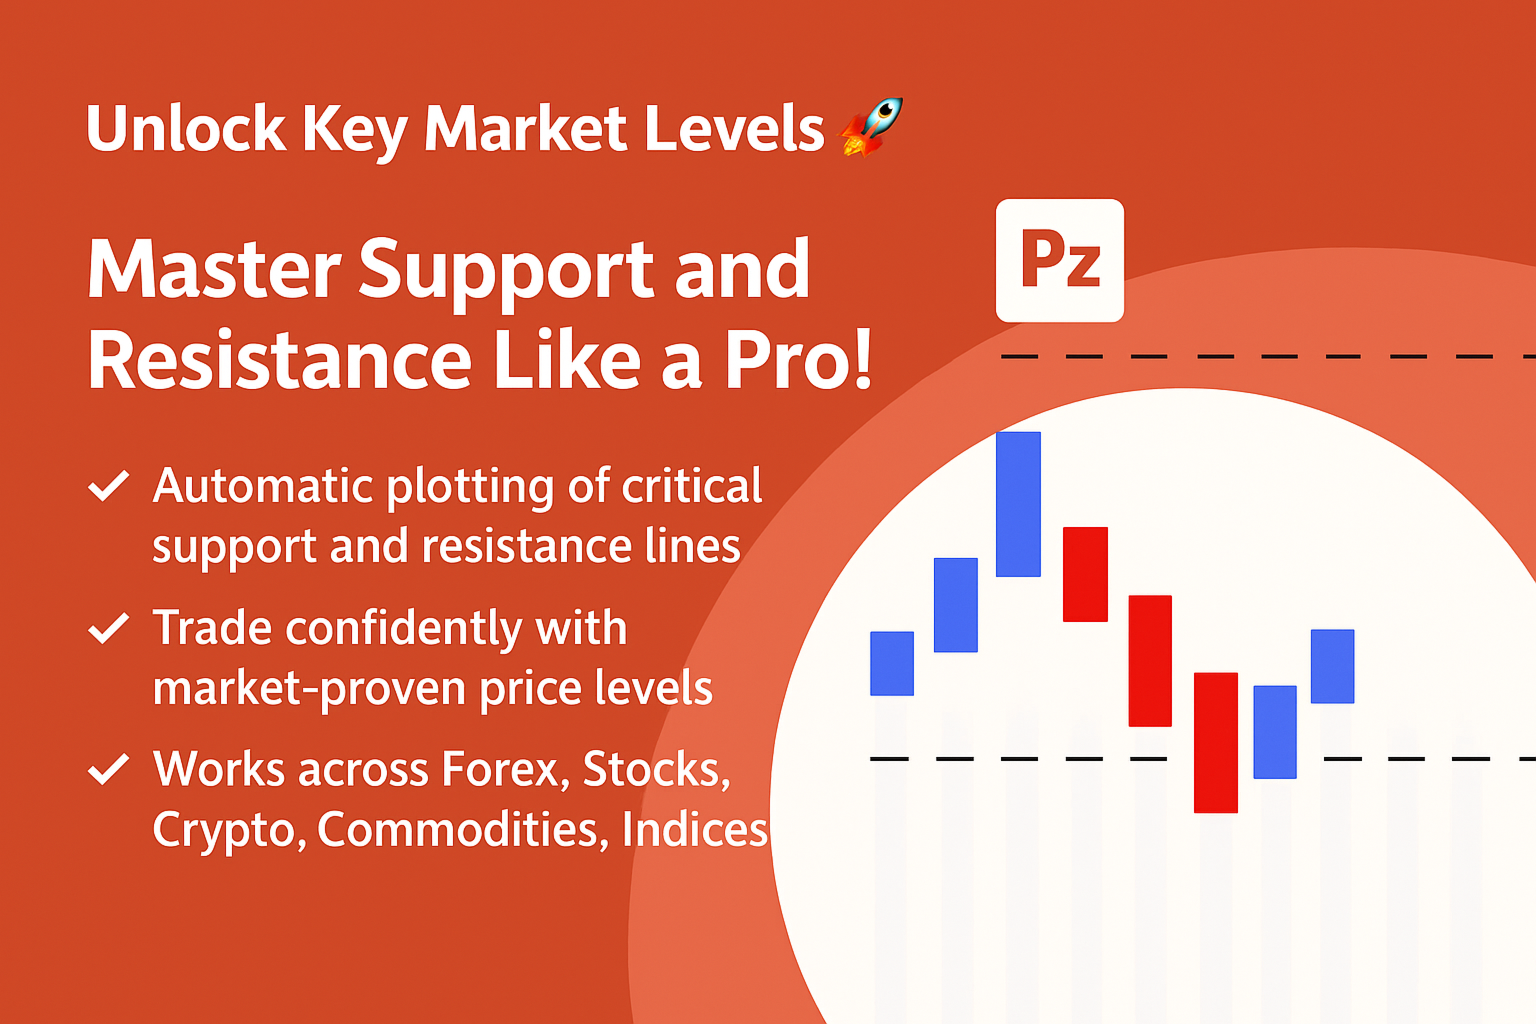
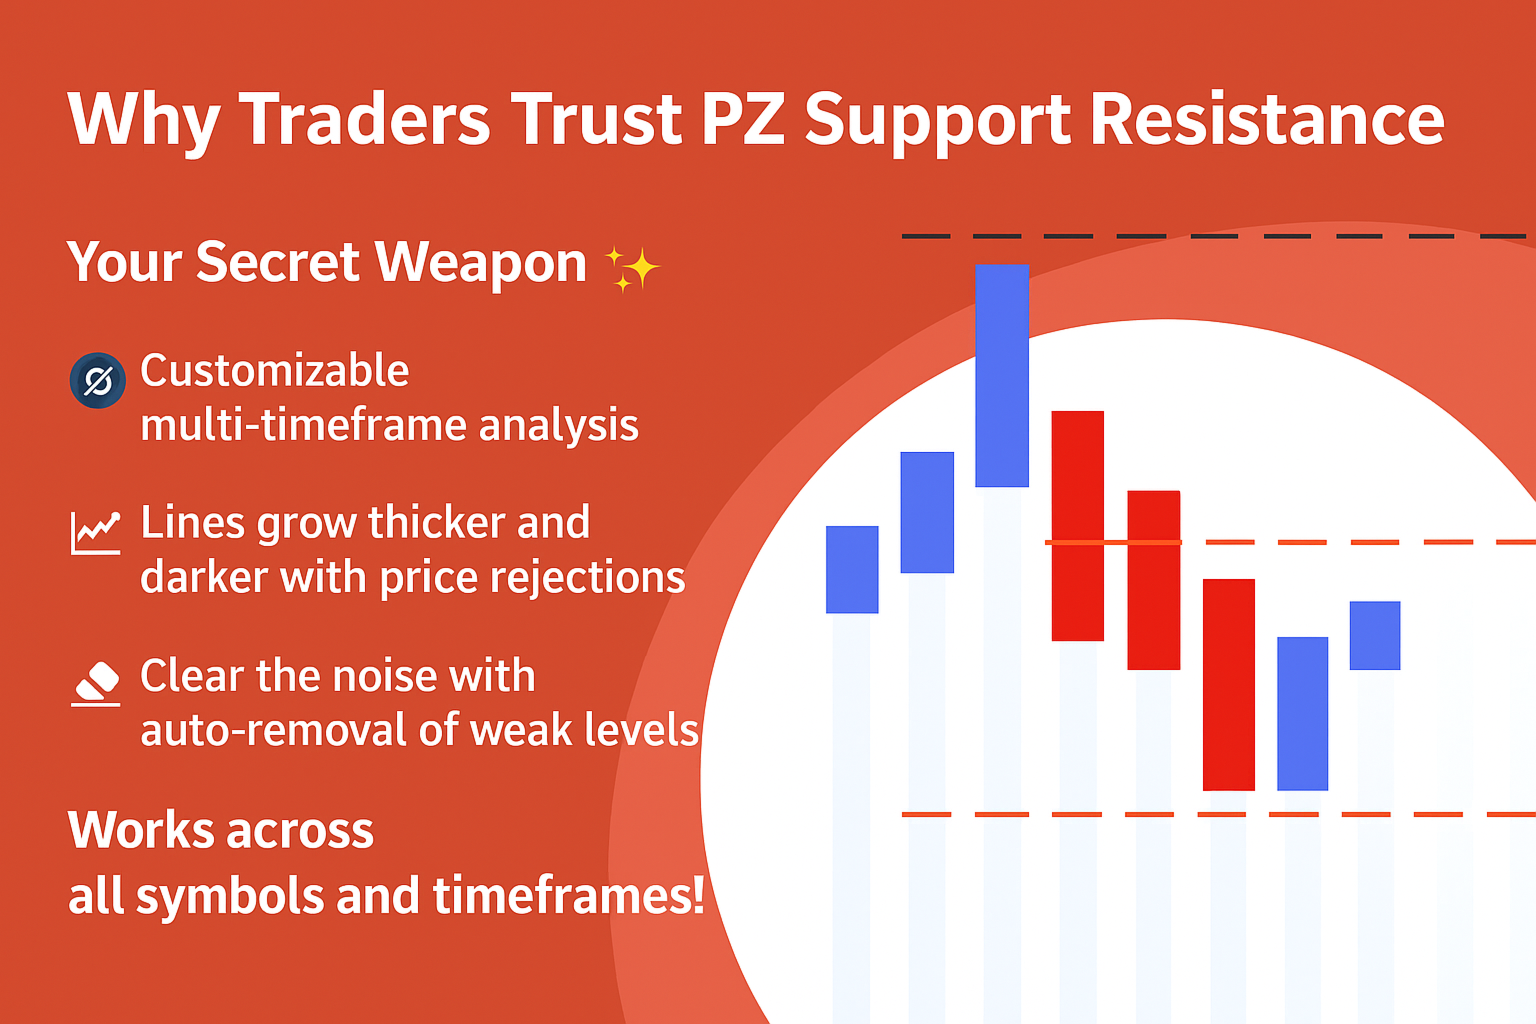
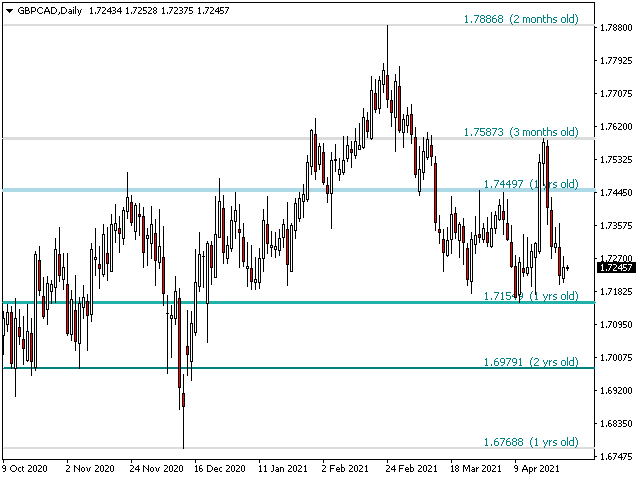
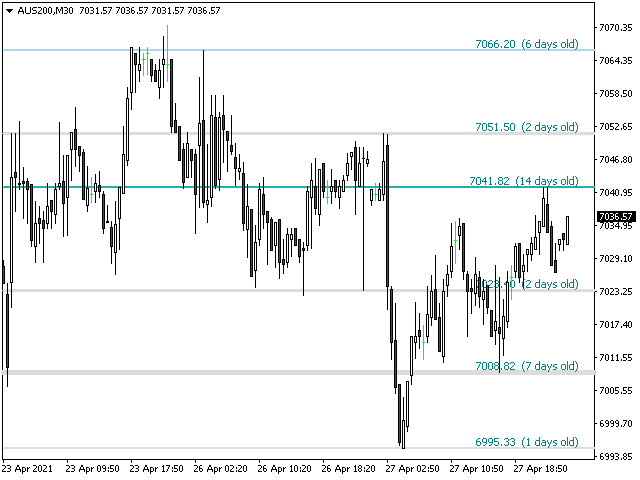
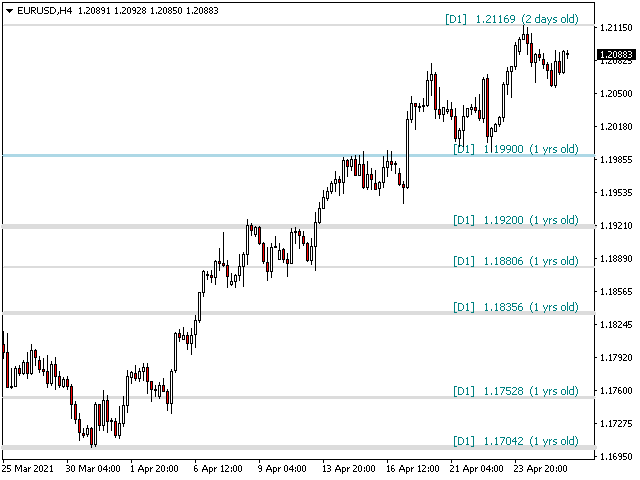
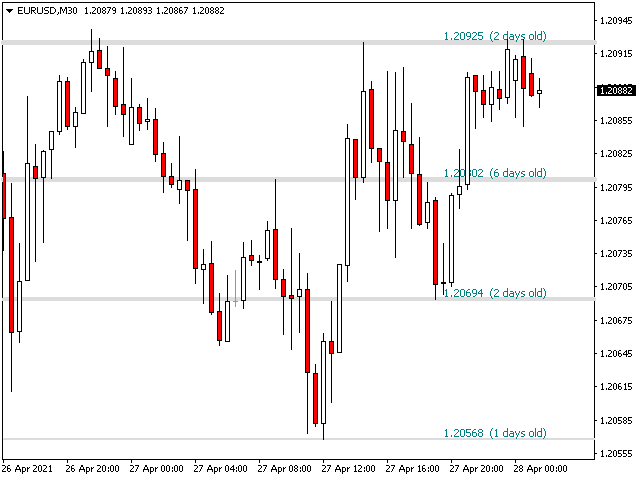
サポート線と抵抗線のプロットにうんざりしていませんか? サポートレジスタンスは、非常に興味深いひねりを加えてチャート内のサポートとレジスタンスラインを自動検出およびプロットするマルチタイムフレームインジケーターです。価格レベルは時間とともにテストされ、その重要性が高まるにつれて、ラインは太くなり、暗くなります。
[ インストールガイド | 更新ガイド | トラブルシューティング | よくある質問 | すべての製品 ]
- 一晩でテクニカル分析を強化
- チャートを閲覧せずに重要な価格レベルを検出
- 一目ですべての価格レベルの相対的な強さを認識する
- すべての取引で最大30時間のプロットラインを節約
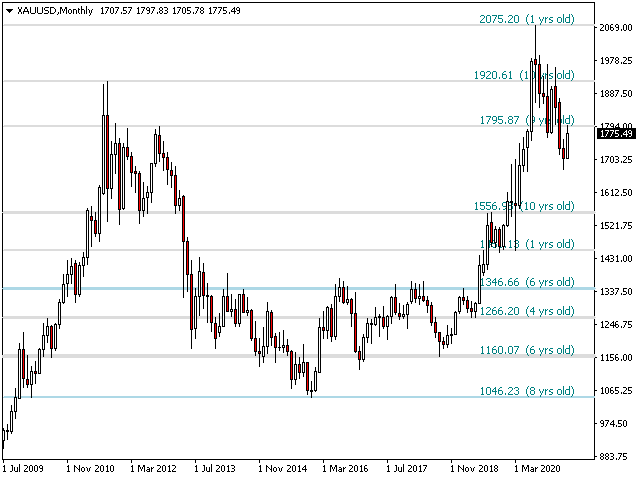
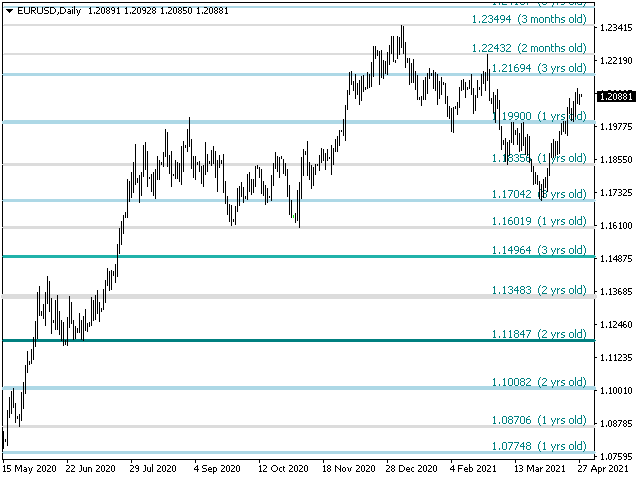
- インジケーターは、すべての価格レベルの年齢を表示します
- インジケーターは再描画されていません
過去および現在の価格レベルは近接によって崩壊し、現在の市場行動に合わせて調整されます。動作は、必ずしもピークではない場所に線が引かれます。
- 価格レベルは、時間とともに拒否されるにつれて、より暗く、より広くなります
- ノイズを避けるために、重要でない価格レベルは定期的にクリアされます
- カスタマイズ可能な時間枠の選択と崩壊要因
- ブレイクアウトのための電子メール/サウンド/プッシュアラートを実装します
入力パラメータ
- インディケーター設定:インディケーターは現在の時間枠から価格を読み取りますが、オプションで別のものを選択できます。たとえば、H1チャートにD1サポート線と抵抗線を表示できます。 価格レベル密度パラメータを使用して、チャートに表示する価格レベルの量を選択することもできます。
- 色の設定:重要度に基づいてサポート線と抵抗線の色を入力します。
- ラベル設定:オプションで、各サポートと抵抗線の年齢を表示するラベルをインジケーターに表示できます。これはデフォルトでは無効になっています。ラベルのフォントとサイズを選択できます。
- アラート:ブレイクアウトの表示/電子メール/プッシュ/サウンドアラートを有効にします。
著者
ArturoLópezPérez、個人投資家および投機家、ソフトウェアエンジニア、Point Zero Trading Solutionsの創設者。


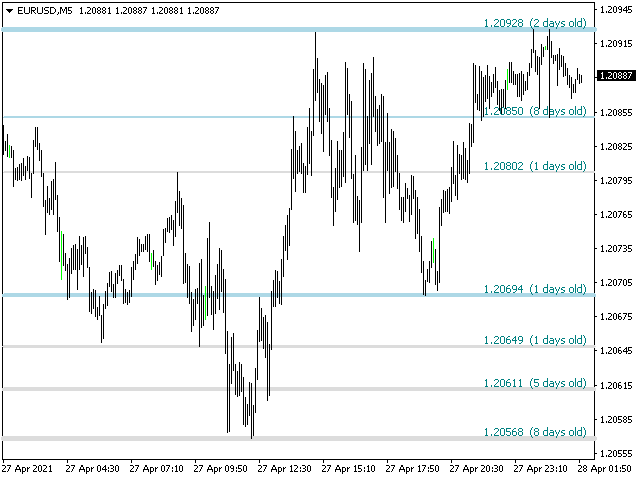
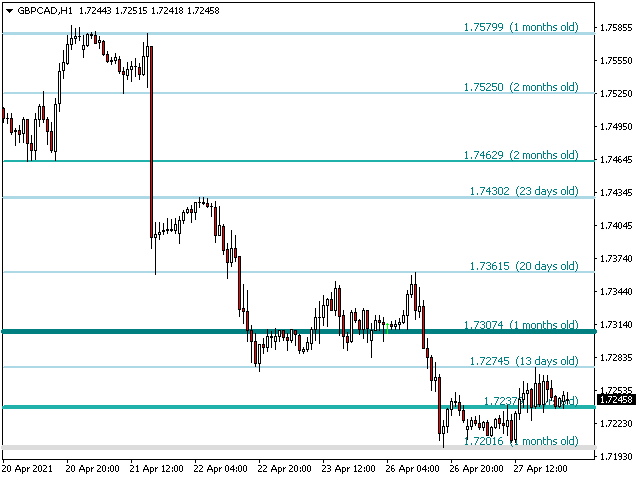


I have bought multiple products from PZ over the past 14 years, they are always well coded and you get excellent support. I had bought the MT4 version of this indicator a number of years ago, with now having transitioned to using MT5, I was missing having this in my charts. I did start having an Mt4 and MT5 platform open, so I could still see the indiactor running and the levels on the charts, then I tried some other S&R indicators, but they don't show the age of the support and/or resistance lines, which is what I really missed. Have a look at the screen shots and you will see on the far right the age, this is really helpful in knowing if you are looking at a new S&R line, or one that has been holding for a long time. I use it on a M5 chart these days, and leave the setting on current, but you can set it to daily if you want to see the larger timeframe lines. If you do this, you will see D1 in text on the S&R line, even if you are looking at and on an M5 chart which is really helpful.