Join our fan page
- Views:
- 31118
- Rating:
- Published:
- Updated:
-
Need a robot or indicator based on this code? Order it on Freelance Go to Freelance
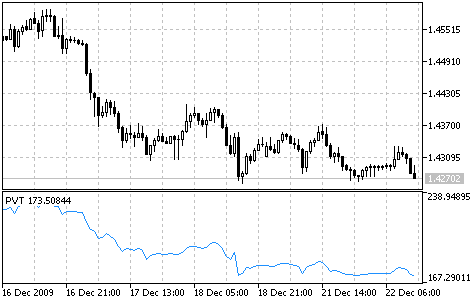
Price and Volume Trend (PVT) indicator, like On Balance Volume (OBV), represents the cumulative sum of trade volumes calculated considering close price changes.
The calculation algorithm is close to that of the indicator OBV. But in OBV we add the whole daily volume to the current indicator value when close prices are higher, and detract the whole volume when close prices are lower, while in PVT we add or detract just a part of daily volume. The exact part of the volume to be added to PVT is determined by the value of price change relatively to the close price of the previous day.
In OBV, the cumulative total volumes for each period are summed. However, in PVT, the volume is multiplied by the coefficient that depends on the difference between the current close price and the previous one.

Price and Volume Trend indicator
Calculation:
PVT calculates by multiplying the current volume to the relative price change with its further addition to the current cumulative PVT value.
PVT (i) = ((CLOSE (i) - CLOSE (i - 1)) / CLOSE (i - 1)) * VOLUME (i) + PVT (i - 1)
where:
- CLOSE (i) - close price of the current bar;
- CLOSE (i - n) - close price of the previous nth bar;
- VOLUME (i) - volume of the current bar;
- PVT (i) - the current value of PVT indicator;
- PVT (i - 1) - the value of PVT indicator of the previous bar.
Translated from Russian by MetaQuotes Ltd.
Original code: https://www.mql5.com/ru/code/45
 Price Channel
The Price Channel Indicator draws the price channel, its upper and lower boundaries are determined by maximal and minimal prices for a certain period.
 Parabolic SAR
The Parabolic SAR Indicator was developed for analyzing the trending markets.
 Price Rate of Change (ROC)
The Price Rate of Change (ROC) reflects this ondulatory movement like an oscillator, measuring the difference in prices in a certain period. ROC grows if prices grow and drops along with them. The more the price change is, the more ROC changes.
 Relative Strength Index (RSI)
The Relative Strength Index Indicator (RSI) is a price-following oscillator that varies between 0 and 100.