Join our fan page
- Views:
- 18884
- Rating:
- Published:
- Updated:
-
Need a robot or indicator based on this code? Order it on Freelance Go to Freelance
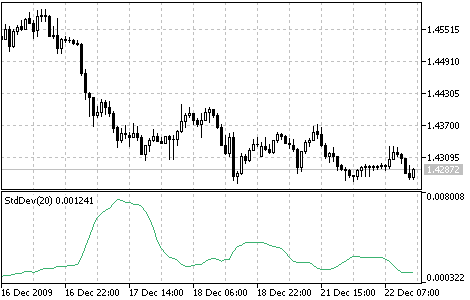
Technical indicator named Standard Deviation (StdDev) measures the market volatility.
This indicator charactrizes the scale of price changes relating to the Moving Average. Thus, if the indicator value is large, the market is volatile and the bars prices are rather dispersed relating to the moving average. If the indicator value is not large, it means that the market volatility is low and the bars prices are rather close to the moving average.
Normally, this indicator is used as a constituent of other indicators. Thus, when Bollinger Bands is calculated, the value of the symbol standard deviation is added to its Moving Average.
The market behavior represents the interchange of high trading activity and languid market. So, the indicator can be interpreted easily:
- If its value is too low, i.e., the market is absolutely inactive, it makes sense to expect a spike soon;
- Otherwise, if it is extremely high, it most probably means that activity will decline soon.

Calculation:
AMOUNT (j = i - N, i) = SUM ((ApPRICE (j) - MA (ApPRICE , N, i)) ^ 2)
where:
- StdDev (i) - Standard Deviation of the current bar;
- SQRT - square root;
- AMOUNT(j = i - N, i) - sum of squares from j = i - N to i;
- N - smoothing period;
- ApPRICE (j) - the applied price of the j-th bar;
- MA (ApPRICE (i), N, i) - any moving average of the current bar for N periods;
- ApPRICE (i) - the applied price of the current bar.
Translated from Russian by MetaQuotes Ltd.
Original code: https://www.mql5.com/ru/code/49
 Relative Vigor Index (RVI)
The main point of the Relative Vigor Index Indicator (RVI) is that on the bull market the closing price is, as a rule, higher, than the opening price.
 Relative Strength Index (RSI)
The Relative Strength Index Indicator (RSI) is a price-following oscillator that varies between 0 and 100.
 Stochastic Oscillator
The Stochastic Oscillator compares where a security’s price closed relative to its price range over a given time period.
 Ultimate Oscillator
The Ultimate Oscillator was developed by Larry Williams. It uses the averaging of three oscillators with different periods.