Join our fan page
- Views:
- 19239
- Rating:
- Published:
- Updated:
-
Need a robot or indicator based on this code? Order it on Freelance Go to Freelance
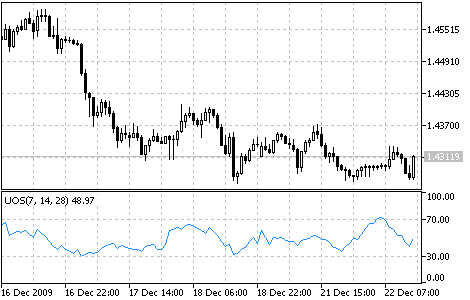
Usually oscillators compare the smoothened price of a financial tool and its value n periods ago. Larry Williams once noticed that the efficiency of such oscillator can vary and depends on the number of single periods you take for the calculation. So he created the Ultimate Oscillator that uses a weighted total of three oscillators with different calculation periods.
Larry Williams first described the oscillator in 1985 in the "Technical Analysis of Stocks and Commodities" magazine. The values of the indicator vary in a range from zero to 100 and the center is the 50 value. Values below 30 correspond with the overbought zone, and values between 70 and 100 - with the oversold zone.
The oscillator uses three time periods that you can set manually. On default, they are equal to 7, 14 and 28 bars. Mind that longer periods comprise shorter ones. That means that 28-period values discount 14-period and 7-period values. Therefore, we use the values of the shortest period three times, so these values influence the result of the oscillator most of all.
Larry Williams recommended that you should open a position when a divergence appears.
You should buy if:
- A bull divergence appeared: the prices have reached a lower minimum that hasn't been confirmed by a lower minimum of the oscillator;
- The oscillator fell below 30 when such bull divergence appeared;
- Then the oscillator rose above the maximum level reached in the time of bull divergence forming. This is the moment when you should buy.
Close long positions if:
- The oscillator rose above 50 and then fell below 45;
- The oscillator rose above 70 (sometimes you'd better wait till it drops below 70);
- Sell signals appeared.
Sell if:
- Bear divergence appeared: the prices have reached a higher maximum that hasn't been confirmed by a higher maximum of the oscillator;
- The oscillator grew above 50 when at a bear divergence;
- The oscillator fell below the minimum level reached in the time of bear divergence forming.
Close short positions if:
- The oscillator grew above 65;
- The oscillator fell below 30;
- Buy signals appeared.

Ultimate Oscillator
Calculation:
1. Define current "True Low" (TL) - the least of two values: the current minimum and the precious closing price.
TL (i) = MIN (LOW (i) || CLOSE (i - 1))
2. Find current "Buying Pressure" (BP). It is equal to the difference between current closing price and current True Low.
BP (i) = CLOSE (i) - TL (i)
3. Define the "True Range" (TR). It is the greatest of the following differences: current maximum and minimum; current maximum and previous closing price; current minimum and previous closing price.
TR (i) = MAX (HIGH (i) - LOW (i) || HIGH (i) - CLOSE (i - 1) || CLOSE (i - 1) - LOW (i))
4. Find the sum of BP values for all three periods of calculation:
BPSUM (N) = SUM (BP (i), i)
5. Find the sum of TR values for all three periods of calculation:
TRSUM (N) = SUM (TR (i), i)
6. Calculate the "Raw Ultimate Oscillator" (RawUO)
RawUO = 4 * (BPSUM (1) / TRSUM (1)) + 2 * (BPSUM (2) / TRSUM (2)) + (BPSUM (3) / TRSUM (3))
7. Calculate the "Ultimate Oscillator" (UO) value according to the formula:
UO = ( RawUO / (4 + 2 + 1)) * 100
where:
- MIN - means the minimum value;
- MAX - the maximum value;
- || — a logical OR;
- LOW (i) - the minimum price of the current bar;
- HIGH (i) - the maximum price of the current bar;
- CLOSE (i) - the closing price of the current bar;
- CLOSE (i - 1) - the closing price of the previous bar;
- TL (i) - the True Low;
- BP (i) - the Buying Pressure;
- TR (i) - the True Range;
- BPSUM (N) - the mathematical sum of BP values for an n period (N equal to 1 corresponds with i=7 bars; N equal to 2 corresponds with i=14 bars; N equal to 3 corresponds with i=28 bars);
- TRSUM (N) - the mathematical sum of TR values for an n period (N equal to 1 corresponds with i=7 bars; N equal to 2 corresponds with i=14 bars; N equal to 3 corresponds with i=28 bars);
- RawUO - "Raw Ultimate Oscillator"
- UO - stands for Ultimate Oscillator.
Translated from Russian by MetaQuotes Ltd.
Original code: https://www.mql5.com/ru/code/51
 Stochastic Oscillator
The Stochastic Oscillator compares where a security’s price closed relative to its price range over a given time period.
 Standard Deviation (StdDev)
The Standard Deviation (StdDev) measures the market volatility. This indicator charactrizes the scale of price changes relating to the Moving Average.
 Volumes
The Volumes indicator shows volumes with different colors depending on the volume changes.
 Volume Rate of Change (VROC)
The Volume Rate of Change (VROC) is an indicator of the direction where the volume trend moves.