Advanced Indicator Scanner MT4
- インディケータ
- バージョン: 2.1
- アップデート済み: 13 6月 2026
- アクティベーション: 15

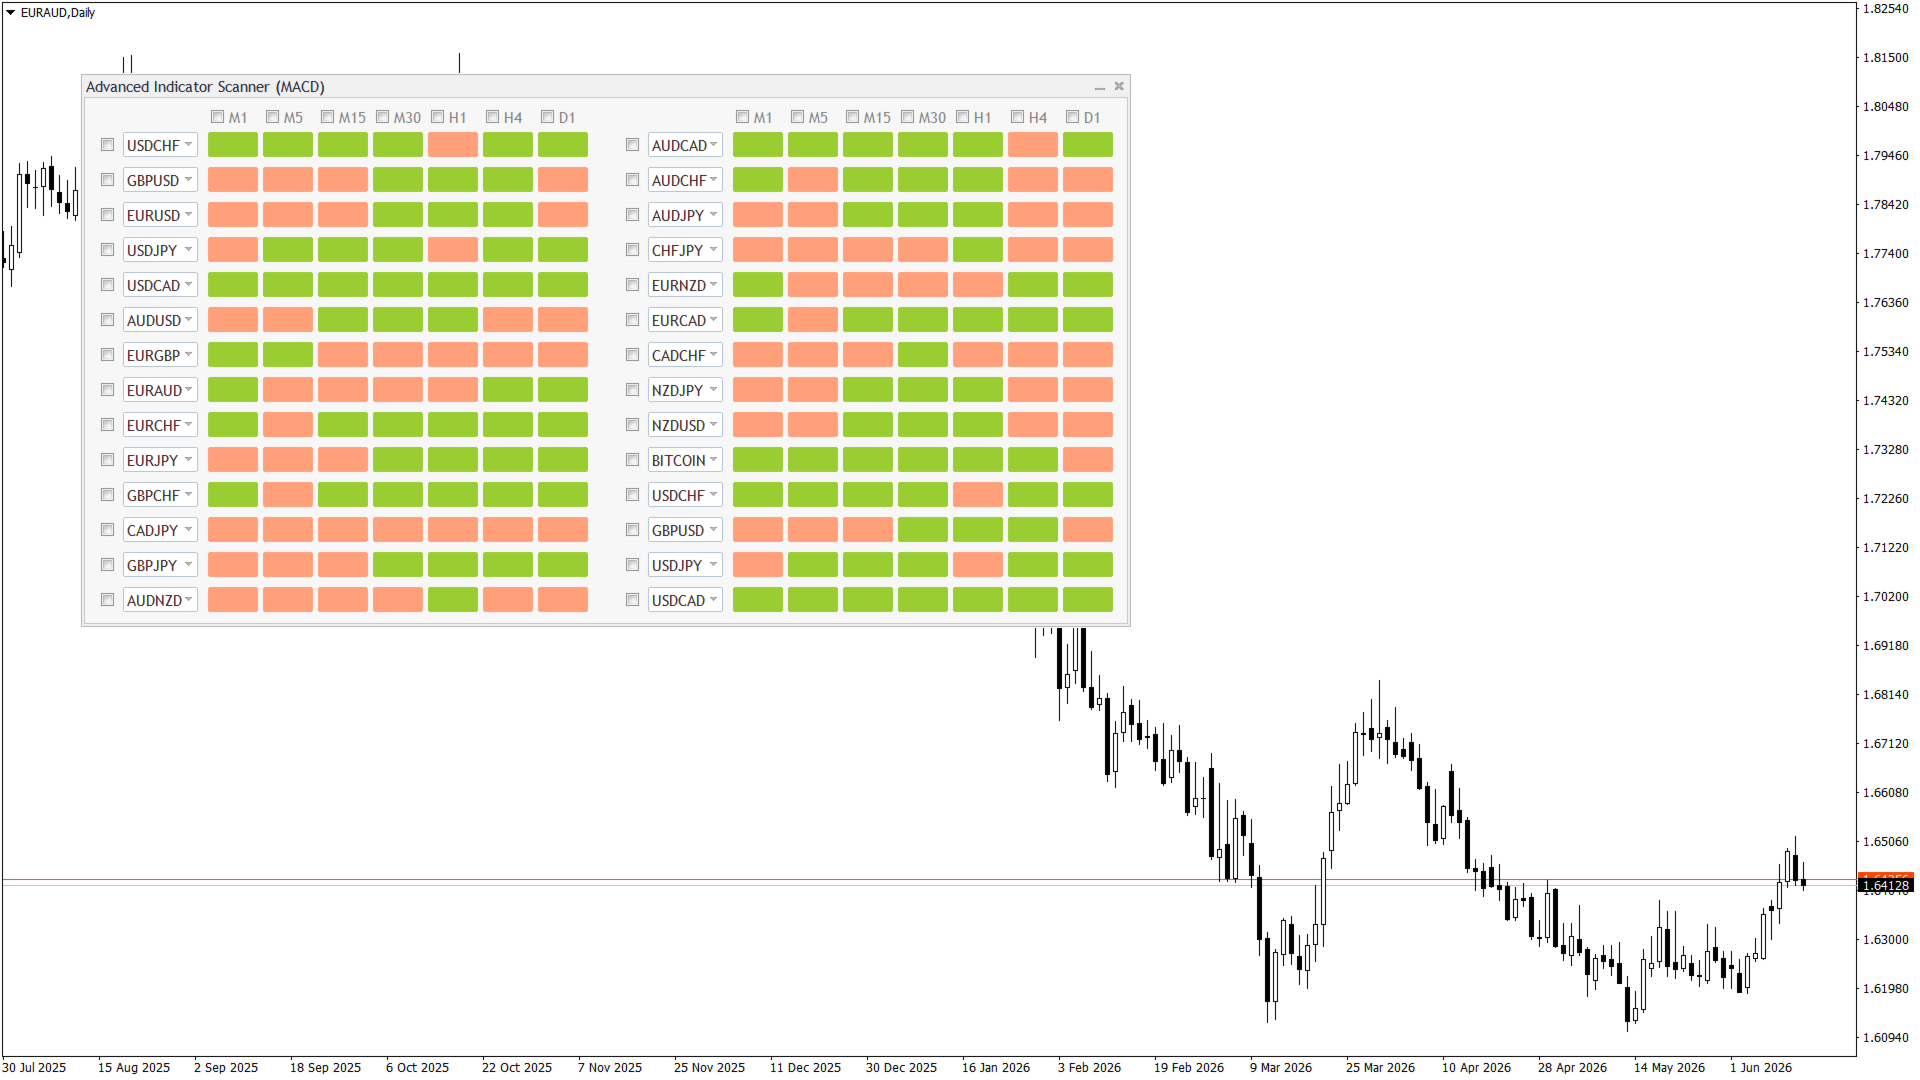
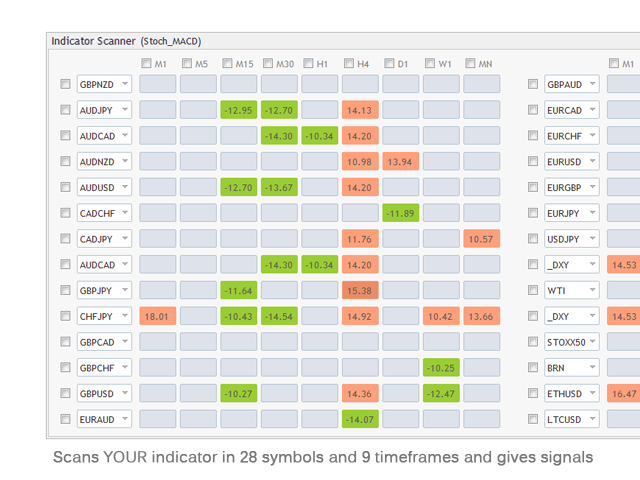
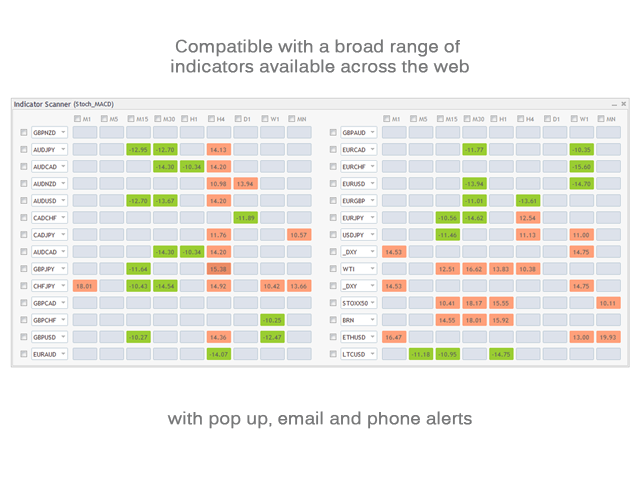
Advanced Indicator Scanner is a multi-symbol multi-timeframe scanner that works with hundreds of custom indicators available across the web including mql5 website market and codebase indicators.
Advanced Indicator Scanner features:
- Scans your indicator in 28 customizable instruments and 9 timeframes.
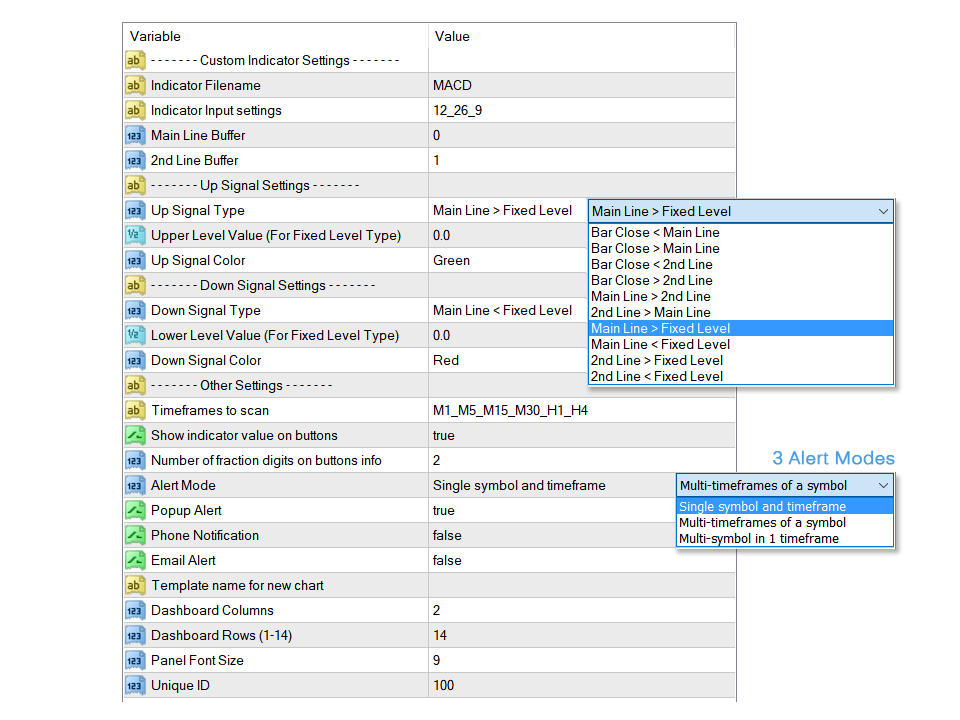
- Monitors up to 2 lines(buffers) of an indicator.
- Showing of indicator value on buttons.
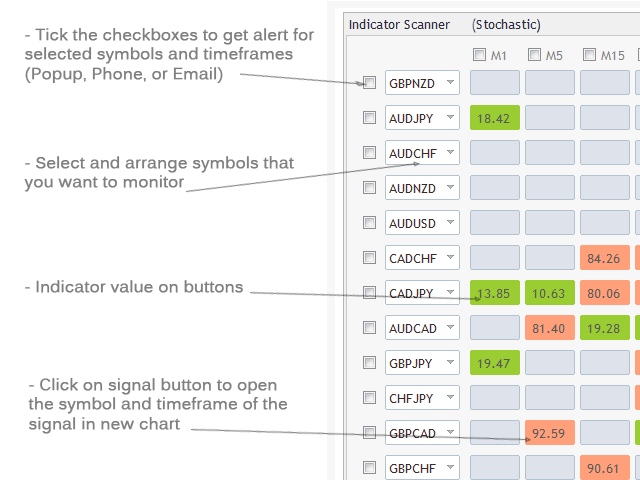
- You can choose between 3 alert modes:
- Single symbol and timeframe
- Multiple timeframes of a symbol
- Multiple symbols for a timeframe
- Popup, email, and phone notification alerts for selected symbols and timeframes.
- Quick review of signals in new chart by clicking on signal buttons.
- Easy arrangement of symbols in any order with any instrument.
After the purchase, don't forget to message me to receive a copy of the MT5 full version for 1 trading account as a bonus.
Works with more than 20 Metatrader default indicators, including:
- Moving Average, MA ( link )
- Parabolic SAR (link)
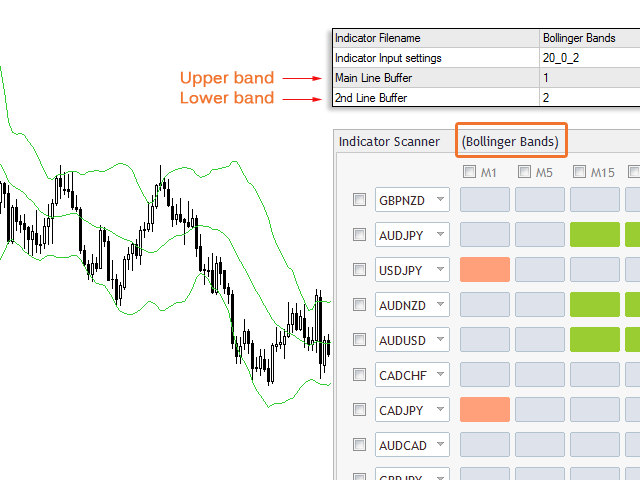
- Bollinger Bands, BB (upper & lower bands) (link)
- Average Directional Movement Index, ADX (Main line) (link)
- Envelopes (link)
- Standard Deviation, StdDev (link)
- Average True Range, ATR (link)
- Relative Strength Index, RSI (link)
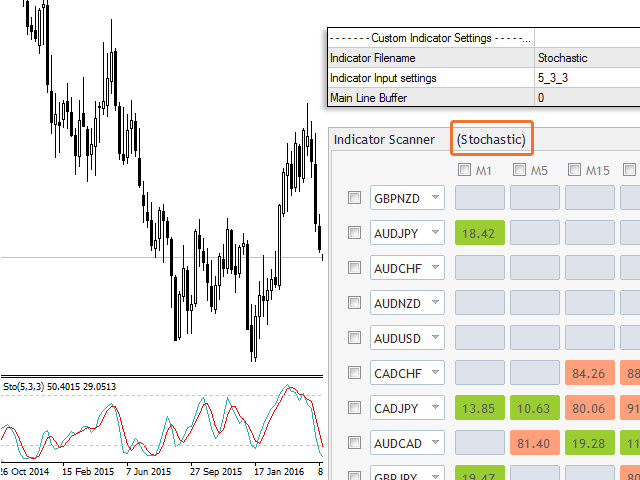
- Stochastic Oscillator (link)
- Commodity Channel Index, CCI (link)
- DeMarker, DeM (link)
- Force Index, FRC (link)
- Moving Average Convergence Divergence, MACD (link)
- Momentum (link)
- Moving Averages of Oscillator, OsMA (link)
- Relative Vigor Index RVI (link)
- Williams' Percent Range, %R (link)
- Accumulation/Distribution, A/D (link)
- Money Flow Index, MFI (link)
- On Balance Volume, OBV (link)
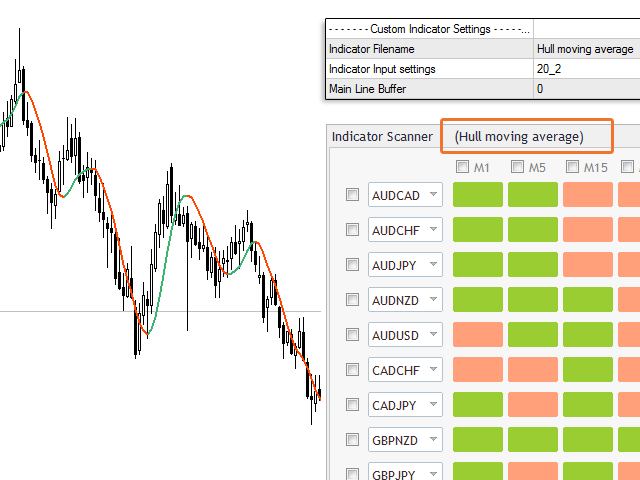
- Hull Moving Average by Mladen Rakic
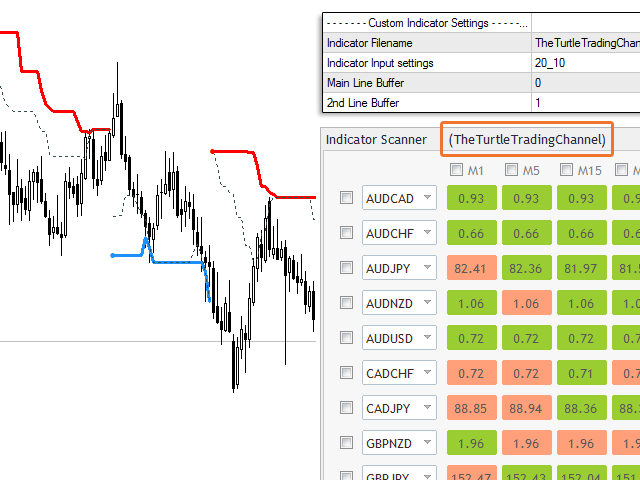
- The Turtle Trading Channel by Point Zero
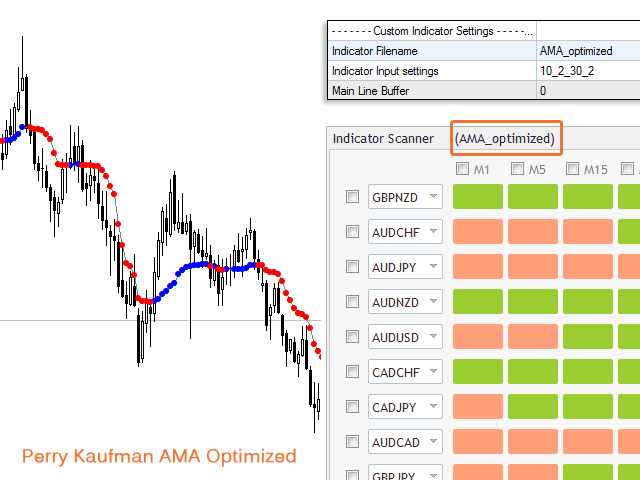
- Perry Kaufman AMA Optimized by MetaQuotes
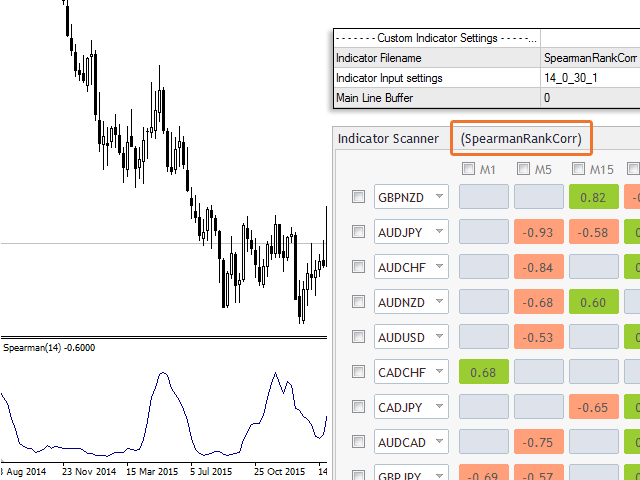
- Spearman's Rank Correlation by MetaQuotes
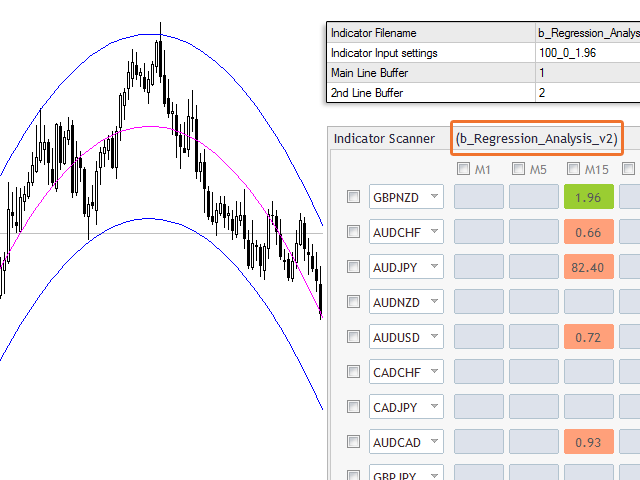
- Regression Analysis v2.0 by Boris Armenteros
Notes:
- To make the best use of this Scanner without confusion you should have basic experience in compiling ".mq4" files.
- This dashboards supports up to 2 lines(buffers) for given indicator. Some indicators have more than 2 lines like the Ichimoku indicator that has 5. We can't set up the dashboard to monitor all 5 lines. Although we can choose 2 of them for example kijun-sen and tenkan-sen and scan for the cross of them but not all 5 lines. So this dashboard has limited compatibility with such indicators.
- The symbols you want to add to the dashboard must be visible in the MetaTrader market watch window. The first time you run the scanner or load a new symbol in that, it might take a few seconds to update its data and show signals.
If you trade consolidation breakouts or any type of strong price moves, you may want to try the Reward Multiplier tool.