Symbol Manager for MT5

5
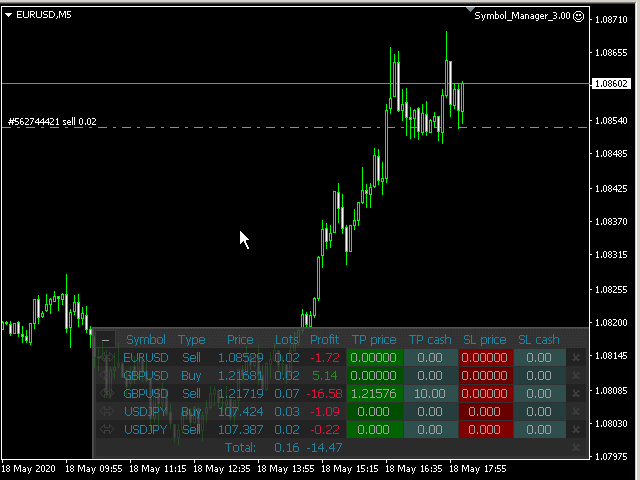
Symbol Manager or Grid Manager, designed to group orders into one position (by Symbol or by Magic Number). This utility will be useful to multi-currency traders (many EAs), who can have multiple orders on several pairs. You will be able to see the total number of lots, the total profit, and set virtual stop loss and virtual take profit. To set a real TP (or SL), you must first set the virtual value, and then enter the command in this cell: "set". If you want to set real TP/SL for all orders at once, then enter the command: "set all" or "setall".

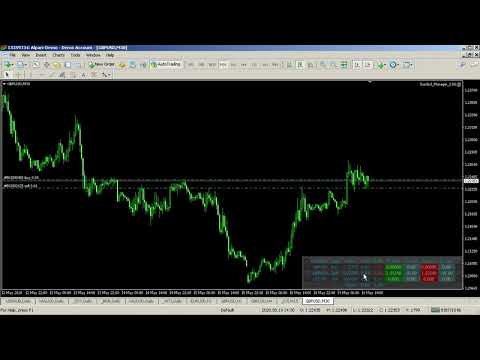
The Symbol Manager collects orders all together into one position. So you see not dozens of orders, but positions collected by type and pair, which you can manage. EA does not trade by itself, it only does what you tell it to do
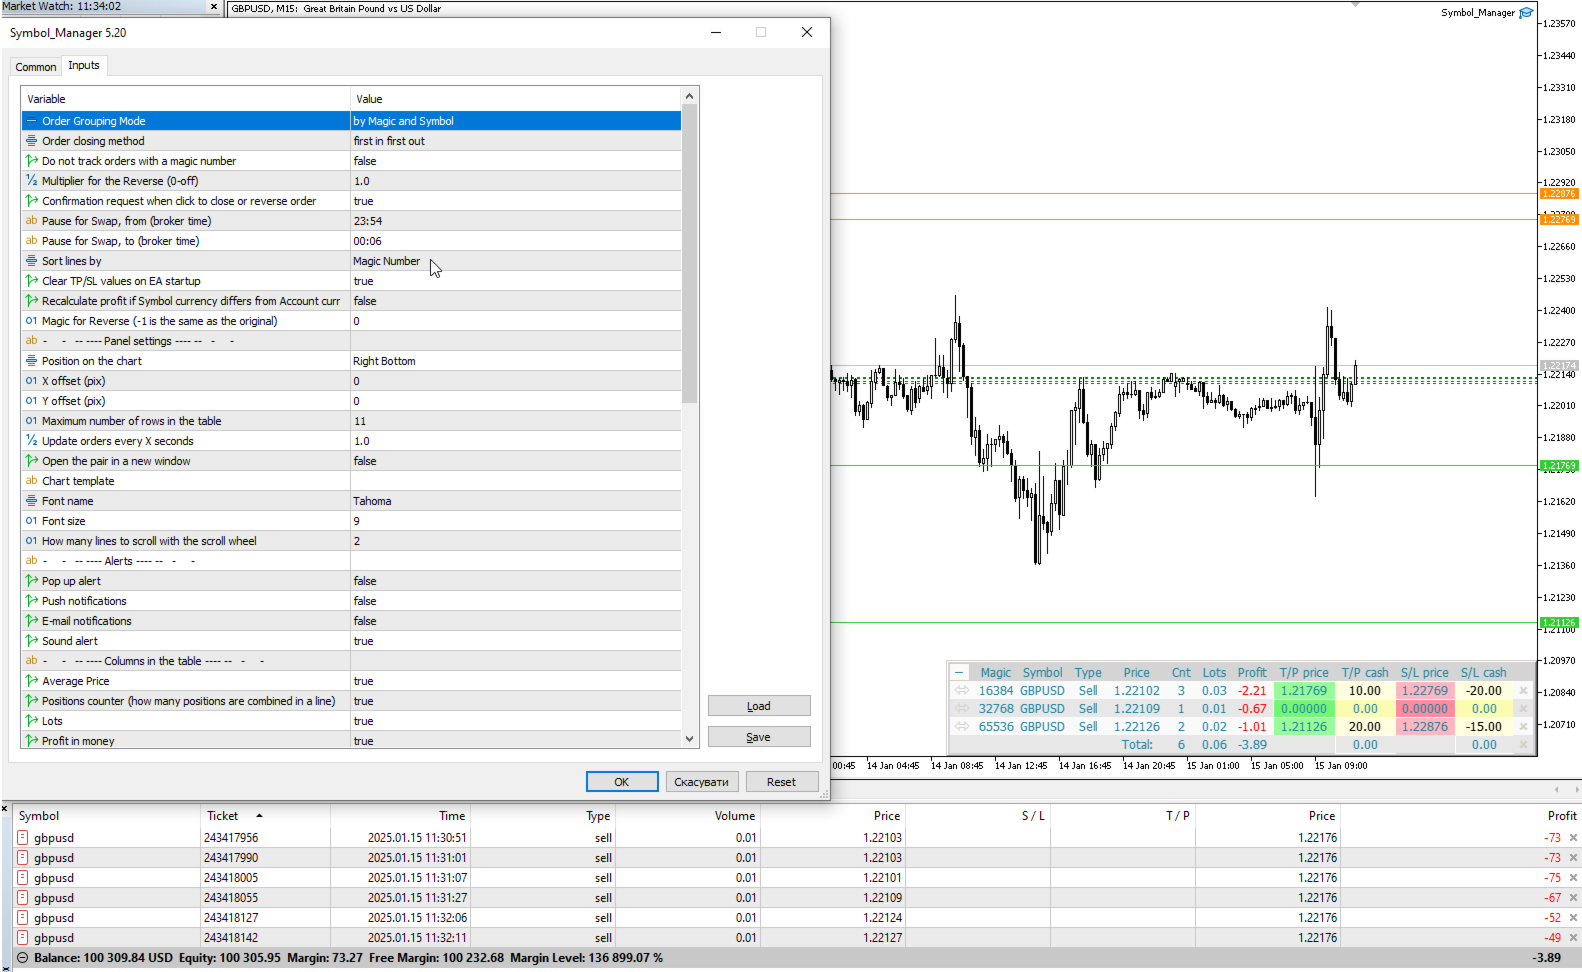
Parameters

Order Grouping Mode:
 by Symbol
 by Magic and Symbol
 do not group
Order closing method — order closing modes:
    — first in first out — (FIFO) starting from the first open orders;
    — first in last out — (FILO) starting from the last open orders;
    — profitable orders first — starting with the most profitable;
    — unprofitable orders first — starting with the least profitable;
    — first the largest volumes — starting with the largest volumes;
    — first the smallest volumes — starting with the smallest volumes;
    — without sorting — don't sort;
    Do not track orders with a magic number — do not manage orders with a magic number;
    Multiplier for the Reverse — multiplication factor for position reversal;
    Confirmation request when click to close or reverse order — ask for confirmation when closing or reversing positions;
    Show arrows on the chart when closing and opening orders — display trade arrows on the chart;
    Pause for Swap, from (broker time) — the beginning of a pause in the work of EA;
    Pause for Swap, to (broker time) — the end of a pause in the work of EA.
    Sort lines by:
     Symbol
     Price
     Type
     Lot
     Positions counter
     Magic Number
     do not sort
    Clear TP/SL values on EA startup.
    Magic for Reverse (-1 is the same as the original).
      Panel setup:
      Position on chart — the angle of the panel on the chart;
      X offset (pix) — shift the panel along the X axis;
      Y offset (pix) — shift the panel along the Y axis;
      Maximum number of rows in the table — the number of rows in the window;
      Update orders every X seconds —  update period for all pairs and timeframes;
      Open the pair in a new window — open a symbol in a new chart window by clicking.
      Chart template — the name of the template for the chart, if the chart opens in a new window.
      Font name.
      Font size.
        Notification setup:
        Pop up alert.
        Push notifications.
        E-mail notifications.
        Sound alert.
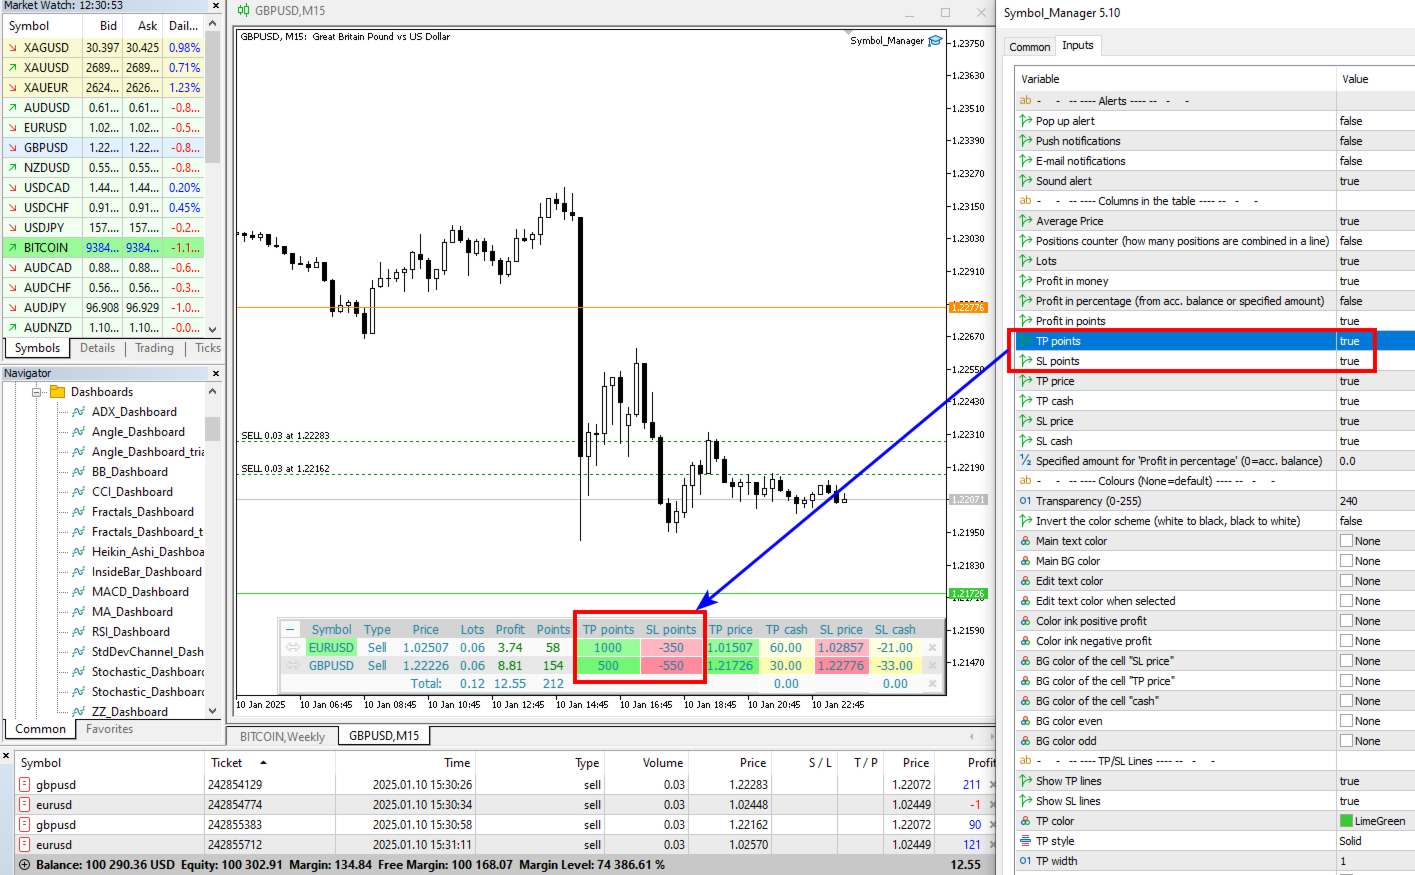
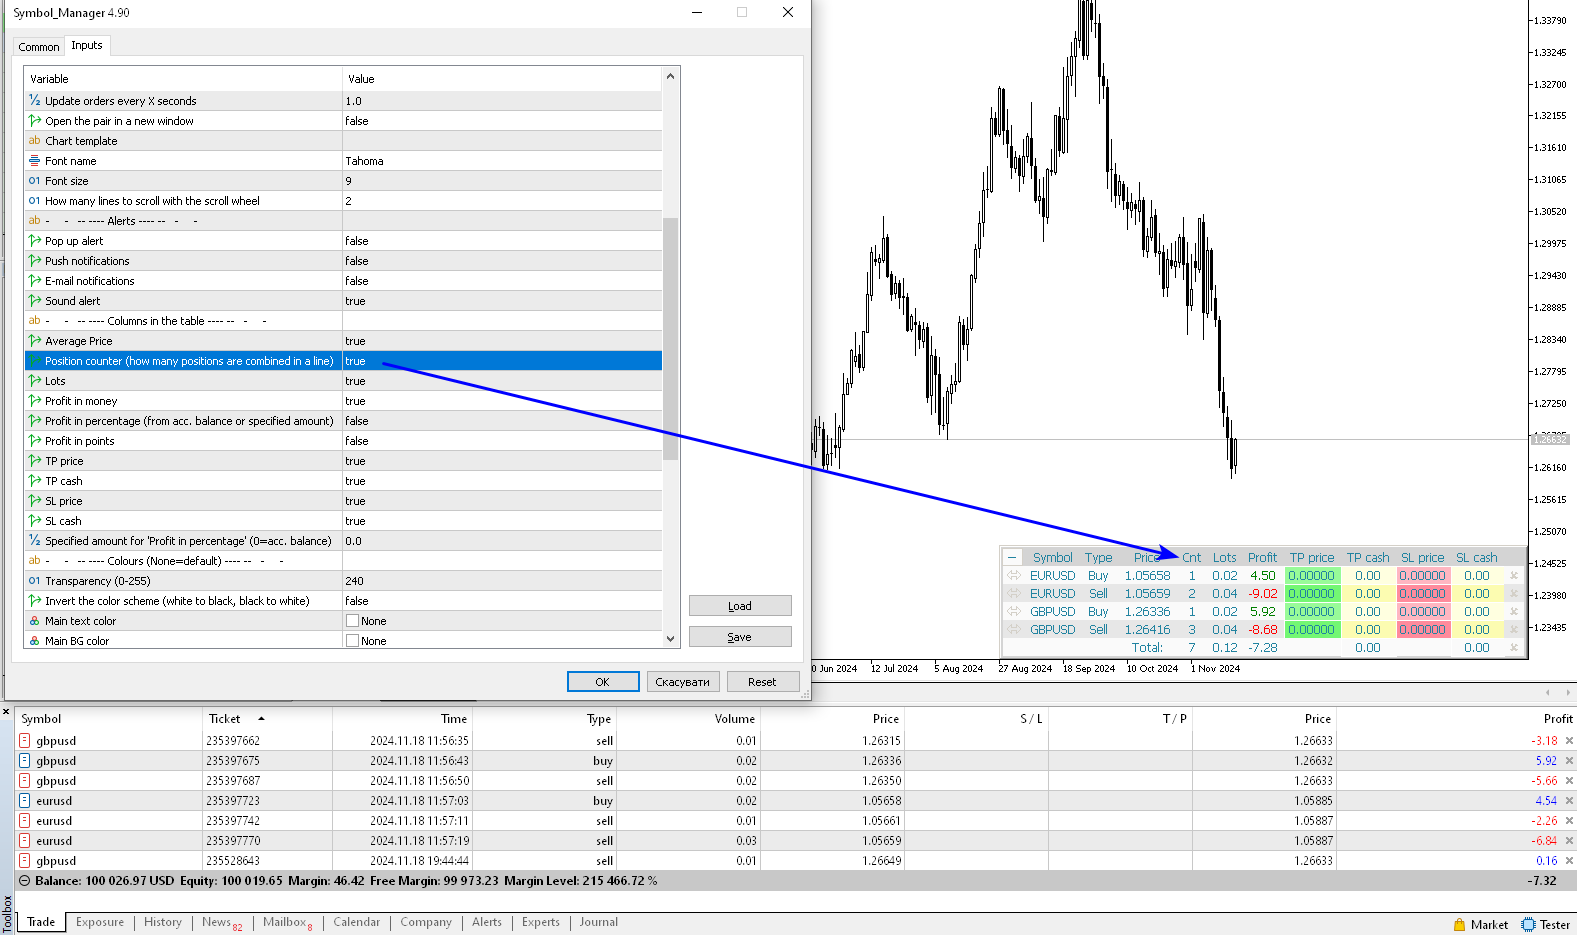
          Columns in the table:
          Average Price — show average price column;
          Positions counter — how many positions are combined in a line;
          Lots — show lots column;
          Profit in money — show profit column in deposit currency;
          Profit in percentage (from acc. balance or specified amount) — show profit column as a percentage. The percentage is calculated either from the account balance or from a given amount;
          Profit in points — show profit column in points;
          TP points — show take profit column in points;
          SL points — show stoploss column in points;
          TP price — show take profit column in prices;
          TP cash — show the take profit column in money;
          SL price — show stoploss column in prices;
          SL cash — show stoploss column in money.
          Magic Number for positions.
          Specified amount for 'Profit in percentage' (0=acc. balance) — amount for calculating the percentage, for the column "Profit in percentage".

          Colours (None=default) — here you can change the panel colors. The clrNONE color means use the default color.
          Invert the color scheme (white to black, black to white) — inverting the color scheme, black color turns to white and white to black.
          レビュー 5
          Jirasak Lapanalarploy
          148
          Jirasak Lapanalarploy 2024.12.12 16:09 
           

          It's really useful tool for trading multiple symbols. also great support.

          Noppadol Phompaksorn
          620
          Noppadol Phompaksorn 2024.12.12 11:14 
           

          Really great tool. Must have.

          Andre Gomes
          2946
          Andre Gomes 2021.03.02 13:38 
           

          This is a really great trade manager. I use it every day.

          おすすめのプロダクト
          Visual Dolphin Indicator
          AL MOOSAWI ABDULLAH JAFFER BAQER
          Visual Dolphin Indicator Unlock the rhythm of the market with the Visual Dolphin Indicator, your ultimate tool for identifying and capitalizing on market trends with clarity and confidence. Designed for both novice and experienced traders, this indicator eliminates the noise and guesswork, providing crystal-clear buy and sell signals directly on your chart. The Logic Behind the Waves The core of the Visual Dolphin Indicator is a sophisticated yet intuitive dual-wave system based on moving avera
          Episode Health Monitor Episode Health Monitor is a trading utility for MetaTrader 5 designed to analyze the real-time condition of active trading positions directly on the chart. The tool evaluates the current “trading episode” - a group of open positions - and provides a structured view of risk, stability, and distance to potential failure. Instead of relying only on profit/loss or price movement, it helps identify whether the current position is stable, weakening, or approaching a critical st
          One Click Trading – Auto TP SL Developer TraderLinkz Version 1.00 Category Utility What it does Adds missing TP and SL to your manual trades and pending orders Sets them once per ticket Lets you move TP and SL afterward Works on hedging and netting accounts Scans on every tick and reacts on trade events Why you want it You place faster entries You get consistent risk and exit targets You reduce fat finger errors You keep full manual control Quick start Attach the EA to any chart Keep TP and SL e
          FREE
          Account Monitor Pro — Your Ultimate Trade Statistics Hub Account Monitor Pro is a professional information dashboard designed for traders who combine Expert Advisors (EAs) and manual trading. The indicator separates statistics in real-time based on your Magic Number, allowing you to clearly see who is driving the profit: the algorithm or yourself. Key Features: Split Monitoring: Instant separation of "Robot" positions (by Magic Number) and "Manual" trades. Multi-language Support: 11 languages in
          FREE
          Quick Trade Panel Pro
          Nicolas Olivier Menetrey
          5 (1)
          自動ロット・リスク管理付きワンクリック取引パネル Quick Trade Panel Pro は、リスクを完全にコントロールしながら素早く注文を執行したいトレーダーのために設計された直感的な取引パネルです。 主な機能 利用可能証拠金の割合に基づいてロットサイズを自動計算 ポイント単位で設定可能なストップロス、各取引に自動適用 一連の取引中はロットサイズをロックし、一貫したポジションサイズを確保 スマートヘッジシステム ヘッジモードで既存取引と反対方向のポジションを開くことが可能 独立したヘッジ割合(50%、100%、200%以上) 方向ごとの取引制限で精密なコントロール 自動利益保護 Auto Secure :一定の利益に達するとストップロスを損益分岐点に移動 Trailing Stop :価格を追従して利益を保護しながら、勝ちトレードを伸ばす 両システムを併用して最適な保護が可能 モダンでシンプル、プロフェッショナルなインターフェース リアルタイム表示:最大ロット、最終ロット、ヘッジロット 制限に達するとBUY/SELLボタンが自動的に無効化 シンボルとマジックナンバーごとに
          FREE
          Trade Manager は、リスクを自動的に計算しながら、取引を迅速に開始および終了するのに役立ちます。 過剰取引、復讐取引、感情的な取引を防止する機能が含まれています。 取引は自動的に管理され、アカウントのパフォーマンス指標はグラフで視覚化できます。 これらの機能により、このパネルはすべてのマニュアル トレーダーにとって理想的なものとなり、MetaTrader 5 プラットフォームの強化に役立ちます。多言語サポート。 MT4バージョン  |  ユーザーガイド + デモ Trade Manager はストラテジー テスターでは機能しません。 デモについてはユーザーガイドをご覧ください。 危機管理 % または $ に基づくリスクの自動調整 固定ロットサイズを使用するか、ボリュームとピップに基づいた自動ロットサイズ計算を使用するオプション RR、Pips、または価格を使用した損益分岐点ストップロス設定トレーリングストップロス設定 目標に達したときにすべての取引を自動的に終了するための 1 日あたりの最大損失 (%)。 過度のドローダウンからアカウントを保護し、オーバートレードを防ぎます
          BreakEvan Utility  Is a simple tool in a panel with this utilities: This utility will draw a Golden Line in the chart applied showing the breakeven price, considering all the positions opened for that specific symbol. Also the information panel shows: Balance Breakeven Price for that chart Force Breakeven (for that symbol) as ON/OFF Force Breakeven Global (takes into account all trades opened) as ON/OFF Total Lots opened for Symbol Total Lots opened Global And two buttons: Force Breakeven: Whe
          One Click Trader Utility MT5
          AL MOOSAWI ABDULLAH JAFFER BAQER
          One-Click Trader Utility for MT5 Professional Trading at Your Fingertips One-Click Trader Utility is a premium MT5 tool designed for active traders who need lightning-fast execution and real-time performance metrics. For just $30, transform your trading experience with institutional-grade technology previously available only to professional traders. Key Features Ultra-Fast Execution - Open and close positions with a single click, critical for scalpers and news traders Real-Time Market Metrics -
          Equity Protector Pro MT5 Equity Protector Pro MT5 is a risk control utility for MetaTrader 5 designed to monitor account exposure and enforce predefined risk limits directly on the chart. In a standard MT5 setup, traders can see balance, equity, and floating profit. However, when multiple positions are open — especially on fast-moving instruments like XAUUSD - it becomes difficult to understand how close the account is to a risk threshold, or whether the current structure is still safe. This to
          概要 Candle Timer Countdown Pro は、現在のローソク足が終了するまでの残り時間を、滑らかで正確なカウントダウンとして表示します。さらに、円形のプログレスアーク(進行表示)を組み合わせることで、残り時間を瞬時に視覚的に把握できます。 ティック間で停止したり、時間がずれてしまう他のタイマーとは異なり、本インジケーターはサーバー時間の補間(Server Time Interpolation)を使用し、M1 から MN まであらゆる時間足で途切れのないスムーズなカウントダウンを実現します。 1分足でのスキャルピングでも、H4でのスイングトレードでも、現在のローソク足が正確にいつ確定するのかを把握することで、エントリータイミングの最適化、ローソク足パターンの確認、そして早すぎる判断の回避に役立ちます。 このタイマーが他と違う理由 多くの MT5 用キャンドルタイマーは TimeCurrent() のみに依存しており、新しいティックが到着したときにしか更新されません。低ボラティリティ時や上位時間足では、ティックの間隔が数秒空くことがあり、その間タイマーが停止し、その後突
          SLTPSetter
          Raphael Djangmah Osro Agbo
          SLTPSetter - StopLoss Take Profit Setter HOW DOES IT WORK? Risk and account management is a very critical aspect of trading. Before entering a position, you must be fully aware how much you will be willing to loss both in percentage and value. This is where SLTPSetter gets you covered.  All you need to do is attach the indicator on the chart and PRESS BUY OR SELL automatically, all parameters needed for placing the trades will be provided at the top left corner of the screen. Feel free to adjust
          This tool will perform Trailing stop loss and Break even management for orders. Helps you limit or reduce the time spend watching orders on the screen, especially when you need to go to sleep. Just add this EA to 1 chart, you can manage all pairs. You can filter orders by comment, magic number, symbol and order ticket number. When Breakeven it can add shift/offset pips (to cover the commission...). You can try in strategy tester before purchase. The EA will add Buy and Sell alternately, so you
          Equity monitor This is a simple means change informer. I wrote it for myself, maybe someone will need it... 1. Displays the change in funds for the day. Every day, when the terminal is first launched, it remembers the current funds and monitors changes throughout the day. 2. The first day of the month, well remembers the money and, within months, to monitor changes. 3. Well, it displays the profit of the open position. To work, you need to create 4 global variables: gvarEqityDay , gvarEq
          FREE
          CosmiCLab SMC FIBO CosmiCLab SMC FIBO is a professional trading indicator designed for traders who use Smart Money Concepts (SMC), market structure analysis and Fibonacci retracement levels. The indicator automatically detects market swings and builds Fibonacci levels based on the latest impulse movement. It also identifies market structure changes such as BOS (Break of Structure) and CHOCH (Change of Character), helping traders understand the current market direction. CosmiCLab SMC FIBO also pr
          Trading Utility for Forex Currency Pairs Only not for Gold  Functions Auto Lot Calculation based on Risk Auto stoploss  Auto TakeProfit Breakeven Auto Close Half % Close in percentage with respect to the PIPs Pending Orders BuyLimit Sell Limit with distances BuyStop Sell Stop    with distances Trading Informations Risk in percentage For Multiple trades Combine Takeprofit and Combine Stoplosses
          Core function Intelligent transaction management one-click opening and closing operation, which supports user-defined lots to set multiple closing modes: all closing, closing by direction and closing by profit and loss status. Professional risk control, real-time risk monitoring and spread control to avoid high-cost trading environment. Visual control panel has an intuitive graphical interface, and all functions can be operated with one button to display position information, profit and loss sta
          FREE
          Trade Assistant 38 in 1
          Makarii Gubaydullin
          4.91 (23)
          多機能ツール:ロット計算、グリッド注文、R/R比率、トレードマネージャー、サプライ&デマンドゾーン、プライスアクションなど デモ版   |   ユーザーマニュアル トレードアシスタント   はストラテジーテスターでは動作しません :   こちらからデモ版をダウンロード  して ユーティリティ をテストできます。 ご質問、改善のご提案、バグ発見の場合は ご連絡ください MT4版が必要な場合は こちら から入手できます トレード   プロセス を簡素化、高速化、自動化。   ダッシュボード で標準端末の機能を拡張。 トレードパネルは  あらゆる取引商品で動作:外国為替、株式、インデックス、暗号通貨など。 1. 新規トレードの実行 :ロット / リスク / R/R計算 :手動トレードのためのリスク管理 ロット計算機(リスクサイズに基づく取引量計算) リスク計算機(ロットサイズに基づくリスク額) リスクリワード   比率 グリッド注文:  + 動的間隔オプション、スプリットロットオプション 注文のアクティベーショントリガー、+ バイストップリミット / セルストップリミット 仮想SL、仮想
          目的: マーケットウォッチ の全シンボルを、現在の時間軸(TF)で default.tpl テンプレートを使用して自動的に開き、現在アクティブなチャート以外をすべて閉じます。手動操作不要で複数銘柄の分析に最適! 特徴: 自動化: 数十のチャートを1クリックで開く。 安全性: 不要なチャートを閉じ、現在のチャートを維持。 柔軟性: カスタム default.tpl テンプレートを使用(事前に設定が必要!)。 現在の時間軸: アクティブなチャートのTFと同じ時間軸で開く。 インストール: OpenAllSymbolsSafe.mq5 をMetaTrader 5の MQL5/Scripts フォルダにコピー。 ターミナルを再起動するか、スクリプトリストを更新(右クリック→ 更新 )。 ️ 重要: default.tpl が MQL5/Profiles/Template/ にあることを確認。 現在のチャート以外はすべて閉じるため、作業に支障がないか確認。 現在のTFがサポートされていない場合、最寄りのTFで開く。
          FREE
          Crypto_Forex MT5用インジケーター「 WPR with 2 Moving Averages 」(リペイント機能なし) - WPR自体はスキャルピングに最適なオシレーターの1つです。 - 「WPR and 2 Moving Averages」インジケーターを使用すると、WPRオシレーターの高速移動平均線と低速移動平均線を確認できます。 - このインジケーターを使用すると、価格調整を早期に把握できます。 - このインジケーターはパラメータで簡単に設定でき、どの時間枠でも使用できます。 - 買いと売りのエントリー条件は画像で確認できます。 - WPR MA クロスの PC およびモバイル アラート付き。 買いシグナルの条件例: (1) - 高速MAが低速MAを下向きにクロスし、WPR値が-50を下回っている場合:買いトレードを開きます。 (2) - WPR値が-20を超える買われすぎゾーンに入ったら:買いトレードを終了します。 売りシグナルの条件例: (1) - 高速MAが低速MAを下向きにクロスし、WPR値が-50を超えている場合:売りトレードを開きます。 (2) WP
          RSI Currency Strength Meter is a powerful and elegant multi-currency indicator that measures the real-time relative strength of the 8 major currencies using RSI logic. By calculating the smoothed performance of each currency across its major pairs and applying the RSI formula, it delivers clean and responsive strength lines that make it easy to spot which currencies are truly strong or weak at any moment. This indicator is particularly useful for visualizing currency correlations and divergence
          You can change the time period of the chart at the touch of a button. You can also change multiple charts at the touch of a button. You can also change multiple charts at the touch of a button,   saving you the trouble of changing time periods. We are live-streaming the actual operation of the system. Please check for yourself if it is usable. Please check it out for yourself. https://www.youtube.com/@ganesha_forex We do not guarantee your investment results. Investments should be made at you
          Overview Mirror Signals Service EA (Text only)   is a powerful monitoring Expert Advisor that automatically sends   real-time Telegram notifications   for all important trade events on your MetaTrader 5 account. It is engineered specifically for   signal providers ,   trade-copier operators ,   auditors ,   educators , and   professional trading services   that require immediate, detailed, and reliable reporting. Everything from   entries, exits, SL/TP changes, comment changes, trailing sto
          TP SL Bot MT5
          Ruslan Brezovskiy
          5 (1)
          TP SL Bot is a utility that automatically sets Stop Loss and Take Profit for newly opened orders in several ways. There is also a function for calculating the volume that you need to open the trade to get the desired amount with the specified Stop Loss / Take Profit size. There are several options for calculating the size and setting parameters: 1. Setting based on the amount specified by the user as a percentage of the current deposit balance. 2. Setting as the amount entered by the user. 3. Se
          MultiTimeframe Info Feed (MIF) Indicator Description: MultiTimeframe Info Feed (MIF) is a smart MQL5 indicator that displays a dynamic, real-time info panel directly on your chart, offering powerful insight into current market conditions. Key features include: Real-time display of Open, High, Low, Close, and live Tick price Tick Rate (ticks per second) for assessing market activity Auto-calculated Entry Price on new candle formation Signal direction detection (BUY / SELL) Price action pattern re
          FREE
          Inverted_Chart_EA Utility Expert Advisor Inverted_Chart_EA creates and maintains a mirror-inverted chart of any symbol and timeframe. It automatically generates a custom instrument (e.g. US30_INV ) and keeps its price history updated in real time, with bars mirrored around a chosen pivot. This utility gives traders a new way to analyze the market from a different perspective by flipping the chart upside down. Why use an inverted chart? Highlight hidden patterns – price formations that look ordin
          The utility displays in a convenient form the historical trades made on the account. You can filter trades by magic or comcent, display only profitable or losing trades, and only buy or sell trades. Using this utility, you can see trade entry and exit points, stop loss and take profit levels, trade profit, magic number and comment, order ticket and order size - you only need to run the utility on the chart of the currency pair you want information on get and customize the input parameters. MT4
          Turbo Close All is a powerful and versatile script designed to help traders quickly and efficiently manage their trading positions and pending orders on MetaTrader 5. With its advanced features and customizable settings, this script is an essential tool for traders who want to streamline their trading process and maintain control over their positions and orders. Key Features: Comprehensive Closing Options: Turbo Close All allows you to close all market positions and/or delete pending orders bas
          RiskCopilot
          Carlos Adrian Feged Zapata
          日本語 RiskCopilot Utility - あなたのインテリジェント取引アシスタント "リスクを見て、取引をマスターする" RiskCopilot UtilityはMetaTrader 5における究極のリスク管理とポジションサイジングソリューションです。この包括的な取引アシスタントは、リアルタイム計算、高度なリスク評価ツール、プロフェッショナルな取引分析を提供し、あなたの取引決定をコントロールすることはありません。すべての資産クラスで正確なリスク管理を求める初心者からプロのトレーダーまで完璧です。 あなたは戦略に集中し、私たちが計算を処理します。 主要機能: インテリジェントポジションサイジング : カスタマイズ可能なリスク割合と口座残高に基づく自動計算 マルチ通貨サポート : USD、EUR、GBP、JPY、AUD、CAD、CHFおよびその他の主要通貨 スプレッド監視システム : 異なる商品に対する適応的制限を持つインテリジェントフィルタリング リアルタイム市場情報 : キャンドルタイマー、市場ステータス、ローカル時間とサーバー時間 高度な手数料管理 : ロット当
          Timeframe Trading Limiter
          AL MOOSAWI ABDULLAH JAFFER BAQER
          Timeframe Trading Limiter is a professional risk management and trade discipline utility designed for MetaTrader 5. It empowers traders to enforce strict, automated limits on the number of trades and the maximum allowable drawdown within each trading period, based directly on the chart timeframe selected. Whether you are a discretionary trader prone to overtrading, a prop firm challenge participant needing to adhere to strict rules, or an algorithmic trader running multiple strategies, this tool
          SL TP Panel — Visual Trading Panel for MT5 A convenient trading panel that lets you place pending orders by simply dragging lines on the chart. Stop Loss, Take Profit, order type, and lot size — everything is controlled with your mouse in seconds. Who is this for This panel is designed for manual traders who value speed of execution. Instead of opening the order window, filling in fields, and calculating levels — just drag a line to the desired price and click one button. Key Features Visua
          このプロダクトを購入した人は以下も購入しています
          Trade Assistant MT5
          Evgeniy Kravchenko
          4.42 (208)
          取引 ごとのリスクの 計算、新規注文 の 簡単 な 設置、部分的 な 決済機能 を 持 つ 注文管理、 7 種類 のトレーリングストップなど 、便利 な 機能 を 備 えています 。 追加の資料と説明書 インストール手順   -   アプリケーションの手順   -   デモアカウント用アプリケーションの試用版 ライン機能 チャート上にオープニングライン、ストップロス、テイクプロフィットを表示します。この機能により、新規注文を簡単に設定することができ、注文を出す前にその特徴を確認することができます。   リスク計算 リスク計算機能は、設定されたリスクとストップロス注文のサイズを考慮して、新規注文のボリュームを計算します。ストップロスの大きさを自由に設定できると同時に、設定したリスクを守ることができます。 Lot calc ボタン - リスク 計算 を 有効 / 無効 にします 。 Risk フィールドでは 、必要 なリスクの 値 を 0 から 100 までのパーセンテージまたは 預金通貨 で 設定 します 。 設定」 タブで 、 リスク 計算 の 種類 を 選択 します :「 $ 通
          Trade Manager EAへようこそ。これは、取引をより直感的、正確、そして効率的にするために設計された究極の リスク管理ツール です。これは単なるオーダー実行ツールではなく、包括的な取引計画、ポジション管理、リスク管理のためのソリューションです。初心者から上級者、迅速な実行を必要とするスキャルパーまで、Trade Manager EAはあらゆるニーズに対応し、為替、指数、商品、暗号通貨などさまざまな市場で柔軟に対応します。 Trade Manager EAを使用すると、複雑な計算が過去のものになります。市場を分析し、エントリーポイント、ストップロス、テイクプロフィットのレベルをチャート上のラインでマークし、リスクを設定するだけで、Trade Managerが最適なポジションサイズを即座に計算し、SLとTPをピップ、ポイント、口座通貨でリアルタイムに表示します。すべての取引が簡単かつ効果的に管理されます。 主な機能: ポジションサイズ計算機 :定義されたリスクに基づいて取引サイズを瞬時に決定します。 簡単な取引計画 :エントリー、ストップロス、テイクプロフィットを設定するためのド
          Local Trade Copier EA MT5
          Juvenille Emperor Limited
          4.96 (135)
          Local Trade Copier EA MT5 による、驚くほど高速な取引コピーを体験してください。1分で簡単にセットアップできるこの取引コピー機は、同じWindowsコンピュータまたはWindows VPS上の複数のMetaTrader端末間で取引をコピーすることができ、0.5秒未満の高速コピースピードを実現します。 初心者であろうとプロのトレーダーであろうと、 Local Trade Copier EA MT5 には、あなたの特定のニーズに合わせてカスタマイズするための幅広いオプションが用意されています。これは、利益の可能性を高めたい人にとって究極のソリューションです。 今すぐ試してみて、これが市場で最も速くて簡単なトレードコピー機である理由を理解してください。 ヒント: デモアカウントで Local Trade Copier EA MT5 デモバージョンをダウンロードして試すことができます: ここ ダウンロードした無料のデモ ファイルを MT5 >> ファイル >> データ フォルダを開く >> MQL5 >> Experts フォルダに貼り付けて、ターミナルを再起動しま
          TradePanel MT5
          Alfiya Fazylova
          4.87 (152)
          Trade Panelは多機能なトレーディングアシスタントです。アプリには手動取引用の50以上のトレーディング機能が搭載されており、ほとんどの取引作業を自動化することができます。 ご注意ください!割引は期間限定で、毎週火曜日に価格が5ドルずつ上昇します(上限100ドルまで)。 購入前に、デモアカウントでアプリのデモ版をテストすることができます。デモアカウント用のアプリの試用版をダウンロードするには、次のリンクをご利用ください: https://www.mql5.com/en/blogs/post/750865 。 完全な手順 こちら 。 取引。 ワンクリックで取引操作を行うことができます: リスクを自動計算して指値注文やポジションを開く。 複数の注文やポジションをワンクリックで開く。 注文のグリッドを開く。 保留中の注文やポジションをグループごとに閉じる。 ポジションの方向を反転(Buyを閉じてSellを開く、またはSellを閉じてBuyを開く)。 ポジションをブロックする(不足している量のポジションを開くことでBuyとSellのポジション量を等しくする)。 すべてのポジションを部分的
          Farmed Hedge Yield Farming | All Markets (Manual - Hybrid - Semi/Automated EA) MULTI-ASSET SUPPORT Trade any asset available on your broker - Forex: Major, Minor, Exotic pairs - Crypto: BTC, ETH, XRP, SOL, BNB - Stocks: Apple, Tesla, Amazon, Google, etc. - Commodities: Gold, Silver, Oil, Gas - Indices: US30, NAS100, SPX500, DAX40 - Any CFD your broker offers VERIFIED TRADING RESULTS - Farmed Hedge Yield Axi Copy:  https://www.mql5.com/en/signals/2356376 - Farmed Hedge Yield Exn Copy:   https:/
          ベータリリース Telegram to MT5 Signal Trader はまもなく正式なアルファ版をリリースします。いくつかの機能はまだ開発中で、小さな不具合に遭遇する可能性があります。問題が発生した場合はぜひご報告ください。皆さまのフィードバックがソフトウェア改善に役立ちます。 Telegram to MT5 Signal Trader は、 Telegram のチャンネルやグループからの取引シグナルを自動的に MetaTrader 5 にコピーする強力なツールです。 パブリックおよびプライベートの両方のチャネルに対応し、複数のシグナル提供元を複数のMT5口座に接続可能です。ソフトウェアは高速で安定し、すべての取引を細かく制御できます。 インターフェースは直感的で、ダッシュボードとチャートは見やすく設計されており、リアルタイムで動作状況をモニターできます。 必要環境 MQL の制限により、EA は Telegram と通信するためのデスクトップアプリが必要です。 インストーラーは公式の インストールガイド にあります。 主な機能 マルチプロバイダー: 複数の Telegram
          Limited time offer: 20% off for a few days only!  - Annual subscription $360 instead of $450  - Lifetime plan $550 instead of $690 The core idea: using the user interface, you configure the parameters the chart must meet before entering a position (or positions), choose which entry models to use, and set the rules for when trading and planning should end. Lazy Trader  handles the rest: it  takes over all the routine chart watching and execution! full description  :: 3 key videos [1] ->  [2]   -
          Exp COPYLOT CLIENT for MT5
          Vladislav Andruschenko
          3.82 (34)
          MetaTrader 5 用のプロフェッショナル取引コピー機 MetaTrader 向けの高速・高性能・信頼性の高い 取引コピー機 です。 COPYLOT は、MT4 と MT5 のターミナル間で Forex 取引をコピーでき、 Hedge 口座と Netting 口座の両方に対応しています。 COPYLOT MT5 版の対応構成: - MT5 Hedge → MT5 Hedge - MT5 Hedge → MT5 Netting - MT5 Netting → MT5 Hedge - MT5 Netting → MT5 Netting - MT4 → MT5 Hedge - MT4 → MT5 Netting MT4 版 完全な説明 + DEMO + PDF 購入方法 インストール方法 ログファイルの取得方法 テストと最適化の方法 Expforex のすべての製品 MT4 ターミナルへのコピーも可能です(MT4 → MT4、MT5 → MT4): COPYLOT CLIENT for MT4 COPYLOT は、2台、3台、さらには10台のターミナル間で同時に動作できる、プロフェッ
          Footprint Chart Pro — Professional OrderFlow EA for MetaTrader 5 Version 6.34 | Professional tool for real traders | Institutional-Grade Visualization DEMO USERS - PLEASE SELECT EVERY TICK / REAL TICK WHEN TESTING AND YOU HAVE DOWNLOADED HISTORICAL DATA. IF YOU SEE A WAITING SCREEN AND IT IS NOT DOWNLOADING, IT MEANS YOU HAVE LOW HISTORICAL DATA. TRY 1 MIN AND 5 MIN FIRST ON 1 DAY DATA. ONE DAY DATA SHOULD BE THE NEWEST AND MOST CURRENT DATE. PLEASE WAIT UNTIL THE MARKET HAS ROLLED OVER PERIOD.
          Tired of complex order placement and manual calculations? Trade Dashboard is your solution. With its user-friendly interface, placing orders becomes effortless, by a single click, you can open trades, set stop loss and take profit levels, manage trade lot size, and calculate risk to reward ratios, allowing you to only focus on your strategy. Say goodbye to manual calculations and streamline your trading experience with Trade Dashboard. Download  Demo Version  right now. You can find  Details of
          Copy Cat More Trade Copier MT5 (コピーキャット MT5) は、今日の取引課題に対応して設計されたローカルトレードコピーシステムと完全なリスク管理・実行フレームワークです。プロップファームのチャレンジから個人ポートフォリオ管理まで、堅牢な実行、資本保護、柔軟な設定、高度な取引処理の組み合わせで、あらゆる状況に適応します。 コピーシステムはマスター(送信側)とスレーブ(受信側)の両方のモードで動作し、成行注文と指値注文、取引修正、部分決済、両建て決済操作のリアルタイム同期を行います。デモ口座とライブ口座、取引ログインまたは投資家ログインの両方に対応し、EA、ターミナル、またはVPSが再起動してもパーシスタント取引メモリシステムを通じて復旧を保証します。複数のマスターとスレーブをユニークIDで同時に管理でき、ブローカー間の違いはプレフィックス/サフィックス調整またはカスタムシンボルマッピングを通じて自動的に処理されます。 マニュアル/設定  | Copy Cat More MT4 | チャンネル  特別機能: 設定が簡単 — わずか30秒で完了(ビデオをご覧
          Timeless Charts
          Samuel Manoel De Souza
          5 (4)
          Timeless Charts is an advanced charting solution designed for professional traders seeking for custom charts / custom timeframes , including seconds charts / seconds timeframe, renko charts / renko bars, cluster charts / footprint charts and advanced tools present in most of the popular platforms. Unlike traditional offline charts or simplistic custom indicators, this solution constructs fully custom bars with true timestamp accuracy , down to miliseconds, allowing for a powerful and precise tr
          The product will copy all telegram signal to MT5 ( which you are member) , also it can work as remote copier.  Easy to set up, copy order instant, can work with almost signal formats, image signal,  s upport to translate other language to English Work with all type of channel or group, even channel have "Restrict Saving Content", work with  multi channel, multi MT5 Work as remote copier: with signal have ticket number, it will copy exactly via ticket number. Support to backtest signal. How to s
          Anchor: The EA Manager A coordination system for traders running multiple EAs. Anchor ensures only one EA can trade at a time, preventing conflicting positions and keeping your portfolio safer. Attach Anchor to any chart. Configure your EAs and their magic numbers. Anchor handles the rest. Built for portfolios. Built for discipline. Built for prop firms. The Problem Running multiple EAs on the same account creates risk. Two gold EAs can open opposite positions on the same candle. Three EA
          MT5 to Telegram Signal Provider は、Telegramのチャット、チャンネル、またはグループに 指定された シグナルを送信することができる、完全にカスタマイズ可能な簡単なユーティリティです。これにより、あなたのアカウントは シグナルプロバイダー になります。 競合する製品とは異なり、DLLのインポートは使用していません。 [ デモ ] [ マニュアル ] [ MT4版 ] [ Discord版 ] [ Telegramチャンネル ]  New: [ Telegram To MT5 ] セットアップ ステップバイステップの ユーザーガイド が利用可能です。 Telegram APIの知識は必要ありません。必要な全ては開発者から提供されます。 主な特長 購読者に送信する注文の詳細をカスタマイズする機能 例えば、Bronze、Silver、Goldといった階層型のサブスクリプションモデルを作成できます。Goldサブスクリプションでは、すべてのシグナルが提供されます。 id、シンボル、またはコメントによって注文をフィルターできます 注文が実行されたチャート
          Helios Pulse v1.03 — リアルタイム確率ダッシュボード|裁量トレーダー向け Helios Pulseは、マーケットの読み方を根本から変えます。複数のインジケーターウィンドウを切り替えながら矛盾するシグナルを解読する必要はもうありません。ひとつの明確な答え——現在のマーケットの方向性バイアスを示すリアルタイム確率パーセンテージが、ティックごとに連続更新されます。 これは単なるシグナル矢印パネルではありません。Helios Pulseは、複数のテクニカル分析次元の一致度を測定し、本当に信頼できる確信度スコアを算出する確率エンジンです。方向だけでなく、その方向がどれほど確かなのか——そしてそれがリアルタイムで強まっているのか弱まっているのかを見ることができます。 チャート上の表示 コンパクトなダークテーマのパネルがチャート上に配置され、ロングとショートの2つのダイナミック確率カードが表示されます。マーケット状況の変化に応じて、カードの色の強度が淡色から鮮明に変化し、数値を確認する前に瞬時に視覚的な判断が得られます。明確な判定ラベルが現在の状態を表示します:Strong Bu
          Seconds Chart - MetaTrader 5で秒足チャートを作成するユニークなツールです。 Seconds Chart を使用すると、秒単位のタイムフレームでチャートを構築でき、標準的な分足や時間足チャートでは得られない柔軟性と分析精度を実現します。例えば、 S15 は15秒足を表します。カスタムシンボルをサポートしているインジケーターやEAをすべて使用できます。標準的なチャートと同様に便利に操作できます。 標準的なツールとは異なり、 Seconds Chart は超短期のタイムフレームでも高い精度と遅延なく作業できるように設計されています。 Seconds Chartの利点 1秒から900秒 までのタイムフレームをサポート。 組み込みのティックデータベースにより、ヒストリカルデータを 瞬時にロード 。 リアルタイムでデータが更新され、 遅延やラグなし 。 複数の秒足チャートを同時に作成可能。 Seconds Chartが最適な用途 スキャルピング や高頻度取引。 正確なエントリーとエグジット。 短期タイムフレームでの取引戦略のテスト。 タイムフレームの設定 デフォルトの設
          HINN MAGIC ENTRY – the ultimate tool for entry and position management! Place orders by selecting a level directly on the chart! full description   ::  demo-version  :: 60-sec-video-description Key features: - Market, limit, and pending orders - Automatic lot size calculation - Automatic spread and commission accounting - Unlimited partitial take-profits  - Breakeven and trailing stop-loss and take-profit  functions - Invalidation leves - Intuitive, adaptive, and customizable interface - Works
          EA Auditor
          Stephen J Martret
          5 (1)
          EA AUDITOR — EA and Signal Verification Tool for MetaTrader 5 EA Auditor is an independent analysis tool for traders evaluating Expert Advisors and trading signals on MetaTrader 5. It audits backtest reports, reviews posted developer signals, and cross-verifies the two against each other to help traders assess strategies before committing capital. The MQL5 market offers a wide range of Expert Advisors from many developers, with varying approaches, quality, and transparency. EA Auditor provides a
          Ultimate Extractor - Professional Trading Analytics for MT5 *****this is the local HTML version of Ultimate Extractor. !!!!!it is not compatible with Cloud!!!! For the online version please reach out to me directly****** Ultimate Extractor transforms your MetaTrader 5 trading history into actionable insights with comprehensive analytics, interactive charts, and real-time performance tracking. What It Does Automatically analyzes your MT5 trading history across all Expert Advisors and generates
          Trader Evolution
          Siarhei Vashchylka
          5 (7)
          " Trader Evolution " - A utility designed for traders who use wave and technical analysis in their work. One tab of the utility is capable of money management and opening orders, and the other can help in making Elliott wave and technical analysis. Manual (Be sure to read before purchasing) | Version for MT4 Advantages 1. Trading in a few clicks. Immediate and pending orders are available in the panel 2. Money management. The program automatically selects the appropriate lot size 3. Simplifies
          Easy Trade – シンプルかつ強力なスマートトレード管理 Easy Trade は、リスクを適切にコントロールし、スムーズな取引執行を実現したい MetaTrader ユーザーのためのオールインワン・トレードマネジメントソリューションです。 トレーダーの声をもとにゼロから設計された Easy Trade は、複数シンボルの取引を簡単に実行・監視・管理できるようにし、作業フローを複雑にしません。 手動スキャルピングでも、少数のセットアップを管理するポートフォリオでも、Easy Trade は賢明な判断と安定した成果に集中できるようサポートします。 ⸻ なぜ Easy Trade を使うべきか? 精密なリスク管理:固定ロットサイズまたはパーセンテージによるリスク設定が可能。リアルタイムでリスクとリワード情報を確認。 バスケット型トレーリング:複数の取引の利益を監視。目標到達で部分利益を自動確保。 取引の自動記録:各取引をスクリーンショットで記録。ジャーナル記録やパフォーマンス分析に最適。 時限クローズ機能:指定日時での自動クローズ設定が可能。週末前や取引終了時に便利。 カス
          Trade Manager DashPlus
          Henry Lyubomir Wallace
          5 (13)
          DashPlus は、MetaTrader 5プラットフォーム上での取引効率と効果を向上させるために設計された高度なトレード管理ツールです。リスク計算、注文管理、高度なグリッドシステム、チャートベースのツール、パフォーマンス分析など、包括的な機能を提供します。 主な機能 1. リカバリーグリッド 逆境の市場環境下で取引を管理するための平均化および柔軟なグリッドシステムを実装します。 取引回復のための戦略的なエントリーおよびエグジットポイントを可能にします。 2. スタックグリッド 強い市場の動きの中でポジションを追加することで、有利な取引での潜在的なリターンを最大化するように設計されています。 トレンド市場で利益を得られるよう、勝ち取引を拡大します。 3. 損益(P&L)ライン チャート上に直接、潜在的な利益と損失のシナリオを視覚的に表示します。 設定を調整し、P&Lラインをドラッグして、実行前にさまざまな取引結果を評価します。 4. バスケットモード 同じシンボルでの複数ポジションの管理を簡素化し、それらを単一の集約ポジションにまとめます。 平均価格に基づいて、ストップロスやテイクプ
          Poc Breakout Signal: The Ultimate Institutional Order Flow & Price Action System Elevate your trading with Poc Breakout, a comprehensive technical analysis tool designed to bridge the gap between retail trading and institutional market understanding. This all-in-one system combines powerful Buy/Sell signals, advanced Volume Profile analysis, real-time Order Flow (Depth of Market), and critical macroeconomic data to give you a clear, unambiguous edge in the markets. Poc Breakout Signal decodes c
          This EA Utility allows you to manage (with advanced filtering) unlimited open orders (manual or EA) with 16 trailing stop methods: fixed, percent, ATR Exit, Chandelier Exit, Moving Average, Candle High Low Exit, Bollinger Bands, Parabolic, Envelope, Fractal, Ichimoku Kijun-Sen, Alligator, Exit After X Minutes or Bars, RSI and Stochastic. The trailing stop can be either real or virtual, and you can exit fully or with a partial close percent on touch or bar close.  Moreover, you can add (override
          Smart Stop Scanner – マルチアセット対応の市場構造型ストップロス分析システム 概要 Smart Stop Scanner は、複数の市場にわたるストップロス構造をプロフェッショナル品質で監視するために設計されたツールです。 実際の市場構造、重要なブレイクアウト、価格アクションロジックに基づいて最も意味のあるストップゾーンを自動的に検出し、 高精細(DPI対応)で見やすい統一パネルに表示します。 Forex、ゴールド、インデックス、メタル、暗号資産など幅広い市場に対応しています。 ストップレベルの算出方法 従来型のインジケーターや任意の計算式は使用していません。 代わりに、 ブレイクアウト、より高い高値、より低い安値 といった実際の市場構造イベントを検出します。 ストップレベルはこれらの構造ポイントから直接生成されるため、より自然で信頼性が高く、 実際の市場動向に即したストップ設定が可能になります。 主なハイライト • 高精度のマルチアセット対応 Forex、メタル、ゴールド、インデックス、暗号資産など、幅広い銘柄をサポートし、桁数やティックサイズを自動処
          Custom Alerts:複数市場を監視し、重要なチャンスを見逃さない 概要 Custom Alerts は、複数の銘柄にまたがるトレードチャンスを一元的に監視したいトレーダーのためのダイナミックなソリューションです。FX Power、FX Volume、FX Dynamic、FX Levels、IX Power などの主要ツールと連携し、複数のチャートを切り替える手間なく、重要な市場変動を自動で通知します。ブローカーが提供するすべての資産クラスに対応しており、シンボルを入力する必要はありません。設定で資産クラスを選択するだけで、すぐにアラートを構成できます。 1. Custom Alerts がトレーダーにとって非常に有益な理由 オールインワンの市場監視 • Custom Alerts は、為替、金属、暗号資産、指数、株式(ブローカーが対応している場合)からのシグナルを収集・統合します。 • 複数のチャートを切り替える必要がなくなり、明確で一元化された通知が得られます。 戦略に合わせたアラート構成 • ボリューム急増、通貨強弱の閾値、極端な価格変動など、目的に応じたアラート
          この製品は、ニュースタイム中にすべてのエキスパートアドバイザーと手動チャートをフィルタリングするため、急激な価格変動によるマニュアルトレードのセットアップの破壊や他のエキスパートアドバイザーによって入力された取引について心配する必要はありません。この製品には、ニュースのリリース前にオープンポジションとペンディングオーダーを処理できる完全な注文管理システムも付属しています。 The News Filter  を購入すると、将来のエキスパートアドバイザーのためにビルトインのニュースフィルターに頼る必要はなく、今後はすべてのエキスパートアドバイザーをここからフィルタリングできます。 ニュース選択 ニュースソースは、Forex Factoryの経済カレンダーから取得されます。 USD、EUR、GBP、JPY、AUD、CAD、CHF、NZD、CNYなど、任意の通貨数に基づいて選択できます。 Non-Farm(NFP)、FOMC、CPIなどのキーワード識別に基づいて選択することもできます。 影響レベルによってフィルタリングするニュースを選択することができ、低、中、高の影響範囲から選択できます。
          This is exactly what the name says. Visual strategy builder . One of a kind. Turn your trading strategies and ideas into Expert Advisors without writing single line of code. Generate mql source code files with a few clicks and get your fully functional Expert Advisors, which are ready for live execution, strategy tester and cloud optimization. There are very few options for those who have no programming skills and can not create their trading solutions in the MQL language. Now, with Bots Builde
          Cerberus Equity Watcher
          Samuel Bandi Roccatello
          5 (3)
          Cerberus the Equity Watcher はリスク管理ツールであり、アカウントの資産を常に監視し、不完全な EA や裁量的なトレーダーの場合は感情的な行動によって引き起こされる大きなドローダウンを回避します。これは、バグを含む可能性のある EA や、予想外の市況でうまく機能しない可能性のある EA に依存するシステマティック トレーダーにとって非常に役立ちます。 Cerberus では、最小エクイティ値と (オプションで) 最大値を設定できます。これらのいずれかに達すると、すべてのポジションがフラットになり、すべての未決注文がクローズされ、すべての EA が「強制終了」されます。すべての位置を平坦化すると、ユーザーの携帯電話に通知が送信され、画面に明確なメッセージが表示されます。 「平坦化」の後、Cerberus は株式価値を監視し続け、再初期化されるまでそれ以上の取引の試みを停止し続けます。 Cerberus によって実行されるすべての操作は、画面に明確に表示され、Expert advisor タブに報告され、通知がユーザーに送信されます。ユーザーのミスを避けるために、
          作者のその他のプロダクト
          Time Scale for MT5
          Taras Slobodyanik
          4.77 (30)
          The indicator draws the time scale on the chart. You can specify the time offset, adjust the size and font to display on the chart ( it is displaying your local time on your chart instead of MT time ). You can also select the desired format for displaying the date and time. You may be interested in my other product , which contains a more advanced version of the Time Scale . You can also find my other products here Parameters Hours (time shift) — time shift (hours); Minutes (time shift) — time
          FREE
          ZigZag Lines MTF
          Taras Slobodyanik
          4.38 (13)
          Multi timeframe ZigZag indicator. It displays the support/resistance horizontal lines and their breakouts, as well as draws the current targets of the market. It can also display lines of the Fractals indicator and candles from other periods (up to Quarterly). So, you can actually see the supply and demand levels. Indicator – connects key lows and highs to show trend lines. You can also use it as indicator for the Break of Structure(BOS) & Market Structure Shift(MSS). The indicator redraws the
          Multi timeframe ZigZag indicator. It displays the support/resistance horizontal lines and their breakouts, as well as draws the current targets of the market. It can also display lines of the Fractals indicator and candles from other periods (up to Quarterly). So, you can actually see the supply and demand levels. Indicator – connects key lows and highs to show trend lines. You can also use it as indicator for the Break of Structure(BOS) & Market Structure Shift(MSS). The indicator redraws the
          Multi-currency and multitimeframe Heikin Ashi indicator. Shows the current state of the market. On the scanner panel you can see the direction, strength and number of bars of the current trend. The Consolidation/Reversal candles are also shown using color. You can specify any desired currencies and periods in the parameters. Also, the indicator can send notifications when the trend changes or when reversal and consolidation candles (dojis) appear. By clicking on a cell, this symbol and period wi
          インジケーターは現在のシンボルの利益(損失)を表示します。 線を自由にドラッグ&ドロップして現在の損益を表示できます。 You can find my products   here パラメーター Calculation in money or in points — 損益をポイントまたは金額で計算します。 Add pending orders to calculate — 計算では未決注文を考慮します。 Magic Number (0 - all orders on symbol) — 特定の注文を評価する必要がある場合のマジック ナンバー。 Offset for first drawing (points from the average price) — 最初の開始時の平均価格からのラインのオフセット。 Decimal places for calculating the Sum — 合計を表示するための小数点以下の桁数。 Decimal places for calculating the Percentage — パーセンテージを表示するための小数点以下の桁数。
          FREE
          Pro Sessions MT4
          Taras Slobodyanik
          4.75 (4)
          This is an indicator of trading sessions  that can display all levels (Open-High-Low-Close) for four sessions. The indicator can also predict session levels. Sessions can be drawn with lines or rectangles (empty or filled), lines can be extended to the next session. You can easily hide/show each session by pressing hotkeys (by default '1', '2', '3', '4'). You can see ASR (Average Session Range) lines  (default hotkey 'A'). This is similar to the ADR calculation, only it is calculated based on t
          相対力指数 (RSI) インジケーターのマルチ通貨およびマルチタイムフレームの変更。パラメータで任意の通貨とタイムフレームを指定できます。また、パネルは買われすぎレベルと売られすぎレベルを越えたときに通知を送信できます。ピリオドのあるセルをクリックすると、このシンボルとピリオドが開きます。これが MTF スキャナーです。 ダッシュボードをチャートから非表示にするキーは、デフォルトでは「D」です 通貨強度メーター (CSM) と同様に、ダッシュボードは、指定された通貨を含むペア、またはその通貨を基本通貨とするペアを自動的に選択できます。インジケーターは、「ペアのセット」で指定されたすべてのペアで通貨を検索します。他のペアは無視されます。そして、これらのペアに基づいて、この通貨の合計 RSI が計算されます。そして、その通貨がどれだけ強いか弱いかを確認できます. パラメータ RSI Period — 平均期間。 RSI Applied price — 価格タイプ。 Clear the chart at startup — 起動時にチャートをクリアします Set of Pairs
          ストキャスティクス オシレーターのマルチ通貨およびマルチタイムフレームの変更。パラメータで任意の通貨とタイムフレームを指定できます。パネルには、シグナルとメイン (ストキャスティクス クロスオーバー) のラインの現在の値と交差点が表示されます。また、インジケーターは、買われすぎレベルと売られすぎレベルを横切るときに通知を送信できます。ピリオド付きのセルをクリックすると、このシンボルとピリオドが開きます。これが MTF スキャナーです。 通貨強度メーター (CSM) と同様に、ダッシュボードは、指定された通貨を含むペア、またはその通貨を基本通貨とするペアを自動的に選択できます。インジケーターは、「ペアのセット」で指定されたすべてのペアで通貨を検索します。他のペアは無視されます。これらのペアに基づいて、この通貨の合計ストキャスティクスが計算されます。そして、その通貨がどれだけ強いか弱いかを確認できます。 ダッシュボードをチャートから非表示にするキーは、デフォルトでは「D」です パラメータ %K Period — K ラインの期間。 %D Period — D ラインの期間。 Slo
          このインジケーターは、ジグザグインジケーター、取引セッション、フラクタル、またはローソク足(非標準の時間枠:年、6 か月、4 か月、3 か月、2 か月を含む)に基づいてフィボナッチ レベルを自動的に描画します(自動フィボ リトレースメント)。 フィボナッチ計算には、より高い時間枠を選択できます。 現在のバーが閉じるたびにレベルが再描画されます。 指定したレベルを超えたときにアラートを有効にすることができます。 履歴のレベルを分析することもできます。 これを行うには、「過去の Fibo レベルの数」パラメーターで Fibo レベルの数を指定する必要があります パラメーター Calculate Fibo according to — フィボナッチ計算モード: Candles (High-Low) — 高値-安値に基づいてフィボナッチを構築します。 Candles (Close-Close) — 終値-終値に基づいてフィボナッチを構築します。 ZigZags — ZigZag ポイントによって Fibo を構築します。 Sessions — 取引セッションごとに Fibo を構築し
          Multicurrency and multi-timeframe indicator Inside Bar (IB). In the parameters, you can specify any desired currencies and timeframes. The panel displays the last found Inside Bar (and Mother Bar) pattern, the current price position and the breakout of the levels of the Mother and Inside Bars. You can set the size and color for bars and text in the cells. The indicator can also send notifications when levels are broken. The dashboard highlights Double Inside Bar in a special color. By clicking
          Multicurrency and multitimeframe modification of the ZigZag indicator. Displays the current direction of the market, the height of the last movement, the number of bars in this movement and the breaking of the previous point of the ZigZag (horizontal line). This is MTF Scanner, you can actually see the supply and demand levels You can specify any desired currencies and timeframes in the parameters. Also, the panel can send notifications when the ZigZag changes direction or when there was a bre
          Multi-timeframe indicator Relative Strength Index displays information simultaneously from different periods in one subwindow of the chart. Parameters Period of averaging — averaging period for the RSI calculation. Type of price — price used. Timeframes for RSI — list of periods, separated by a space or comma or semicolon. Number of bars for each period — the number of bars displayed for each period. Sort periods — sort periods if they are listed in no particular order. Current period first — d
          ADX インジケーターは、トレンドとその強さを判断するために使用されます。価格の方向は +DI と -DI の値で示され、ADX 値はトレンドの強さを示します。+DI が -DI より上であれば、市場は上昇傾向にあり、反対であれば下降傾向にあります。ADX が 20 より下であれば、明確な方向性はありません。インジケーターがこのレベルを突破するとすぐに、中程度の強さのトレンドが始まります。40 を超える値は、強いトレンド (下降トレンドまたは上昇トレンド) を示します。 平均方向性指数 (ADX) インジケーターの複数通貨および複数時間枠の変更。パラメータで任意の通貨と時間枠を指定できます。また、インジケーターは、トレンドの強さのレベルが交差したとき、および +DI と -DI のラインが交差したときに通知を送信できます。ピリオドの付いたセルをクリックすると、このシンボルと期間が開きます。これが MTF スキャナーです。 通貨強度メーター (CSM) と同様に、ダッシュボードは、指定された通貨を含むペア、またはその通貨を基本通貨とするペアを自動的に選択できます。インジケーターは、
          相対力指数 (RSI) インジケーターのマルチ通貨およびマルチタイムフレームの変更。パラメータで任意の通貨とタイムフレームを指定できます。また、パネルは買われすぎレベルと売られすぎレベルを越えたときに通知を送信できます。ピリオドのあるセルをクリックすると、このシンボルとピリオドが開きます。これが MTF スキャナーです。 ダッシュボードをチャートから非表示にするキーは、デフォルトでは「D」です 通貨強度メーター (CSM) と同様に、ダッシュボードは、指定された通貨を含むペア、またはその通貨を基本通貨とするペアを自動的に選択できます。インジケーターは、「ペアのセット」で指定されたすべてのペアで通貨を検索します。他のペアは無視されます。そして、これらのペアに基づいて、この通貨の合計 RSI が計算されます。そして、その通貨がどれだけ強いか弱いかを確認できます. パラメータ RSI Period — 平均期間。 RSI Applied price — 価格タイプ。 Clear the chart at startup — 起動時にチャートをクリアします Set of Pairs
          ストキャスティクス オシレーターのマルチ通貨およびマルチタイムフレームの変更。パラメータで任意の通貨とタイムフレームを指定できます。パネルには、シグナルとメイン (ストキャスティクス クロスオーバー) のラインの現在の値と交差点が表示されます。また、インジケーターは、買われすぎレベルと売られすぎレベルを横切るときに通知を送信できます。ピリオド付きのセルをクリックすると、このシンボルとピリオドが開きます。これが MTF スキャナーです。 通貨強度メーター (CSM) と同様に、ダッシュボードは、指定された通貨を含むペア、またはその通貨を基本通貨とするペアを自動的に選択できます。インジケーターは、「ペアのセット」で指定されたすべてのペアで通貨を検索します。他のペアは無視されます。これらのペアに基づいて、この通貨の合計ストキャスティクスが計算されます。そして、その通貨がどれだけ強いか弱いかを確認できます。 ダッシュボードをチャートから非表示にするキーは、デフォルトでは「D」です パラメータ %K Period — K ラインの期間。 %D Period — D ラインの期間。 Slo
          Multi-currency and multi-timeframe indicator MACD. The dashboard can display both the Traditional (true) MACD and the MACD which is built into MetaTrader. On the panel you can see the current state of the indicator — the direction of movement of the MACD lines, their intersection and a pop-up window with the indicator chart. In the parameters you can specify any desired pairs-symbols and timeframes. The scanner can also send notifications about lines crossing each other and about lines crossing
          Easy Grider
          Taras Slobodyanik
          4.5 (2)
          The EA creates an order grid using labels. Opening and closing of the grid is done either automatically by the system signals or manually. In the same grid can be both Limit and Stop orders. It is possible to reverse the grid on specified condition. You can enter the breakdown/rebound from established levels. All types of Sell limit, Buy limit, Buy stop, Sell stop orders are supported. The grid is rebuilt with a single click. The stop loss and take profit lines can be easily modified You are fre
          Time Scale
          Taras Slobodyanik
          4.87 (15)
          The indicator draws the time scale on the chart. You can specify the time offset, adjust the size and font to display on the chart (it is displaying your local time on your chart instead of MT time). You can also select the desired format for displaying the date and time. While holding down the middle mouse button, and moving the cursor, a slider will appear on the scale. You may be interested in my other product , which contains a more advanced version of the Time Scale. You can also find my o
          FREE
          Lines Profit Loss
          Taras Slobodyanik
          4.65 (17)
          インジケーターは現在のシンボルの利益(損失)を表示します。 線を自由にドラッグ&ドロップして現在の損益を表示できます。 You can find my products   here パラメーター Calculation in money or in points — 損益をポイントまたは金額で計算します。 Add pending orders to calculate — 計算では未決注文を考慮します。 Magic Number (0 - all orders on symbol) — 特定の注文を評価する必要がある場合のマジック ナンバー。 Offset for first drawing (points from the average price) — 最初の開始時の平均価格からのラインのオフセット。 Decimal places for calculating the Sum — 合計を表示するための小数点以下の桁数。 Decimal places for calculating the Percentage — パーセンテージを表示するための小数点以下の桁数。
          FREE
          The indicator has three main tools: Magnifier (Zoom chart), Ruler  ( Time and Price scales ),   and Crosshair. You can move it all around with your mouse and customize different formats for  displaying , customize   size and color of each element. The Magnifier (zoom chart) allows you to display candles from any time frame and at different scales. Hotkeys: 'Q' - higher timeframe, 'A' - lower timeframe, 'W' - decrease candle size, 'S' - increase candle size, 'Z' - show/hide zoom chart You can
          The indicator has three main tools: Magnifier (Zoom chart), Ruler  ( Time and Price scales ),   and Crosshair. You can move it all around with your mouse and customize different formats for  displaying , customize   size and color of each element. The Magnifier (zoom chart) allows you to display candles from any time frame and at different scales. Hotkeys: 'Q' - higher timeframe, 'A' - lower timeframe, 'W' - decrease candle size, 'S' - increase candle size, 'Z' - show/hide zoom chart. You can
          このインジケーターは、他の(および非標準)時間枠の高値/安値/始値/終値レベルを示します - 年、6 か月、4 か月、3 か月、2 か月、月、週、日、H3-H6-H8-H12 時間 M45 M90。 キャンドルを開くシフトを設定し、仮想キャンドルを構築することもできます。 これらの時間枠のいずれかの「期間区切り記号」は、垂直線の形式で使用できます。 現在または以前のレベルのブレイクアウト (昨日/先週の高値/安値ラインのブレイクアウトなど) に対してアラートを設定できます。 すべてのレベルを 1 ピリオド右にシフトすることもできます。 つまり、前の期間の高値/安値が現在の期間に表示されます. パラメーター Number of levels to calculate (0-all) — 画面に表示されるバーの数。 Change the opening of bars (hours) — ローソク足の始点を n 時間ずつシフトします。 インジケーターは、新しい開始時間を考慮して仮想バーを描画します。 MN1 より上の期間は変更されません。 Move the levels to th
          移動平均 (MA) インジケーターのマルチ通貨およびマルチタイムフレームの変更。ダッシュボードでは、インジケーターの現在の状態 (Fast MA と Slow MA のブレイクアウトとタッチ (価格別)、および MA ライン同士の交差 (移動平均クロスオーバー)) を確認できます。パラメーターでは、任意の通貨とタイムフレームを指定できます。また、インジケーターは、価格がラインに触れたことやラインが交差したことについて通知を送信できます。ピリオド付きのセルをクリックすると、このシンボルと期間が開きます。これは MTF スキャナーです。チャート上で複数のダッシュボードを実行できます。 インジケーターは、現在のチャートに Fast MA と Slow MA ラインを表示します。チャートの MA タイムフレームを選択し、他のタイムフレーム (MTF MA) から MA を監視できます。2 セットの MA のホットキーは、デフォルトでは「1」と「2」です。 ダッシュボードをチャートから非表示にするキーは、デフォルトでは「D」です パラメーター Fast MA Averaging per
          This dashboard displaying current news from ForexFactory.com (calendar FFC) and from the Investing.com website . You can sort news by impact and by country, and display them on the chart with one click. By holding down the 'Ctrl' key, you can select several different 'currencies' or 'impacts' to sort. Also, this utility shows not only the forecast, but also the actual values ​​after they appear on the site. You can set a separate notification for each news. You can read the news using your EA
          The Gann Box (or Gann Square) is a market analysis method based on the "Mathematical formula for market predictions" article by W.D. Gann. This indicator can plot three models of Squares: 90, 52(104), 144. There are six variants of grids and two variants of arcs. You can plot multiple squares on one chart simultaneously Parameters Square — selection of a Gann square model: 90 — square of 90 (or square of nine); 52 (104) — square of 52 (or 104); 144 — universal square of 144; 144 (full) — "full
          ADX Dashboard
          Taras Slobodyanik
          5 (5)
          ADX インジケーターは、トレンドとその強さを判断するために使用されます。価格の方向は +DI と -DI の値で示され、ADX 値はトレンドの強さを示します。+DI が -DI より上であれば、市場は上昇傾向にあり、反対であれば下降傾向にあります。ADX が 20 より下であれば、明確な方向性はありません。インジケーターがこのレベルを突破するとすぐに、中程度の強さのトレンドが始まります。40 を超える値は、強いトレンド (下降トレンドまたは上昇トレンド) を示します。 平均方向性指数 (ADX) インジケーターの複数通貨および複数時間枠の変更。パラメータで任意の通貨と時間枠を指定できます。また、インジケーターは、トレンドの強さのレベルが交差したとき、および +DI と -DI のラインが交差したときに通知を送信できます。ピリオドの付いたセルをクリックすると、このシンボルと期間が開きます。これが MTF スキャナーです。 通貨強度メーター (CSM) と同様に、ダッシュボードは、指定された通貨を含むペア、またはその通貨を基本通貨とするペアを自動的に選択できます。インジケーターは、
          Multicurrency and multitimeframe modification of the indicator Bollinger Bands. On the dashboard you can see breakouts and touches of the Bollinger Bands. In the parameters you can specify any desired currencies and timeframes. The indicator can also send notifications when the price touches the Bollinger Bands, when the current volatility changes (expands or falls), and when the price touches all the bands. By clicking on a cell with a period, this symbol and period will be opened. This is MTF
          このインジケーターは、他の(および非標準)時間枠の高値/安値/始値/終値レベルを示します - 年、6 か月、4 か月、3 か月、2 か月、月、週、日、H3-H6-H8-H12 時間 M45 M90。 キャンドルを開くシフトを設定し、仮想キャンドルを構築することもできます。 これらの時間枠のいずれかの「期間区切り記号」は、垂直線の形式で使用できます。 現在または以前のレベルのブレイクアウト (昨日/先週の高値/安値ラインのブレイクアウトなど) に対してアラートを設定できます。 すべてのレベルを 1 ピリオド右にシフトすることもできます。 つまり、前の期間の高値/安値が現在の期間に表示されます. パラメーター Number of levels to calculate (0-all) — 画面に表示されるバーの数。 Change the opening of bars (hours) — ローソク足の始点を n 時間ずつシフトします。 インジケーターは、新しい開始時間を考慮して仮想バーを描画します。 MN1 より上の期間は変更されません。 Move the levels to th
          This is an indicator of trading sessions  that can display all levels (Open-High-Low-Close) for four sessions . The indicator can also predict session levels. Sessions can be drawn with lines or rectangles (empty or filled), lines can be extended to the next session. You can easily hide/show each session by pressing hotkeys (by default '1', '2', '3', '4'). You can see ASR (Average Session Range) lines  (default hotkey 'A'). This is similar to the ADR calculation, only it is calculated based on
          Stochastic Oscillator displays information simultaneously from different periods in one subwindow of the chart. Parameters %K Period — K-period (number of bars for calculations). %D Period — D-period (period of first smoothing). Slowing — final smoothing. Method — type of smoothing. Price field — stochastic calculation method . Timeframes for Stochastic — list of periods, separated by a space or comma or semicolon. Number of bars for each period — the number of bars displayed for each period. S
          フィルタ:
          benny12
          350
          benny12 2025.07.17 08:59 
           

          ユーザーは評価に対して何もコメントを残しませんでした

          Jirasak Lapanalarploy
          148
          Jirasak Lapanalarploy 2024.12.12 16:09 
           

          It's really useful tool for trading multiple symbols. also great support.

          Noppadol Phompaksorn
          620
          Noppadol Phompaksorn 2024.12.12 11:14 
           

          Really great tool. Must have.

          sivorobertgmailcom
          673
          sivorobertgmailcom 2021.12.20 08:59 
           

          A terrific tool, I used it for several months now and I can't trade without it anymore. Unfortunately the Trade Manager is not synchronizing the floating positions with the MT5 Platform from Pepperstone anymore. Meaning that my actual floating positions and the floating position according to the Trade Manager Tool are way out of sync. I would very much appreciate it if you could add an additional feature on this tool. At this moment the "Take Profit" and "Stop Loss" are only shown on de individual lines of the Symbol Manager. Your tool would be of an even greater value if you could create these features on the total floating profit/loss. With other words, implementing the "Take Profit" and "Stop Loss" also on the total floating balance of the outstanding positions.

          Taras Slobodyanik
          94985
          開発者からの返信 Taras Slobodyanik 2021.12.20 09:18
          It's not clear, the last update already has "Total TP/Sl". You can write in the "Comments" tab or in private messages, this tab does not allow to exchange messages.
          Andre Gomes
          2946
          Andre Gomes 2021.03.02 13:38 
           

          This is a really great trade manager. I use it every day.

          レビューに返信