Dashboard Moving Average mt5
- ユーティリティ
- バージョン: 7.0
- アップデート済み: 9 3月 2021

Great dashboard for market analytics.
Help you to analyze the values of the Moving Average indicator and prices.
Using this dashboard you can:
- find signals from the Moving Average from all timeframes;
- find signals from the Moving Average from all symbols;
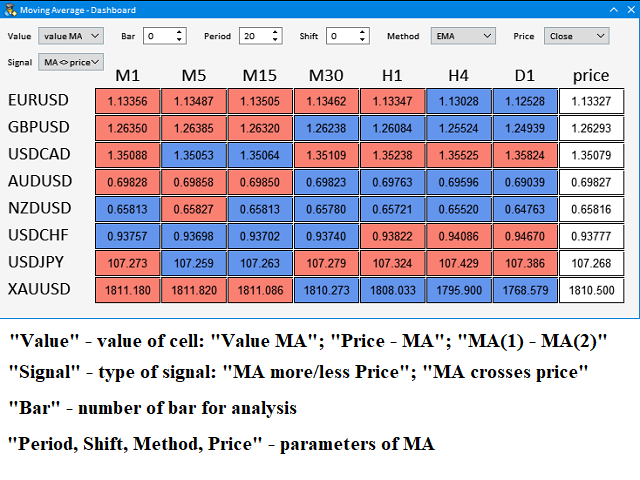
- check - how far the Moving Average is from the price;
- check - the Moving Average value has changed;
- 2 types of signal.
Modes of operation (switched by a button on the graph):
- current value of Moving Average;
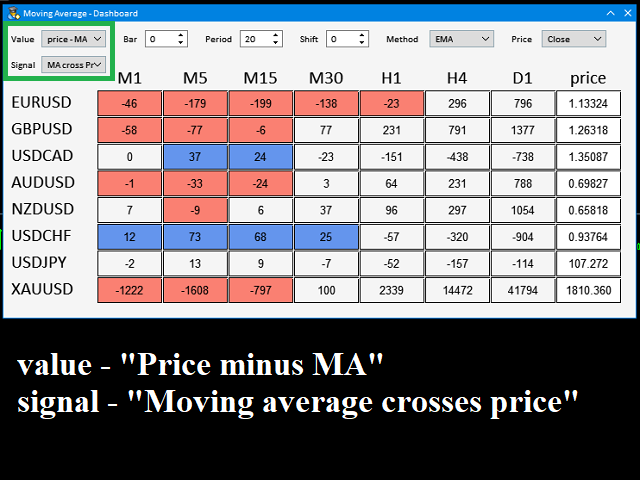
- the difference between the current price and the current value of Moving Average;
- the difference between the current Moving Average and the previous value.
Type of signal (switched by a button on the graph):
- Moving Average more/less Price;
- Moving Average crosses Price.
Work option:
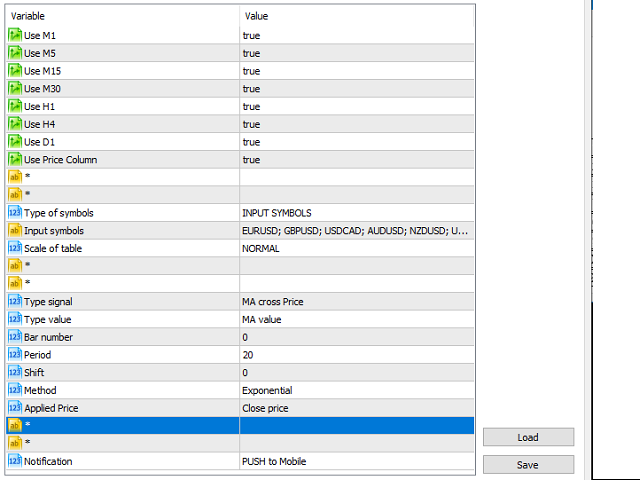
- all symbols attached to Market Watch
- current symbol only
- symbols from the list
Colour:
- if the background of the cell is “blue”, then this is a buy signal
- if the background of the cell is "red", then this is a sell signal
Notification about new signal:
- Alert to Terminal
- Print to Terminal
- Push to Mobile app
Parameters:
- type_symbols - selection of a working option: ALL SYMBOLS MARKET WATCH - all symbols from "Market Watch"; ONLY CURRENT SYMBOL - only the current symbol; INPUT SYMBOLS - symbols from the list;
- input_symbols - a list of symbols to work with (if "type_symbols" is INPUT SYMBOLS);
- MA_num_bar - number of the used bar for the analysis of Moving Average (0 - current);
- MA_period - period of the Moving Average;
- MA_shift - shift of Moving Average;
- MA_method - Moving Average method;
- MA_price - used price of Moving Average.
Dashboards (Meta Trader 4):
- BIG DASHBOARD (all in one)
- Moving Average
- Bollinger Bands
- Envelopes
- MACD
- RSI
- Ichimoku
- Stochastic
- Alligator
- Parabolic SAR
- Momentum
Dashboards (Meta Trader 5):
After use, please write your comment, this will help us make the product better.


ユーザーは評価に対して何もコメントを残しませんでした