Market Maker Dashboard by G labs
- インディケータ
- バージョン: 1.1
- アップデート済み: 26 11月 2023
- アクティベーション: 5
G-Labs Market Maker Dashboard — BTMM multi-pair scanner (Peak Formation, ADR cycle, Asian range, stop hunt, RSI)
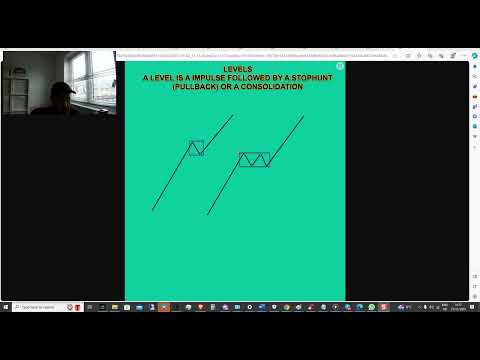
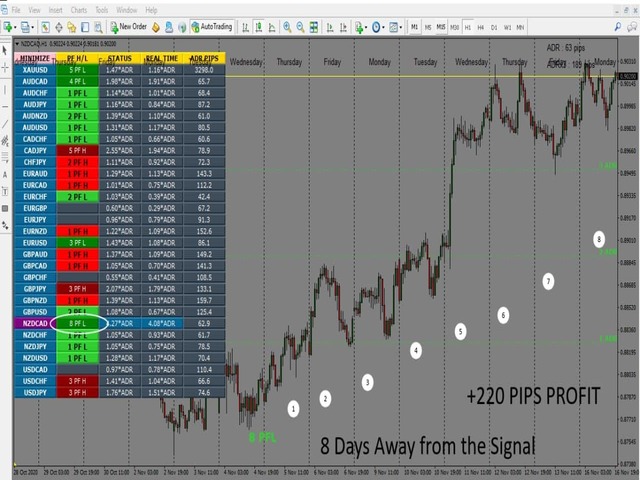
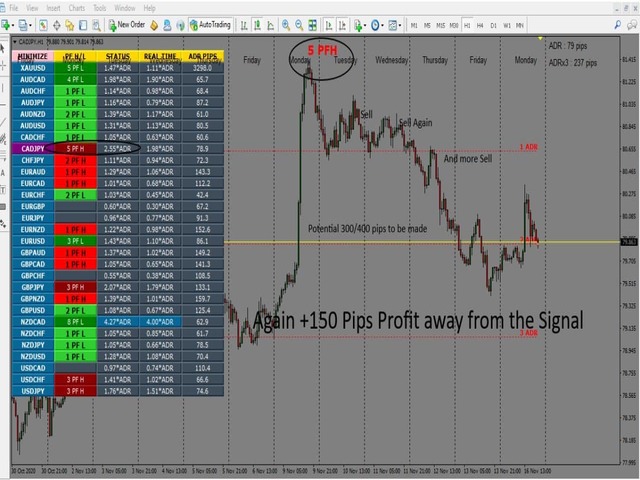
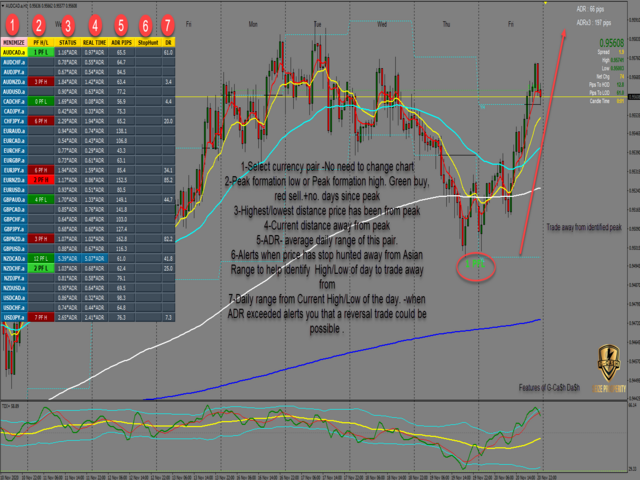
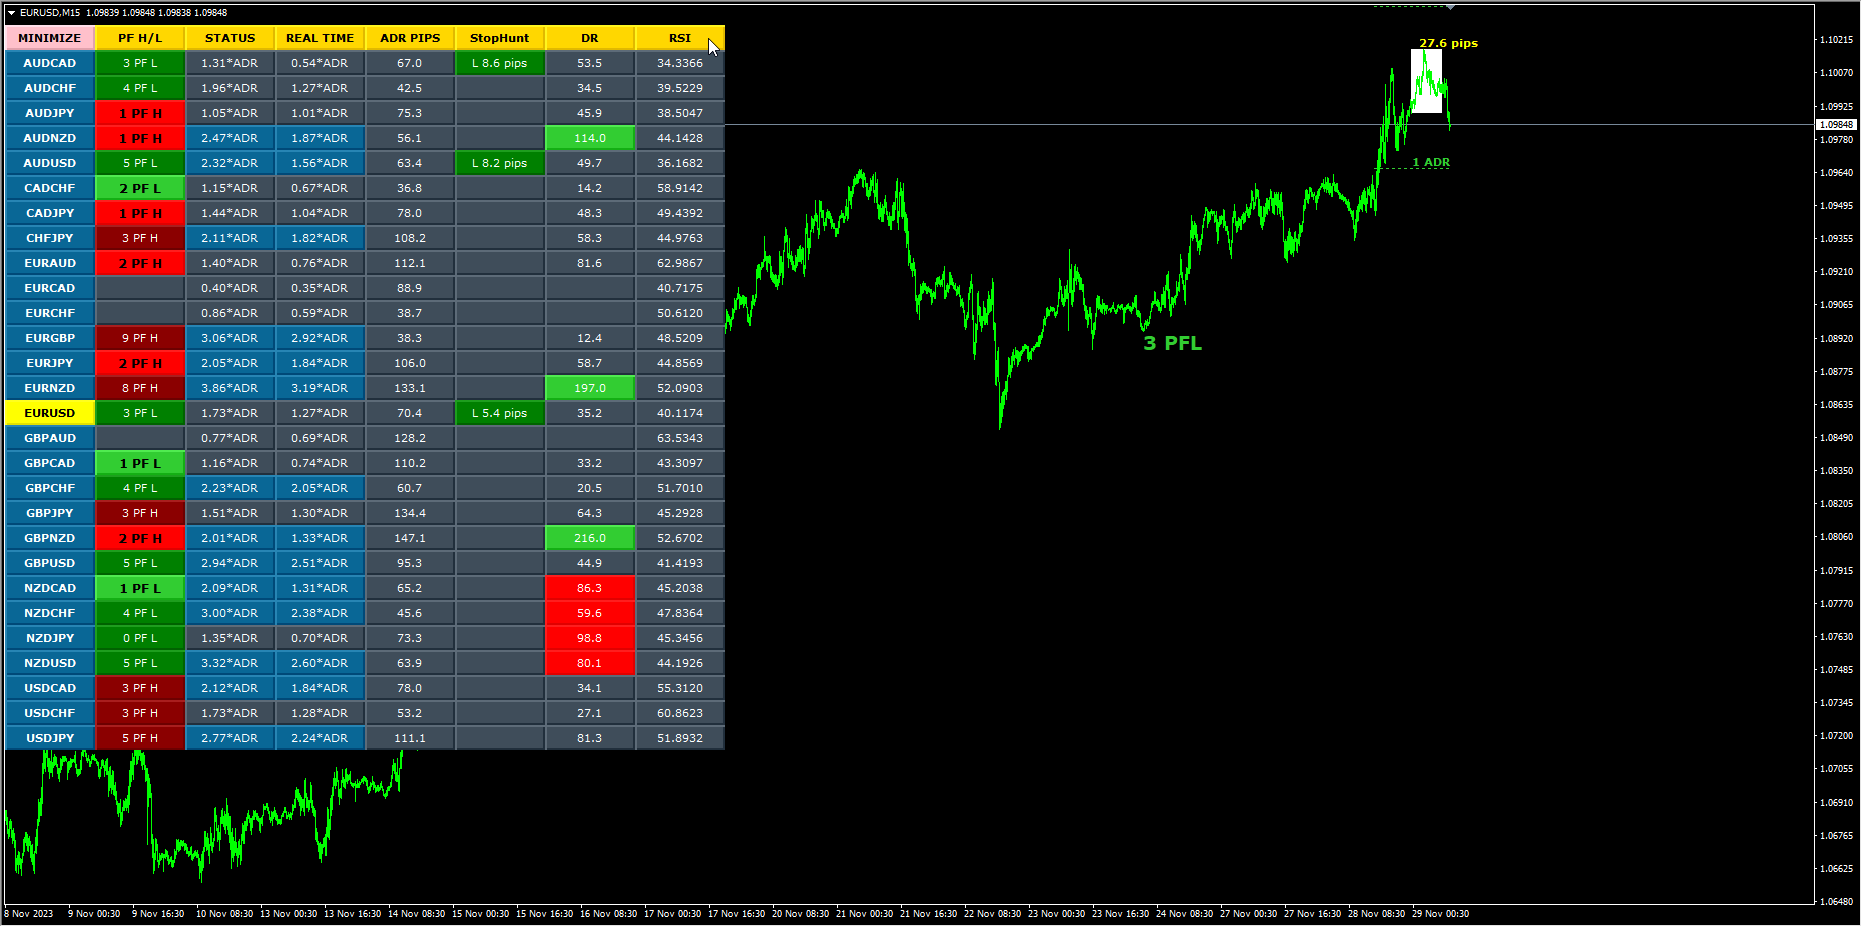
Stop guessing which pairs are “in cycle.” This dashboard scans your watchlist in real time and shows where each symbol sits in a Banks Track Market Maker (BTMM) style workflow: Peak Formation context (PFH / PFL), expansion measured in ADR multiples, Asian session range behaviour, stop-hunt proximity signals, today’s range versus ADR, and M15 RSI for timing. One panel replaces a wall of charts — click a symbol row to load it on the active chart (or open a new chart, depending on your inputs).
USER GUIDE (FREE): The full user guide download link is posted in the product COMMENTS section on this MQL5 page — open Comments after purchase to get the guide.
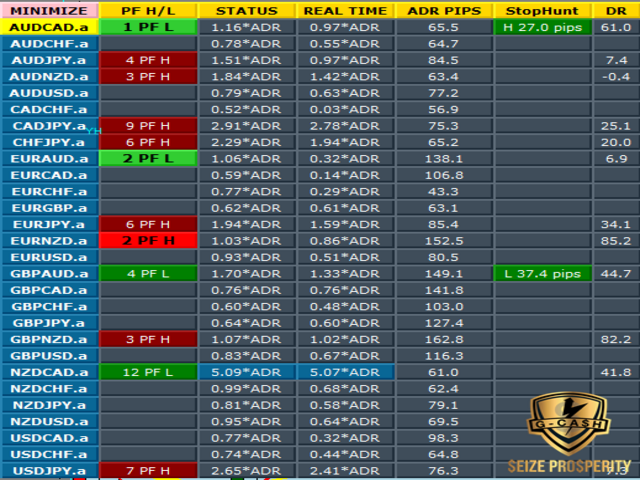
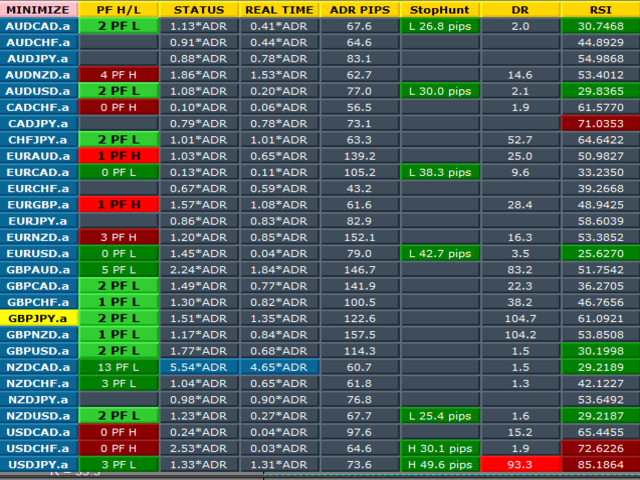
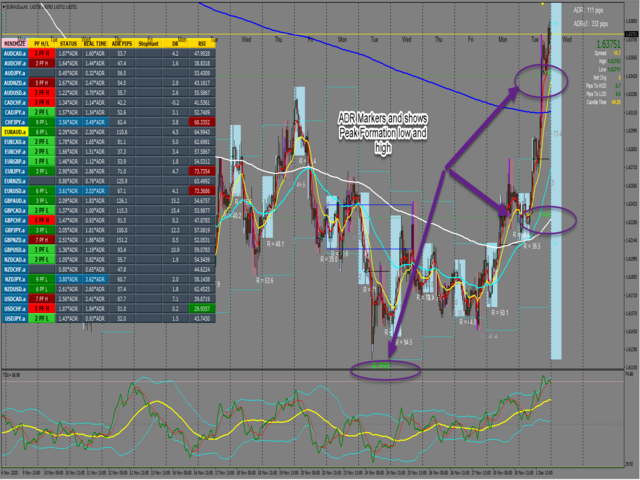
WHAT IT SCANS • Peak Formation (PFH / PFL) — labels the formation side and helps you see how the day lines up with the cycle. • ADR cycle / expansion — STATUS and REAL TIME columns show movement expressed in *ADR multiples so you can spot early-cycle vs stretched conditions (default ADR settings are configurable). • Asian session range — built from the first part of the session on H4; optional on-chart rectangle for the chart symbol when enabled. • Stop hunt column — highlights proximity to the session range extremes after the session window (with configurable pip distance filters). • Daily range (DR) — today’s range in pips vs ADR for quick “compressed or extended day” context. • RSI (M15) — live RSI with simple heat-style colouring for overbought / oversold awareness at a glance.
DASHBOARD FEATURES • Multi-symbol scanning — default list covers 28+ major FX pairs; fully configurable symbol string (broker suffixes supported). • Colour-coded cells for fast visual scanning. • Minimise toggle to reduce on-chart footprint. • Optional screen alerts and mobile push notifications for key ADR and stop-hunt events. • Optional projected 1 / 2 / 3 ADR guide lines on the active chart symbol when lines are enabled.
WHO IT IS FOR Traders learning or applying BTMM / Market Maker cycle logic who want a structured, at-a-glance overview across many pairs without running separate templates on every chart.
SETUP (QUICK)
- Purchase the listing that matches your platform: MetaTrader 4 or MetaTrader 5.
- Attach the indicator to any chart; ensure all symbols exist in Market Watch and names match your broker (including suffixes).
- Adjust the symbol list, ADR period, MA/RSI inputs, and alert options to match your method.
- Open the product COMMENTS on MQL5 for the user guide download link.
REQUIREMENTS MetaTrader 4 or MetaTrader 5 (use the product version that matches your terminal). Works with typical broker symbols (forex, metals, indices where data is available). This is an analysis and scanning tool — it does not open or manage trades automatically.
TRAINING AND SUPPORT A training video is included with the product. For the detailed written user guide, use the link in the COMMENTS section. Additional videos are available on the G-Labs YouTube channel. For support, message us via the MQL5 seller profile.
UPGRADE PATH For advanced Market Maker tooling (breaker blocks, intraday alignment, Shark Fin momentum, divergence, multi-timeframe references, and more), see the G-Labs Advanced Market Maker Dashboard on our MQL5 profile.


I wanted the most complete version that you described in the video, but I can't find it to buy, can you help me?