Market Maker Dashboard by G Labs mt5

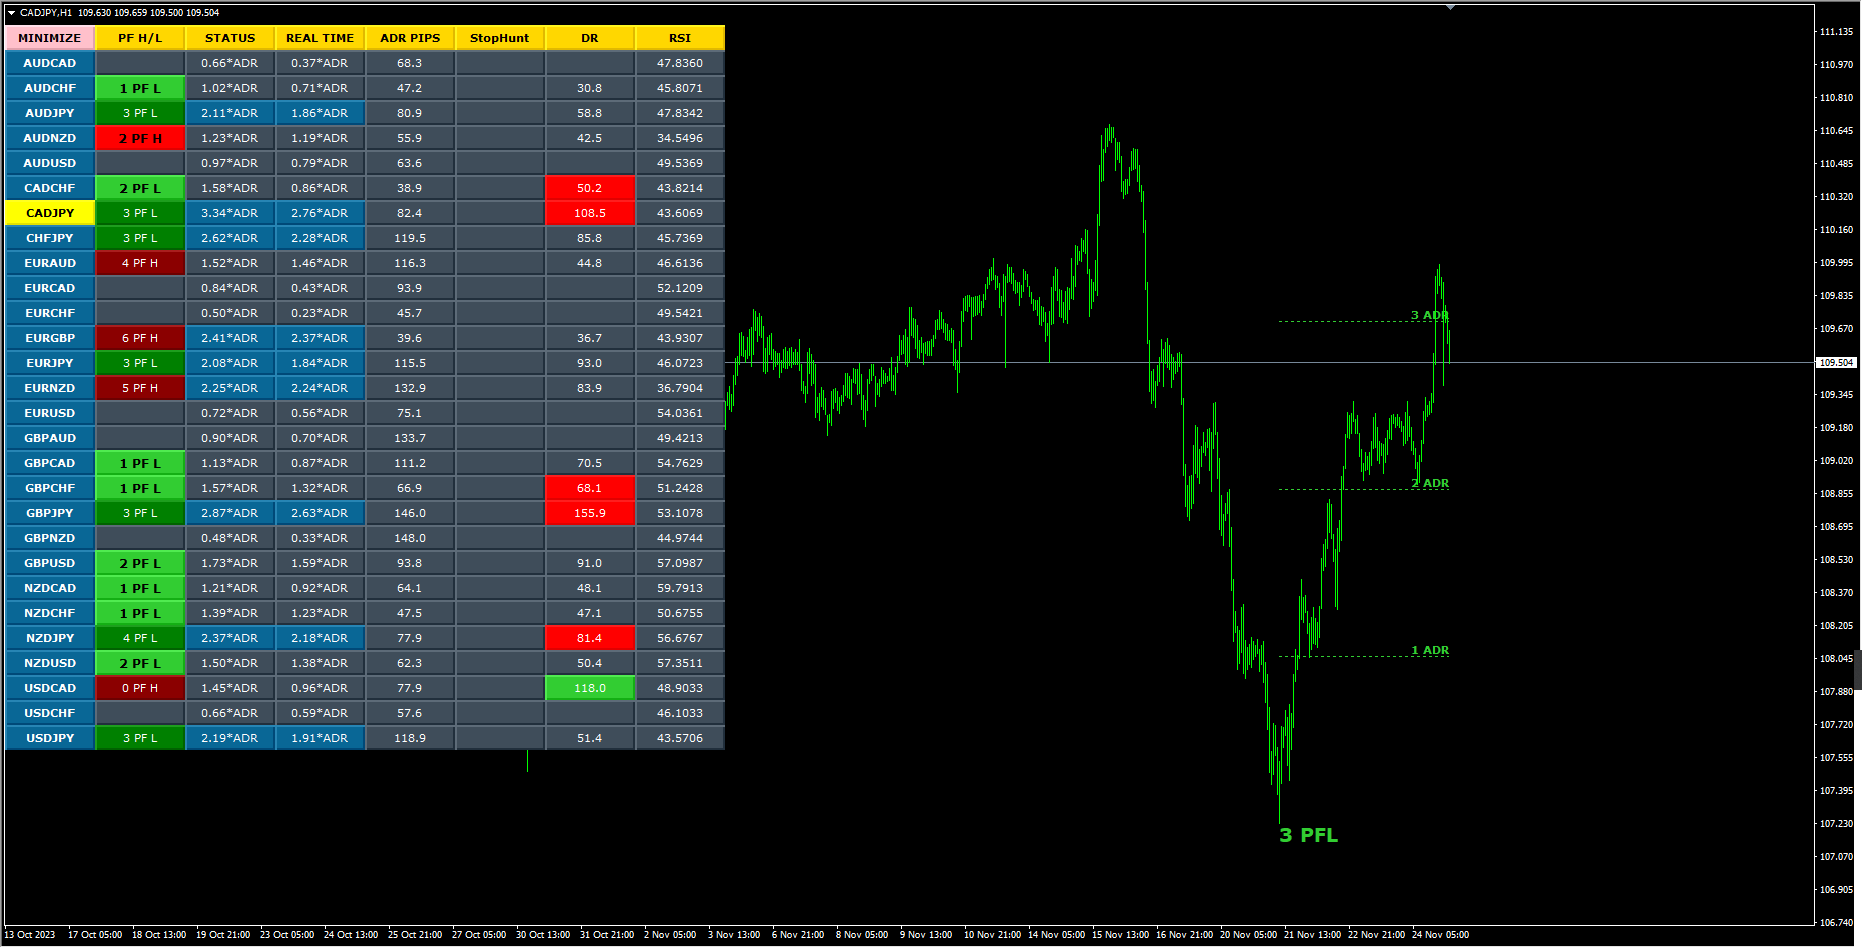
G-Labs Market Maker Dashboard — Beat The Market Maker multi-pair scanner for MetaTrader 5. Peak Formation context (PFH/PFL), ADR cycle expansion, Asian session range, stop-hunt proximity, daily range versus ADR, and M15 RSI from one panel.


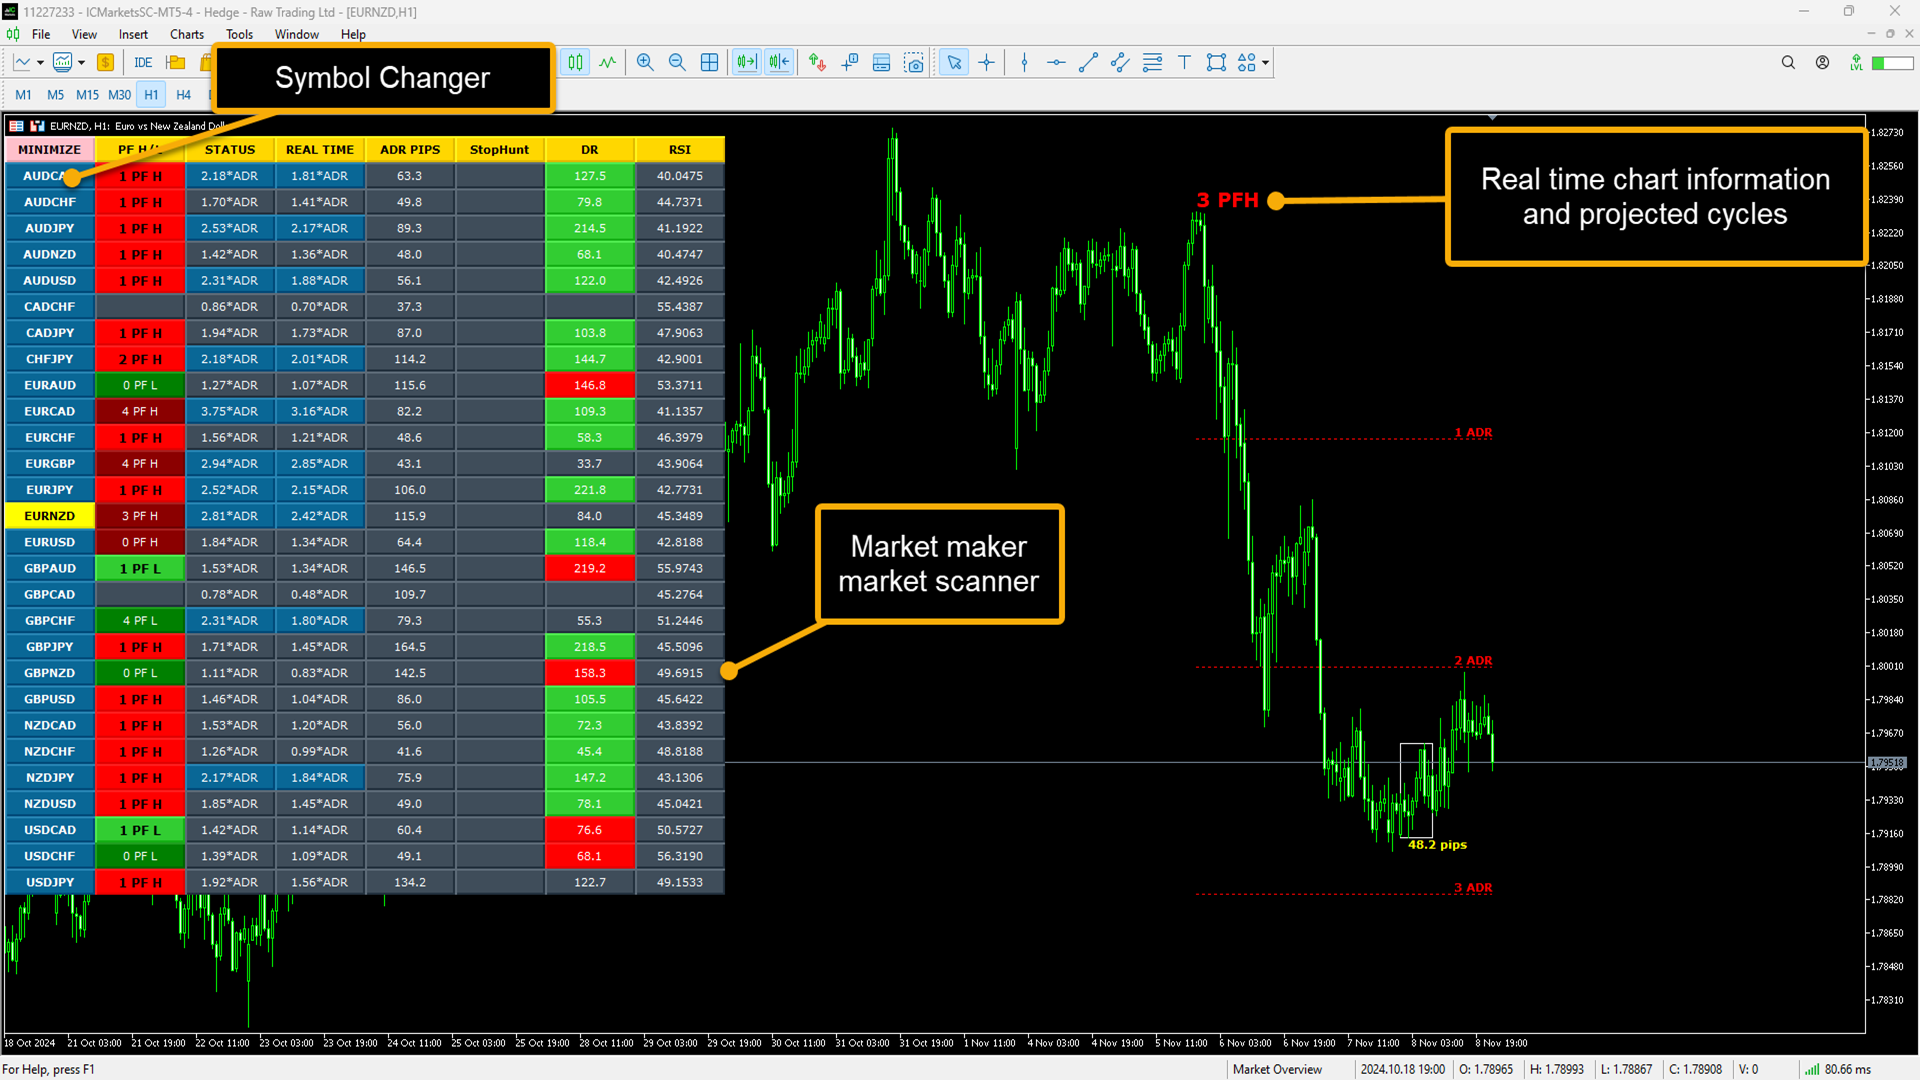
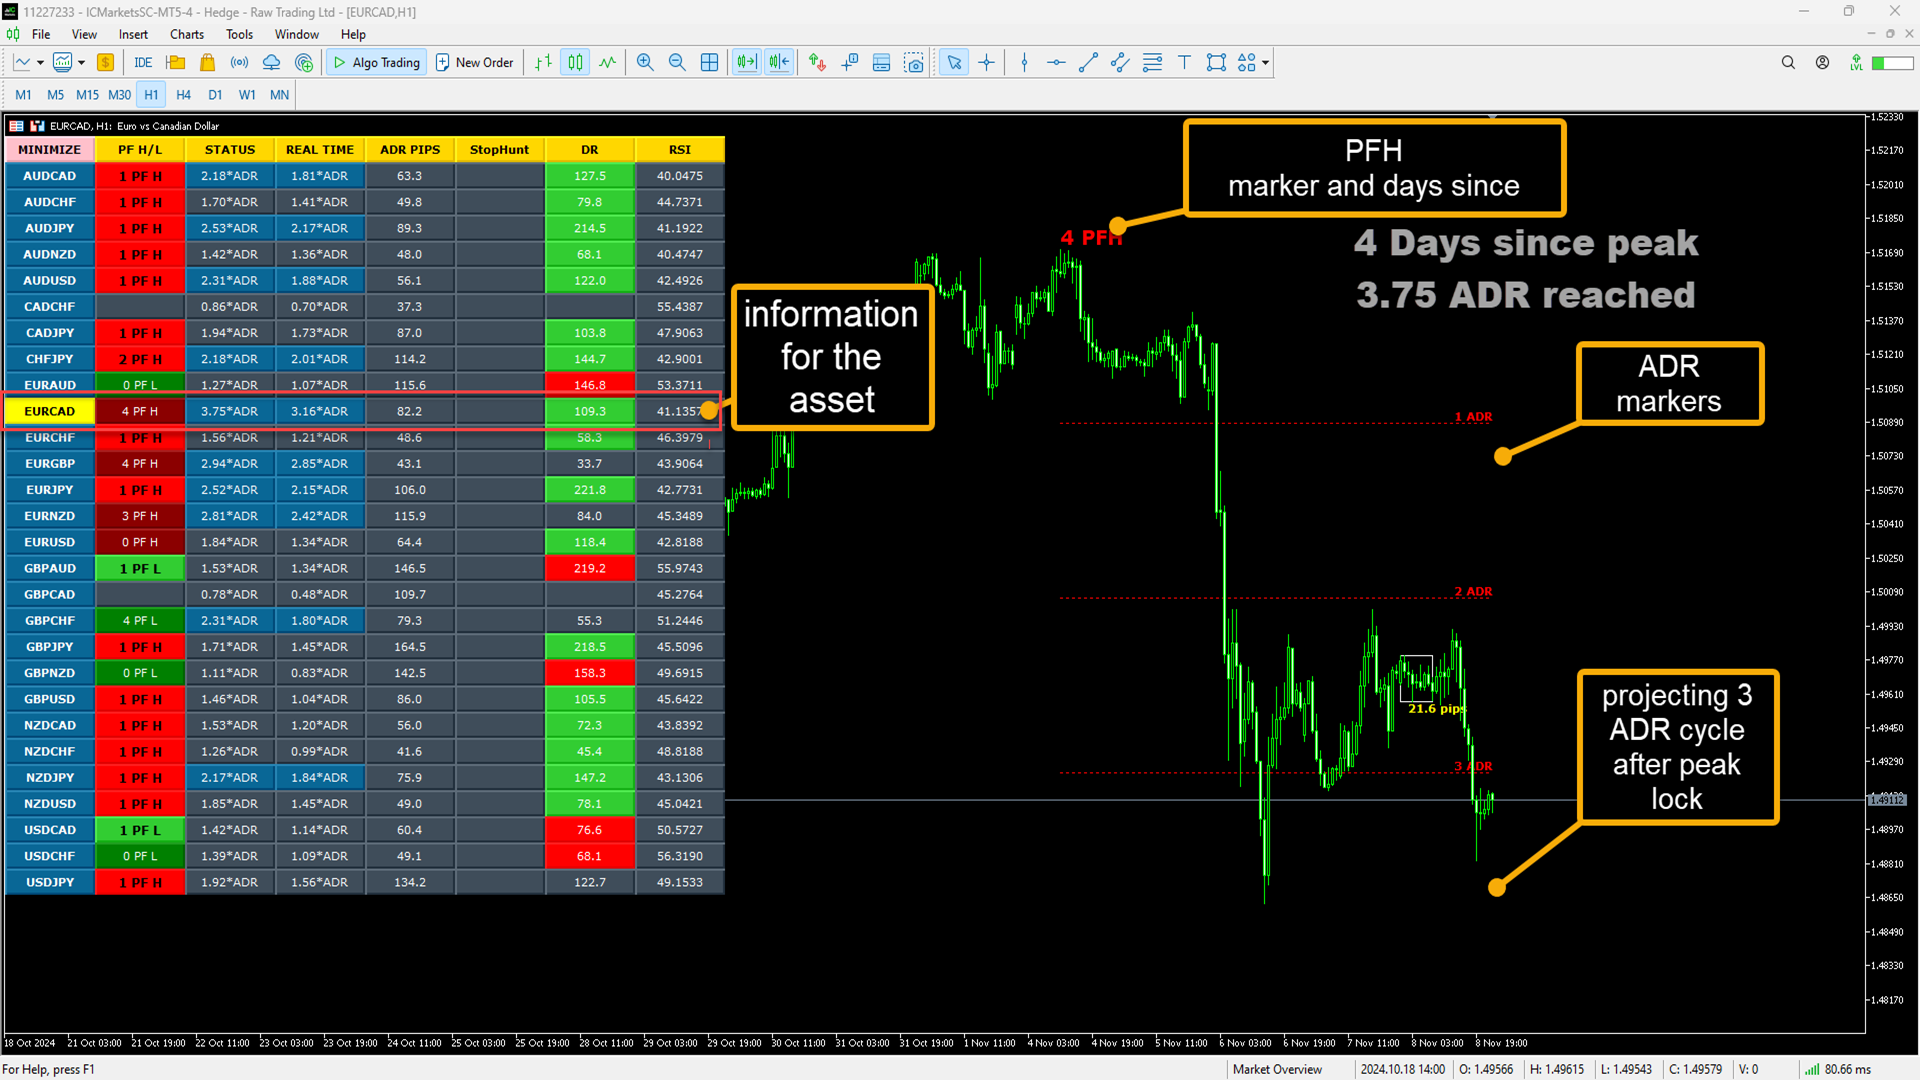
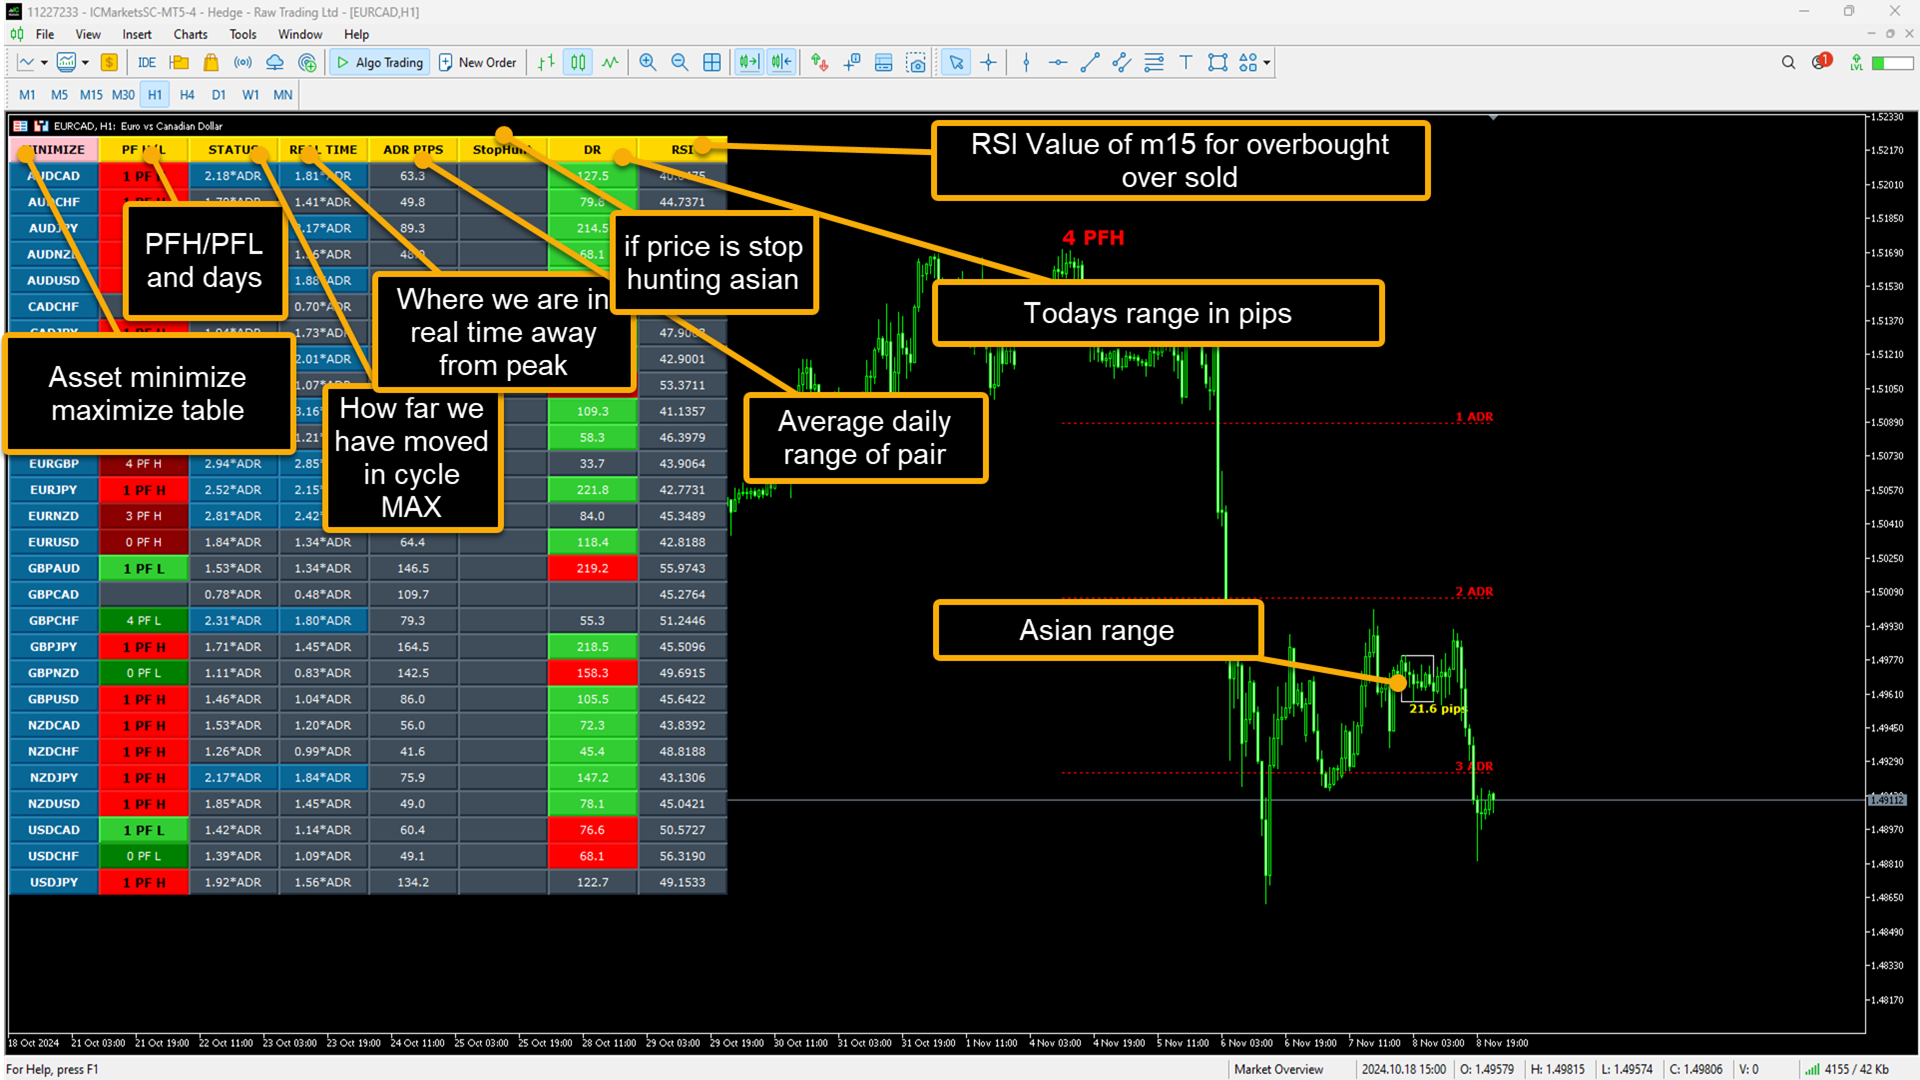
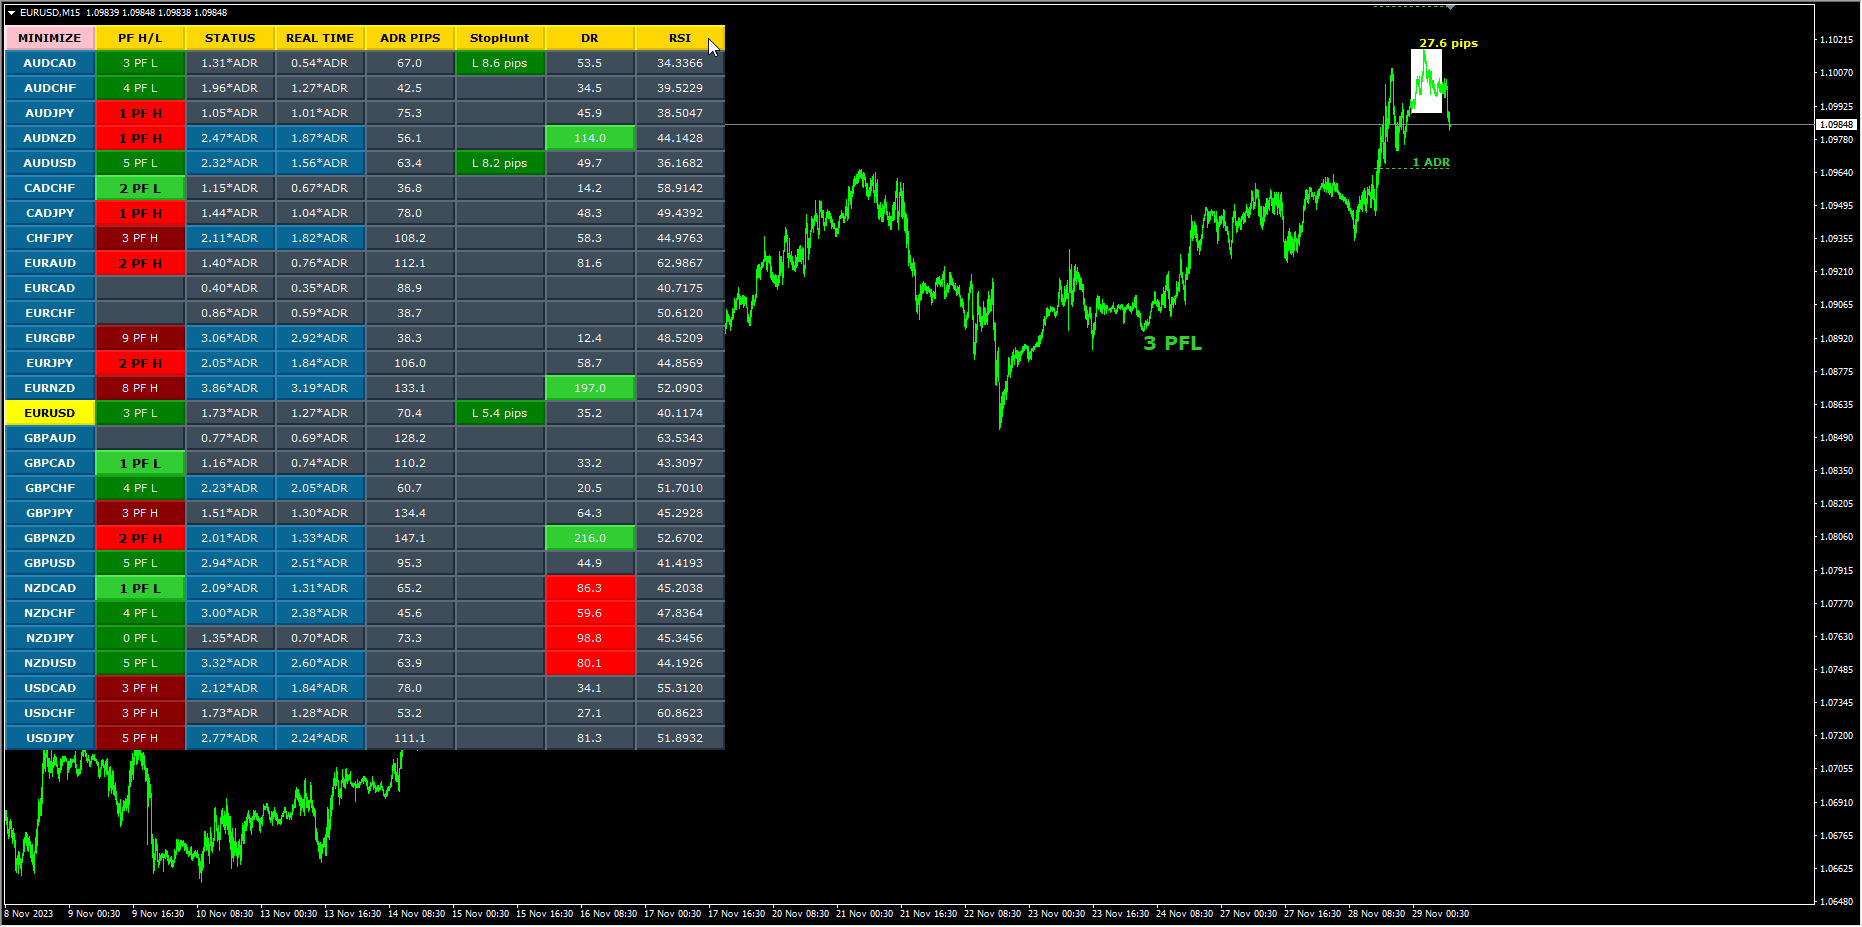
Monitor your full watchlist without opening a chart for every pair. The dashboard scans symbols in real time and shows where each one sits in a BTMM-style daily workflow: peak formation side, movement in average daily range multiples, Asian range behaviour, stop-hunt proximity to session extremes, today’s range compared with ADR, and RSI on M15 for timing. Click a row to load that symbol on the active chart according to your inputs.


What it does


Scans a configurable list of symbols (default covers 28+ major forex pairs; broker suffixes supported). Displays peak formation labels (PFH/PFL) for cycle context. Shows ADR cycle status and real-time expansion in ADR multiples. Builds Asian session range from the early session on H4; optional on-chart rectangle for the chart symbol. Highlights stop-hunt proximity to session range extremes after the session window. Shows daily range in pips versus ADR. Displays M15 RSI with colour-coded cells for quick overbought and oversold awareness.


Dashboard features


Colour-coded table cells for fast scanning. Minimise toggle to reduce on-chart footprint. Optional screen alerts and mobile push notifications for ADR and stop-hunt events. Optional projected 1, 2, and 3 ADR guide lines on the active chart symbol when enabled.


Who it is for


Traders who use Beat The Market Maker or market-maker cycle logic and want a structured overview across many pairs without attaching separate templates to every chart.

Please note: MQL5 adds a demo version to all Market products by default. The demo runs on a single symbol and single timeframe on one chart. This product’s scanner reads multiple currency pairs and multiple timeframes at the same time, so the scanner and scanner-driven features are not compatible with the demo build and will not display or run. In the demo you will typically see basic chart objects only, such as EMAs and session overlays — that is expected behaviour, not a fault with the product. The full multi-pair scanner, dashboard, and all scanner logic are included in the purchased licence and are shown in the product video on the Screenshots tab. Analytical indicator only; it does not place trades for you. Past signal behaviour does not guarantee future results.


Quick start


Attach to any chart. Add symbols to Market Watch and match names to your broker (including suffixes). Adjust the symbol list, ADR period, moving-average and RSI inputs, and alert options. Use the toolbar to minimise the panel or switch symbols from the table.


Requirements


MetaTrader 5. Works with forex, metals, and indices where your broker provides data. Analysis and scanning tool only — does not open or manage trades automatically.


Related products


For breaker blocks, intraday alignment, momentum, divergence, and multi-timeframe references, see G-Labs Advanced Market Maker Dashboard on the same seller profile.


Keywords


BTMM, Beat The Market Maker, market maker dashboard, peak formation, PFH, PFL, ADR cycle, Asian session, Asian range, stop hunt, multi-pair scanner, RSI, MetaTrader 5 indicator, G-Labs
おすすめのプロダクト
Fibonacci Auto Levels Pro MT5 – リトレースメント、エクステンション、ピボットポイント Fibonacci Auto Levels Pro MT5 は、市場のスイングポイントを自動的に検出し、完全なフィボナッチ・リトレースメント、エクステンション、およびピボットポイントの構造をチャート上に描画する高度なテクニカル分析ツールです。 このインジケーターは、いくつかの独立したシステムを統合された単一の分析ツールに組み合わせています。 ピボットポイント (フィボナッチモード) ピボットポイントは、前期間の値幅に基づいて、潜在的なサポートおよびレジスタンスゾーンを特定するために使用されます。 このインジケーターは、前回の高値 (High)、安値 (Low)、終値 (Close) にフィボナッチ比率を適用して計算される フィボナッチ・ピボットポイント を使用します。 ピボットポイントの時間足は、手動で設定することも、以下のロジックを使用して自動で設定することもできます。 日中取引 ≤ 5 分 → 4 時間足 5–45 分 → 日足 45 分–4 時間 → 週足 日足
RelicusRoad Daily Pivots は MetaTrader 4 および MetaTrader 5 向けの日次ピボットポイントインジケーターで、前日のレンジをフィボナッチレベルに分割し、マイナス 100 パーセントからプラス 200 パーセントまでその上下に延長します。 従来のフロアピボットではなく、直近の確定したレンジを安値が 0%、高値が 100% となるスケールとして扱います。19 本のレベルがチャート右端にコンパクトな色付きマーカーとして表示されるため、当日の値動きの大きさを前日のレンジに対する割合や倍数として読み取れます。 仕組み インジケーターは直前に確定した基準期間の高値と安値を取り、そのレンジの各比率にレベルを配置します。レベル = 安値 + 比率 x (高値 - 安値)。週末の足はスキップされるため、月曜日の基準は直近の取引日になります。基準期間はチャートの時間足から決まります。 内側のセット(グレー):0%、23.6%、38.2%、50.0%、61.8%、78.6%、100%。 上側のセット(緑):+123.6%、+138.2%、+150.0%、+16
FREE
製品概要 Global Session Zones Systemは、 MT4およびMT5 プラットフォーム専用に設計されたチャート補助インジケーターです。目に見えない時間サイクルを直感的なチャート言語に変換し、世界の4大外国為替取引セッション(ニューヨーク、ロンドン、東京、シドニー)の背景ボックス、主要な価格帯、統計パネルを自動的に描画します。これにより、トレーダーは市場の変動範囲とトレンドの強さを正確に把握し、信頼性の高いブレイクアウトシグナルを得ることができます。 主要機能 4セッションの可視化 : 4つの主要セッションの開始/終了時間と色をカスタマイズして設定でき、長方形の背景ボックスで各セッションの範囲を直感的に表示します。 多面的なテクニカル分析 : セッション内の線形回帰トレンドライン、平均線、VWAP(出来高加重平均価格)、高値/安値の延長線をオプションで表示し、トレンドの方向性を判断するのに役立ちます。 リアルタイムステータスパネル : 右上に各セッションのアクティブ状態を表示し、高度なモードではトレンドの強さ(R²)、標準偏差(σ)などの定量的データを提供します。 イ
STRUCTUREMAP NAVIGATOR MT5 Multi-Timeframe Market Structure Dashboard TAGLINE Read the market like a structure trader. PRODUCT OVERVIEW StructureMap Navigator MT5 is a multi-timeframe market-structure indicator for MetaTrader 5. It is designed to help traders understand how price is behaving through swing points and structure events rather than relying only on traditional buy/sell arrows. The indicator analyzes recent swing highs and swing lows, classifies them as HH, HL, LH, or LL, and th
FREE
The Market Structures Pro indicator finds and displays 5 (five) patterns of the Smart Money Concepts (SMC) system on the chart, namely: Break Of Structures (BoS)       Change of character (CHoCH) Equal Highs & Lows Premium, Equilibrium and Discount zones with Fibo grid High-high, Low-low, High-low and Low-high extremes Patterns are displayed for two modes - Swing and Internal and are easily distinguished by color on the chart. Internal mode features higher contrast colors, finer lines, and smal
ModGod Scalp Pullback - Precision Trend & Reversion Engine LAUNCH PROMOTION: Only $49 for the first 10 copies! The official price will be $490. Buy before the price goes up! The   ModGod Scalp Pullback   is an advanced, all-in-one indicator designed for professional scalpers and day traders. It combines the extreme smoothness of Triangular Moving Averages (TMA) with Heikin-Ashi trend filtering to provide highly accurate pullback entries and extreme exhaustion reversals. By mapping the natu
Trading Discipline Trend Dashboard は、自分の口座の確定した取引履歴だけを読み、4つの特定のパターンを直近7日間の推移として表示するツールです。1回だけなら気にならないことが、毎週繰り返されていないかを見られるようにします。予測も助言もしません。パネルに出るのは、すでにこの口座で発生した事実だけです。 数字の作り方: 全銘柄・全マジック番号を対象に、最大37日分の確定した約定を読み込みます(チャートの銘柄に限らない、口座全体の集計です)。4つの行は、それぞれ定義が異なります。Post-loss oversize は、損失確定から10分以内・かつ30日基準値(同条件のエントリーの中央値ロット)を超えるロットで開かれた新規エントリーを数えます。これは無料の Trade Behavior Mirror と同じ定義です。Win-streak oversize は、連勝が続いている間に、同じ種類の30日基準値を超えるロットで開かれた新規エントリーを数えます。これは無料の Win Streak Size Creep Mirror と同じ定義です。Symbols
SPECIAL LAUNCH OFFER: GET IT FOR $59 (Limited Time) To celebrate the official release of [TradeAssist Ultimate] on the MQL5 Market, we are offering the first 50 licenses at a special introductory price of $59.  Why is this price available? We believe in building a strong community of serious traders from day one. Instead of traditional marketing, we prefer to invest directly in our early users by offering a massive discount in exchange for your honest reviews and feedback. Once the in
Smart Trendlines – No.1 Trendlines Indicator Smart Trendlines is a precision tool that automatically draws trendlines based on every valid pivot point, helping traders identify key support and resistance zones. It continuously adjusts as new market pivots form, providing a live and accurate reflection of price structure. Whether you’re tracking trends, preparing for reversals, or anticipating breakouts — this indicator keeps you one step ahead. It works seamlessly across all assets including For
Unlock the power of Fibonacci with our advanced indicator! This tool precisely plots Fibonacci levels based on the previous day's high and low, identifying the next day's key support and resistance levels. Perfect for day trading and swing trading, it has consistently generated weekly profits for me. Elevate your trading strategy and seize profitable opportunities with ease. NOTE: In the Input section make sure the draw labels are set to "True" so you can see each levels.
Volume Trade Levels
Mahmoud Sabry Mohamed Youssef
The idea behind this indicator is very simple , First it contains 2 mechanisms to place your trades: 1- Enter the Pips you want to duplicate to price levels. 2- Automatically let the indicator specify the largest Buy / Sell Volume Candle and place duplicated levels based on the candle itself. How it works: 1- Enter the Pips you want to duplicate to price levels:    1- once the indicator is loaded you will need first to Specify the number of pips in the indicator Configuration window ,you can g
Swing Highs Lows Candle Patterns Pro Swing Highs Lows Candle Patterns Pro is a professional price action indicator designed to identify important swing highs, swing lows and high-probability reversal candle patterns automatically. The indicator combines market structure analysis with candlestick confirmation to help traders locate potential BUY and SELL opportunities without cluttering the chart. Unlike ordinary swing indicators, it not only detects Higher Highs (HH), Higher Lows (HL), Lower Hi
Представлен принципиально новый индикатор ZigZag, который отличается от стандартного абсолютной легкостью, быстродействием расчетов и очень высокой точностью. В основе индикатора заложен принцип цикличности рынка с совокупностью анализа количества текущих баров и их основных ценовых уровней. Чем меньше баров для определения расчетов, тем более агрессивная постройка линий индикатора. Как и в  стандартном индикаторе перерисовывается только последняя линия, при изменении достигнутого экстремума. П
Pivot Monster EA
Alexandre Vincent Traber
PIVOT MONSTER EA 概要 PIVOT MONSTERは、日次ピボットレベル(Classic、Camarilla、Woodie)と前日高値・安値のブレイクアウトを組み合わせて取引を行います。Bounce(反発)、Breakout(ブレイクアウト)、Combo(合流)の3つの戦略を切り替え可能で、1日1回の指値・逆指値注文と、ATR倍数または価格に対するパーセンテージで統一されたSL/TP設定を備えています。固定インジケーターではなく、完全に最適化可能なルールベースのピボットシステムを求めるトレーダー向けに設計されています。 動作の仕組み 各取引日の開始時に、前日の高値・安値・終値からピボットレベル(PP、R1-R3、S1-S3)を計算し、前日の高値・安値も記録します。 選択した戦略に応じて、S1/R1付近にBuy Limit/Sell Limit注文(Bounce)、前日高値・安値を超えた位置にBuy Stop/Sell Stop注文(Breakout)、またはピボットレベルと前日高値・安値が近接していることを要求する合流フィルターを伴う両方(Combo)を発注します。
FREE
Harmonic Pattern Suite Pro Introduction Harmonic Pattern Suite Pro is an indicator designed to identify and display harmonic structures on the chart based on X-A-B-C-D sequences. Its purpose is to present pattern formations that meet geometric and proportional criteria, providing a clear visual representation directly on the chart. The indicator automates the detection process, removing the need for manual measurement of ratios and allowing the user to review the structural configuration withou
FREE
This indicator simplifies your entry zones by displaying the areas where you can plan your entry that potentially could give you high risk/reward ratios. Other than picking the most optimal entry points, the Hot Zone indicator can act as your typical support/resistance indicator for pullbacks for all timeframes. You can use this indicator as the only trading indicator or use it with another indicator for reentry purposes.  Besides, when using Hot Zones, the risk/reward ratio should be well abov
Structure Levels (Highs & Lows) Indicator for MetaTrader 5 Decode Market DNA — Trade with Institutional Precision Description: The Structure Levels (Highs & Lows) Indicator is your secret weapon to map the market’s hidden roadmap. Designed for traders who think in terms of price action and market structure, this tool automatically identifies critical swing highs and swing lows, transforming chaotic charts into a clear blueprint of support/resistance zones, breakout opportunities, and trend rev
Session Breakout & Range Indicator Overview A lightweight, clean utility indicator designed to plot the high and low of the Asian trading session while clearly dividing the Asian, London, and New York sessions on your MetaTrader 5 charts. Ideal for session breakout strategies, ICT concepts, and liquidity sweeps. Key Features Asian Session Range Box: Automatically calculates and highlights the exact High and Low formed during the Asian session. Session Separators: Distinct visual dividers ma
FREE
DaySwingPro Institutional — Multi-Factor Day & Swing Trading Engine Confluence-based BUY/SELL signals with institutional risk management, Smart Money Concepts and a live HUD — engineered with a strict zero-repaint architecture. What is it for? DaySwingPro Institutional is built for   day and swing traders   who hold positions from   one day to several weeks   (recommended timeframes:   H1, H4, D1 ). Instead of firing arrows on every minor fluctuation, it waits for the   trend, momentum and mark
Session Flow Board A session scoreboard for XAUUSD and NAS100. One glance tells you who has been leaning on the session: buyers, sellers, or neither. It splits session tick volume into a buy proxy and a sell proxy from where each bar closed inside its range. Close near the high, the bar counts more as buy. Close near the low, more as sell. That running difference is the session CVD. What you see Session buy and session sell Session CVD and the last closed bar's delta Tilt, in percent POC, VAH an
"Hunttern harmonic pattern finder" base on the dynamic zigzag with the notification and prediction mode This version of the indicator identifies 11 harmonic patterns and predicts them in real-time before they are completely formed. It offers the ability to calculate the error rate of Zigzag patterns depending on a risk threshold. It moreover sends out a notification once the pattern is complete. The supported patterns: ABCD BAT ALT BAT BUTTERFLY GARTLEY CRAB DEEP CRAB CYPHER SHARK THREE DRIV
Hello There, i introduce about Swing Premium Forex Mt5 Indicator it work all currency pair it work all time frame, 100% non repaint, no delay Swing trading is a method in which traders attempt to take advantage of market fluctuations. They buy a security when they believe the market will rise and sell if they feel the market will fall, which, as you can imagine, is common in most trading strategies, irrespective of trading style. The four most frequently occurring patterns in the swing trading
BTFX Pivot Points
Bradley Thomas Farrington
BTFXピボットポイントは、毎日のサポートレベルとレジスタンスレベルを計算するインジケーターです。   この指標を使用することにより、ピボットレベルは目標とする明確な目標を示します。   抵抗レベルは、銀色のピボット線の上に紫色で表示されます。   サポートレベルはオレンジ色で表示され、銀色のピボットラインの下にあります。   このインジケーターは、BTFX夜明けインジケーターと一緒に使用すると非常にうまく機能します。   これらの指標の詳細については、添付のYouTubeビデオをご覧ください。   その他のお問い合わせは、メールまたはお電話にてお問い合わせください。   support@besttradesfx.co.uk   01827 842 418
General Description In the simplest terms this is a contrarian intra-day scalping system. Built to try and let correct trades run as far as possible and flip the trade when indicated. The indicator looks at historical daily trading ranges to lay out levels at which it takes long and short positions based on the statistical levels. The indicator is built around index futures, mainly around S&P and the DOW but can be used an any futures contract mainly using AMP Futures to trade. The indicator is
ボリュームプロファイルマルチモード:インジケーターのやり方ではなく、あなた自身のやり方でボリュームを分析しましょう。 ほとんどのボリュームプロファイル指標は、トレーダーをあらかじめ定義された分析範囲に限定します。しかし、市場は固定されたテンプレート内で動くわけではありません。なぜあなたの分析もそうあるべきなのでしょうか? ボリュームプロファイルマルチモードを 使えば、ボリューム分析の場所、タイミング、方法を自由に決定できます。市場構造の分析、取引セッションのプロファイリング、上位時間軸のアクティビティの監視、あるいは進行中のオークションの追跡など、どのような目的であれ、このインジケーターはあなたの取引スタイルに合わせて調整されるため、あなたがインジケーターに合わせる必要はありません。 直感的なワークフローを求める初心者から、柔軟性を重視するプロフェッショナルまで、あらゆるユーザー向けに設計されたボリュームプロファイルマルチモードは、4つの強力なプロファイリング手法を1つの高度にインタラクティブでカスタマイズ可能なトレーディングツールに統合しています。 4つの強力なプロファイリングモード
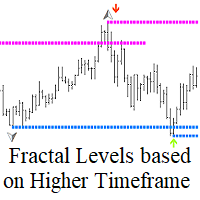
上位タイムフレームに基づくフラクタルレベルは、上位タイムフレームのフラクタ ルに基づく正確なサポートおよびレジスタンスレベルを構築するよう設計された強力な ツールです。 仕組み: このインディケータは、上位タイムフレーム上のフラクタルのレ ベルを分析し、現在のチャートに表示します。インジケータのプロパティで上位タイムフレームを簡単に 調整でき、最大限の精度と戦略との関連性を得ることができます。 上位タイムフレームに基づくフラクタルレベルを使用する利点: 早 期 シ グ ナ ル 検 出:上位タイムフレームのフラクタルレベルを下位タイム フレームで見ることができるため、潜在的な売買シグナルをその開始時 点で識別することができます。 損益率の向上:低いタイムフレームでの早期エントリーにより、ストップロスを短く設定できるため、取引効率が大幅に向上します。 便利なアラート:重要なシグナルを見逃しません - エントリーやエグジットの機会を即座に通知します。 分析精度の向上:本当に重要な重要レベルに集中し、不必要な市場ノイズを無視します。 ハイヤータイムフレームに基づくFractal Lev
Advanced Support and Resistance Support and resistance levels are widely used in trading. They are important as they show some key price levels. Before applying any strategy, one may consider it necessary to draw support and resistance. However, this process can take much time especially if one is to analyse a lot of currency pairs, commodities or indices. This Advanced Support and Resistance tool was designed for traders at any level, amateur to professional. It plots key support and resistance
Master Editionは、ボリュームとマネーフローの視点を通じて市場構造を可視化するために設計されたプロフェッショナルグレードの分析ツールです。標準のボリュームインジケーターとは異なり、このツールはチャート上に日足ボリュームプロファイルを直接表示し、価格発見がどこで行われたか、そして「スマートマネー」がどこに位置しているかを正確に確認できます。 このMaster Editionは、明確さとスピードを考慮して設計されており、ロード時にチャートレイアウトを即座に美化するユニークな自動テーマ同期システムを備えています。 主な機能: 真のマネーフロー計算: 標準のティックボリュームを超えます。「Use Money Flow」を有効にすると、ボリュームは価格によって重み付けされ、特定の価格レベルでの実際の資本コミットメントが明らかになります。 バリューエリア (VA) の可視化: バリューエリア(デフォルトではボリュームの70%)を自動的に計算します。 VA Fill: コントロールゾーンを即座に識別するために、バリューエリアの背景をシェーディングします。 主要レベル: コントロールポイン
OrderFlux – MetaTrader 5用 オーダーフロー & フットプリント インジケーター OrderFlux は、MetaTrader 5向けのプロフェッショナルなオーダーフローおよびフットプリントインジケーターです。個々のローソク足を展開し、その内部で何が起こっているかを明らかにします:各価格レベルでの取引量を、アグレッシブな買い手と売り手に分けて表示します。これらのティックデータから、 Delta、Imbalance、Volume Profile、および Market Profile を含む完全なフットプリントチャートがリアルタイムで構築されます。 標準的なチャートには、始値、高値、安値、終値のみが表示されます。それは動きの結果であり、原因ではありません。OrderFluxはすべてのローソク足の微細構造を可視化し、最も重要な1つの質問に答えます: 「誰が実際にその動きを主導したのか?」 これにより、ローソク足の形状だけで推測するのではなく、実際の取引量からサポートとレジスタンスを読み取ることが可能になります。 フットプリントの表示内容 すべての価格レベルで、2つの数字
QuickTrade Panel – Fast Execution & Smart Risk Management The QuickTrade Panel is a professional trading utility for MetaTrader 5 that makes order execution faster, safer, and easier. It allows traders to place market and pending orders directly from the chart while automatically managing position size based on their risk settings. Key Features Interactive On-Chart Panel: Easily adjust Lot Size, Risk %, Stop Loss (SL), Take Profit (TP), and Pending Order Distance without opening EA settings. Sma
このプロダクトを購入した人は以下も購入しています
Trend Sniper X
Sarvarbek Abduvoxobov
4.9 (41)
Trend Sniper X は、トレードの方向性と潜在的な反転ポイントを明確かつ正確に特定するのに役立つ、MetaTrader 5 用のマルチタイムフレーム・トレンドフォロー指標です。 MT4用: https://www.mql5.com/en/market/product/193245 価格情報: 現在の価格はプロモーション価格であり、今後のアップデートや新機能のリリースに伴い変更される場合があります。 ボーナス特典: このインジケーター用の無料自動売買アシスタントEAを入手するには、購入後に an 著者(開発者)へメッセージをお送りください。 Code2Profit チャンネル マルチタイムフレーム分析で相場をマスターしよう! Trend Sniper X で勝率を最大化する方法:重要なルールとセッションのコツ 技術仕様 プラットフォーム MetaTrader 5 インジケータータイプ マルチタイムフレーム・トレンドインジケーター 操作タイムフレーム あらゆるチャートタイムフレームに対応。個別に選択可能な上位タイムフレーム (M1–MN1) を搭載 主要銘柄 FX、ゴールド (X
Smart Trend Trading System — MetaTrader 5 ご購入後、MQL5で私にメッセージをお送りいただくと、Smart Universal Expert Advisorを無料で受け取れるほか、オンライン講座、PDFマニュアル、非公開グループへのアクセスもご利用いただけます。 STTSは、トレンドの方向、エントリー・決済シグナル、反転ゾーン、重要な価格水準をチャート上にまとめて表示します。システムを参考に手動で取引することも、別の対応EAを接続し、ご自身で選んだ設定に基づいて自動売買することもできます。 ひとつのシステム、4つのトレードアプローチ STTSのトレードアプローチは、大きく4つのカテゴリーに分かれています。 • スキャルピング — 短期的なシグナルや相場の動きを捉えます。 • トレンドトレード — 方向性を評価し、トレンド内の機会を探します。 • 反転トレード — 反転の可能性があるゾーンや方向の変化を見つけます。 • 出来高トレード — 出来高に基づく情報を使い、市場の活発さを評価します。 エントリー・決済の矢印、トレンド情報、サポート・
SuperScalp Pro
Van Minh Nguyen
4.56 (36)
SuperScalp Pro - Professional Multi-Layer Confluence Scalping System SuperScalp Proは、クラシックなSupertrendに複数のインテリジェントな確認フィルターを追加した、高度なスキャルピングインジケーターです。より高い確率が期待できるBuy/Sellの取引機会を特定し、ダマシのシグナルを大幅に減らすことをサポートします。 明確なBuyとSellの矢印がチャート上に直接表示され、ATRに基づくStop LossとTake Profitのレベルがリアルタイムで自動計算されます。 購入後、設定方法や推奨設定についてのサポートが必要な場合は、私にご連絡ください。 SuperScalp Pro Auto Traderを使用して、シグナルを簡単に自動化できます: [Auto Trader] 推奨設定ファイルをダウンロード: [Set File] 完全なドキュメントは製品ブログでご覧いただけます: [User Guide] 最新情報を受け取るには公式チャンネルに参加してください: [Official Channel]
伝説が帰ってきました:Entry Points Pro 10。 MQL5 Marketのトップ3に3年間入り続けた伝説的インジケーターの再始動です。 2つのバージョンで合計589件の高評価レビュー、毎日数千人のトレーダーが実際のトレードに使用し、デモのダウンロードは31,000件以上   MT4+MT5 。 私はこの5年間に寄せられたレビューをすべて読み、約束を並べる代わりに、その答えをバージョン10に組み込みました。1999年から相場に携わり、 誠実さ、自らの評判、そして顧客を大切にする 作者による製品です。 Entry Points Proのエントリーシグナルは、リペイント(再描画)を一切行いません。 そして今回初めて、これは作者の言葉ではなく検証可能な事実になりました。確定シグナルはローソク足の終値確定後にのみ表示され、自動テストで リペイントはゼロ と確認されています(EURUSD、XAUUSD、BTCUSDで2,486,568回の不変条件チェック、違反0件)。検証方法は公開されており、ストラテジーテスターでご自身で再現できます。 ご購入後は、必ずすぐにダイレクトメッセージでご
Gann Made Easy   は、ミスター・ギャンの理論を使用した取引の最良の原則に基づいた、プロフェッショナルで使いやすい外国為替取引システムです。 W・D・ガン。このインジケーターは、ストップロスとテイクプロフィットレベルを含む正確な買いと売りのシグナルを提供します。 PUSH通知を利用して外出先でも取引可能です。 ご購入後、取引方法の説明と優れた追加インジケーターを無料で入手するには、私にご連絡ください! おそらく、ギャンの取引手法についてはすでに何度も聞いたことがあるでしょう。通常、ギャンの理論は初心者のトレーダーだけでなく、すでにある程度の取引経験がある人にとっても非常に複雑なものです。なぜなら、ギャンの取引手法は理論的にはそれほど簡単に適用できるものではないからです。私はその知識を磨き、最良の原則を私の外国為替インジケーターに組み込むために数年を費やしました。 このインジケーターは非常に簡単に適用できます。必要なのは、それをチャートに添付し、簡単な取引推奨事項に従うだけです。このインジケーターは常に市場分析の仕事を行い、取引の機会を探します。適切なエントリーポイントを検
Auto Optimized SpeedAngle は、継続的なウォークフォワード最適化(WFO:Walk-Forward Optimization)によりカーブフィッティング(過剰最適化)を排除した、機関投資家レベルのモメンタムベクトルシステムです。市場レジームの変化時に効果が低下する静的な入力に依存せず、アウトオブサンプル(OOS)検証を用いてパラメーターを動的に再キャリブレーションすることで、表示されるシグナルが単なる過去の偶然ではなく、確実な統計的優位性に基づいていることを保証します。 主な機関投資家向けフレームワーク ウォークフォワード最適化エンジン: ルックバック期間やしきい値の数千に及ぶ組み合わせを継続的にスキャンし、データをインサンプルとアウトオブサンプルに厳格に分離します。未検証のデータ環境において数学的優位性が証明された場合にのみ、新しいパラメーター設定を採用します。 定量的目的関数: 単なる純利益の追求ではなく、機関投資家レベルの安定性指標をターゲットとします。システム品質ナンバー(SQN)、期待値(1トレードあたりの平均Rマルチプル)、またはネットRの最適化を選
Neuro Poseidon is a new indicator by Daria Rezueva. It combines precise trading signals with adaptive TP/SL levels - creating best possible trades as a result! Message me and get  Neuro Poseidon Assistant  as a gift to automize your trading process! What makes it stand out? 1. Proven profitability on all assets and timeframes 2. Only confirmed BUY and SELL signals present on the chart 3. Adaptive TP & SL levels generated by the software for each trade 4. Easy to understand - suitable for al
Welcome to ENTRY IN THE ZONE AND SMC MULTI TIMEFRAME  SPECIAL BENEFIT / FOR OUR MQL5 CUSTOMERS FREE ACCESS TO THE NEW TOOL  — COMING SOON — Learn more on our official website  : https://www.fableedge.net Entry In The Zone and SMC Multi Timeframe is a real-time market analysis tool based on Smart Money Concepts (SMC) , designed to analyze market structure, price direction, and key trading zones. It supports both Single-Timeframe and Multi-Timeframe Analysis , providing a clearer view of overall m
M1 SNIPER は使いやすいトレーディングインジケーターシステムです。M1時間足向けに設計された矢印インジケーターです。M1時間足でのスキャルピングのためのスタンドアロンシステムとして、また既存のトレーディングシステムの一部としても使用できます。このトレーディングシステムはM1時間足での取引に特化して設計されていますが、他の時間足でも使用できます。元々、この手法はXAUUSDとBTCUSDの取引用に設計しましたが、他の市場においても役立つと考えています。 インジケーターのシグナルは、トレンドの方向と逆方向に取引できます。インジケーターのシグナルを利用して両方向に取引するのに役立つ特別な取引テクニックをご紹介します。この手法は、特別な動的なサポートとレジスタンスの価格帯を利用することに基づいています。 ご購入後、M1 SNIPER矢印インジケーターをすぐにダウンロードできます。さらに、M1 SNIPERツールのすべてのユーザーに、以下のスクリーンショットに表示されているApollo Dynamic SRインジケーターを無料で提供しています。この2つのインジケーターを組み合わせることで
Unix Scalper — MetaTrader 5 ご購入後、MQL5で私にメッセージをお送りいただくと、Smart Universal Expert Advisorを無料で受け取れるほか、オンライン講座、PDFマニュアル、非公開グループへのアクセスもご利用いただけます。 セットアップを見つけ、取引プランを確認し、取引方法を選ぶ。 UNIX Scalperは、市場分析、BUY/SELL/WAITの判断、Entry、Stop Loss、TP1、TP2の水準を、見やすいパネルにまとめています。 シグナルと取引プランを確認 • 明確な判断:BUY、SELL、WAIT。 • 明示された水準:Entry、Stop Loss、TP1、TP2。 • 複数時間足の一覧:パネル上で各時間足のシグナルを比較。 • 判断を支える分析:トレンド、モメンタム、出来高、ボラティリティ、サポートとレジスタンス、市場の質。 • 選べるレイアウト:Minimized、Compact、Standard、Full。 シグナルと各水準を確認し、そのセットアップがご自身の取引ルールに合うか判断してください。 ゴール
Scalper Vault は、スキャルピングを成功させるために必要なすべてを提供するプロフェッショナルなスキャルピング システムです。このインジケーターは、外国為替およびバイナリー オプションのトレーダーが使用できる完全な取引システムです。推奨される時間枠は M5 です。 システムは、トレンドの方向に正確な矢印シグナルを提供します。また、トップとボトムのシグナルとギャン マーケット レベルも提供します。 インジケーターは、プッシュ通知を含むすべてのタイプのアラートを提供します。 インジケータの購入後にご連絡ください。私の個人的な取引の推奨事項と素晴らしいボーナス指標を無料で共有します! 幸せで有益な取引をお祈りします!
このインジケーターを購入された方には、以下の特典を 無料 で提供しています: 各トレードを自動で管理し、ストップロスとテイクプロフィットを設定し、戦略ルールに基づいてポジションを決済する補助ツール 「Bomber Utility」 様々な銘柄に合わせたインジケーターの設定ファイル(セットファイル) 「最小リスク」、「バランスリスク」、「待機戦略」 の3つのモードで使用できる Bomber Utility 用の設定ファイル このトレーディング戦略をすぐに導入・設定・開始できる ステップバイステップのビデオマニュアル ご注意: 上記の特典を受け取るには、MQL5のプライベートメッセージシステムを通じて販売者にご連絡ください。 オリジナルのカスタムインジケーター 「Divergence Bomber(ダイバージェンス・ボンバー)」 をご紹介します。これは、MACDのダイバージェンス(乖離)戦略に基づいた 「オールインワン」型のトレーディングシステム です。 このテクニカルインジケーターの主な目的は、価格とMACDインジケーターの間に発生するダイバージェンスを検出 し、将来の価格の動きを示
もう勘でトレードしなくていい。 エントリーのタイミング、決済の場所、相場がどちらに傾いているか、そのすべてが1つのチャートで分かります。 RelicusRoad Proは、20種類近くのツールを1つのインジケーターにまとめました。自分のトレードスタイルに合うツールだけをオンにできます。 エントリーは明確に。決済も明確に。すべてのチャートに計画を。 心当たりはありませんか? 買った途端、1分もしないうちに価格が逆行する。 早めに決済してしまい、その後も値動きが続くのを眺めている。 チャートにインジケーターを5つ並べても、答えは5通りある。 ストップロスの位置は、なんとなく決めている。 開発した理由 私たちは18年間、FXを取引してきました。RelicusRoadの中核となるアルゴリズムは、最初は非公開で、私たちプロのトレーダー仲間のために作られました。 きっかけは個人的なものでした。毎回同じラインを手で引き、自分たちで決めたルールを破り、チャート上の重要な一点を見落とすことに、私たちは疲れていたのです。 私たちにとって効いたのは一貫性です。毎日同じ方法で相場を読み続け、それが体に染みつく
FX Trend NG:次世代マルチマーケット・トレンドインテリジェンス 概要 FX Trend NG は、複数の時間足に対応したプロフェッショナル向けトレンド分析およびマーケット監視ツールです。 市場全体の構造を数秒で把握することができます。 複数のチャートを切り替える必要はありません。どの銘柄がトレンド中なのか、どこでモメンタムが弱まっているのか、そしてどの時間足で強い整合性があるのかを瞬時に確認できます。 ローンチ特別オファー – FX Trend NG を $30(6ヶ月) または $80 永久ライセンス でご利用いただけます。 すでに Stein Investments のユーザーですか? -> メッセージを送信 して、プライベートグループへアクセスしてください。 セットアップや詳細情報が必要ですか? -> Stein Investments 公式ページ をご覧ください。 1. FX Trend NG が他と異なる理由 3ステート・トレンドロジック ― Buy と Sell だけではない • 多くのインジケーターは Buy または Sell の2状態のみを表示します。
FiboSniper Pro – Multi-Filter Fibonacci System with Auto SL/TP and Control Panel FiboSniper Proは、動的なFibonacci Envelopesと複数の確認フィルターを組み合わせ、選別されたBuyおよびSellシグナルを生成するテクニカルインジケーターです。FibonacciレベルはMoving AverageとATRを基に計算され、その後ADX、EMA、RSI、ATR、Volume、Time、Candle構造によってフィルタリングされます。インジケーターは、ATRに基づく自動Stop LossおよびTake Profitレベルをチャート上に直接表示し、さらに迅速な調整が可能なインタラクティブControl Panelを提供します。 購入後、推奨設定ファイルと詳細な使用方法については、私にご連絡ください。 Auto Trader Xを使用してFiboSniper Proのシグナルを自動化できます: [Auto Trader X] User GuideとSet Files: [Click her
トレーダーの皆さん、こんにちは! 多くの個人トレーダーは、動作の遅いウェブスクリプトに頼っています。真の収益性を実現するには、体系化されたフレームワークが必要です。 Astro AIインジケーターは、一般的なチャートオーバーレイではありません。これは、ターミナル上で直接動作する2つのエージェントを含む、コンパイル済みのニューラルネットワークです。 システムの具体的な技術は以下のとおりです。 1. エージェント1:アナリスト(グラフィカルニューラルネットワーク - GNN) 市場は孤立した価格バーではなく、相互に連結されたデータネットワークです。 機能:エージェント1は、グラフィカルニューラルネットワークを使用して、これらの複雑で非線形な関係をマッピングします。 利点:一般的なインジケーターは過去の移動平均しか考慮しませんが、当社のGNNは市場の深い構造的関係をリアルタイムで処理し、個人トレーダーの取引量が大きな影響を与える前に、隠れた相関関係を明らかにします。 2. エージェント2:エグゼキューター(近接戦略最適化 - PPO) パターン認識は、戦いの半分に過ぎません
Adaptive Price Action Engine インジケーターを購入すると、EAが無料に マルチタイムフレーム対応・自己最適化トレンド&ローソク足パターン分析 市場環境は常に変化しており、すべてのPrice Actionパターンが、あらゆる市場環境で同じ価値を持つわけではありません。 Adaptive Price Action Engine は、変化する市場環境への適応を目的として、 トレンド構造、マルチタイムフレーム分析、ローソク足パターン、統計的最適化 を1つの分析フレームワークに統合しています。 2つのアダプティブモード Dual Alpha Trend Mode 低い時間足と高い時間足のAlpha Trendパラメータを自動的に探索し、直近の市場動向に合わせてトレンド判定を適応させます。 Candlestick + Alpha Mode Alpha Trendによる市場レジーム判定と、 22種類の強気・弱気ローソク足パターン を組み合わせます。すべてのパターンを同じように扱うのではなく、さまざまなパターンの組み合わせを統計的に評価し、選択された市場環境において過去
ご紹介     Quantum Breakout PRO は 、ブレイクアウト ゾーンの取引方法を変革する画期的な MQL5 インジケーターです。 13年以上の取引経験を持つ経験豊富なトレーダーのチームによって開発されました。     クォンタム ブレイクアウト プロ   は、革新的でダイナミックなブレイクアウト ゾーン戦略により、あなたのトレーディングの旅を新たな高みに押し上げるように設計されています。 クォンタム ブレイクアウト インジケーターは、5 つの利益ターゲット ゾーンを備えたブレイクアウト ゾーン上のシグナル矢印と、ブレイクアウト ボックスに基づいたストップロスの提案を提供します。 初心者トレーダーにもプロのトレーダーにも適しています。 量子EAチャネル:       ここをクリック 重要!購入後、インストールマニュアルを受け取るためにプライベートメッセージを送ってください。 推奨事項: 時間枠: M15 通貨ペア: GBPJPY、EURJPY、USDJPY、NZDUSD、XAUUSD アカウントの種類: ECN、Raw、またはスプレッドが非常に低い R
トレンドキャッチャーインジケーター トレンドキャッチャーインジケーターは、開発者独自の適応型トレンド分析指標を組み合わせることで、市場価格の動きを分析します。短期的なノイズを除去し、根底にあるモメンタムの強さ、ボラティリティの拡大、価格構造の挙動に焦点を当てることで、真の市場方向性を特定します。また、移動平均線、RSI、ボラティリティフィルターなどの平滑化およびトレンドフィルタリング機能を備えたカスタマイズ指標も使用します。 実際の運用状況のモニタリングやその他の製品については、こちらをご覧ください: https://www.mql5.com/en/users/mechanic/seller ご注意ください。私はTelegramでEAや設定を販売していません。詐欺です。すべての設定はブログで無料で公開しています。 重要!ご購入後すぐにご連絡ください。手順とボーナスをお送りします!
Quant Direction は、3次元の市場分析ツールです。完全に客観的なアルゴリズムベースの市場分析を提供し、様々なパラメータにわたる正確なパーセンテージ偏差を同時に算出します。高度なAI搭載モデリングツールで開発され、厳密なテストを経て開発されたこのアルゴリズムは、かつてない精度で市場を分析するように設計されています。プラットフォーム上では、あらゆる通貨ペアや金融商品を分析できます。 短期取引、デイトレード、スイングトレードなど、どのような取引スタイルに も、Quant Directionは最適な選択肢です。 オペレーターの本当の利点 Quant Directionの真の利点は、感情、眼精疲労、過剰分析を完全に排除できる点にあります。方向性を探るために何十ものチャートを手作業で精査したり、自分の好みを常に疑ったりする必要がなくなります。このシステムは、8つの時間間隔(5ヶ月から月単位まで)をミリ秒単位で処理します。あらゆる瞬間に市場を支配している主体を正確に明らかにし、常に成功確率が最も高い方向で取引できるようにします。 市場分析の3つの側面 このアルゴリズムは市場を3つの
Quantum TrendPulse を ご紹介します。これは、   SuperTrend   、   RSI   、および Stochastic のパワーを 1 つの包括的なインジケーターに組み合わせて、取引の可能性を最大限に引き出す究極の取引ツールです。精度と効率を求めるトレーダー向けに設計されたこのインジケーターは、市場のトレンド、勢いの変化、最適なエントリー ポイントとエグジット ポイントを自信を持って特定するのに役立ちます。 主な特徴: SuperTrend 統合: 現在の市場動向に簡単に追従し、収益性の波に乗ることができます。 RSI精度: 買われすぎと売られすぎのレベルを検出し、市場の反転のタイミングに最適で、SuperTrendのフィルターとして使用されます。 確率的精度: 確率的振動を活用して、変動の激しい市場で隠れたチャンスを見つけます。SuperTrend のフィルターとして使用されます。 マルチタイムフレーム分析:   M5 から H1 または H4 まで、さまざまなタイムフレームで市場を常に把握します。 カスタマイズ可能なアラート: カスタム取引条件が満たされ
Atomic Analyst — MetaTrader 5 ご購入後、MQL5で私にメッセージをお送りいただくと、Smart Universal Expert Advisorを無料で受け取れるほか、オンライン講座、PDFマニュアル、非公開グループへのアクセスもご利用いただけます。 Atomic Analystは、プライスアクション、トレンドの方向、エントリー・決済シグナル、損切り水準、複数の利確水準をチャート上にまとめて表示します。 シグナルを確認し、取引の状況を理解する Atomic Analystは、分析結果をわかりやすい視覚情報として表示します。 • エントリーの候補を見つけるための買い・売りの矢印。 • 取引計画に役立つ損切り水準と複数の利確水準。 • 市場の方向性を評価するトレンド、強さ、モメンタムの指標。 • より広い市場背景を比較する複数時間足の分析。 • 変化する状況を追うための色分けされたローソク足とアラート。 シグナルと補助分析を併せて確認し、その取引機会がご自身のルールに合うかを判断してください。 短期の取引機会から、より大きな値動きまで Atomic A
BTMM State Engine Pro by G-Labs — Beat The Market Maker indicator for MetaTrader 5. Asian session range, London and New York kill zones, level progression (L1/L2/L3), peak formation detection (PFH/PFL), entry signals, and a multi-pair scanner from one chart. Stop scanning charts one pair at a time. The State Engine tracks the BTMM daily cycle automatically — Asian box, room boundaries, level blocks, peak formations, and filtered entries — while the scanner dashboard shows level, peak status, d
SkyHammer Signal Pro Entry、SL、TP レベルを固定表示する、プロ仕様のノーリペイント・トレンドシグナルインジケーター SkyHammer Signal Pro は、明確で固定され、検証可能なシグナルを求めるトレーダー向けに設計された、構造的なトレンド・モメンタム系シグナルインジケーターです。 特に M1 と M5 などの短期時間足で最も効果を発揮します。 このインジケーターは、天井や底を予測するためのものではありません。シグナルを出す前に、確認された市場構造、トレンド方向、モメンタムの強さ、健全なボラティリティ、そしてターゲットまでの十分な値幅を確認します。 主な機能 固定シグナルメカニズム シグナルが確認されると、矢印、Entry、Stop Loss、TP1、TP2 の各レベルはチャート上に永久的に固定されます。 その後のローソク足の動きによって、シグナルが消えたり、移動したり、変更されたりすることはありません。 これにより、トレーダーは各シグナルを明確に確認でき、リアルタイム相場中にシグナルが消えるという一般的な問題を避けることができます。 完全な過去シ
Crystal Quantum Pro
Muhammad Jawad Shabir
5 (3)
CRYSTAL QUANTUM PRO Institutional Signal & Trade Intelligence for MetaTrader 5 Final Price: 199 USD ----> Price goes up 10 USD after every 10 sales. Limited launch slots available, act fast. Most indicators give you an arrow and leave you alone. A naked arrow is a gamble. Winning consistently requires CONFLUENCE , a clear STOP and TARGET , and honest PROOF that the system works. Crystal Quantum Pro delivers all three in one clean, no-repaint package. Crystal Quantum Pro is a complete decision sy
Crystal Heikin Ashi Signals—Professional Trend & Signal Detection Indicator Advanced Heikin Ashi Visualization with Intelligent Signal System for Manual & Automated Trading Final Price: $149 ---------> Price goes up $10 after every 10 sales . Limited slots available — act fast . Overview User Guide PDF Crystal Heikin Ashi Signals is a professional-grade MetaTrader 5 indicator that combines pure Heikin Ashi candle visualization with an advanced momentum-shift detection system. Designed for both m
Power Candles V3 - 自己最適化型強弱インジケーター Power Candles V3は 、通貨や銘柄の強さを、適用されたすべてのチャート上で実行可能なトレードプランに変換します。単にローソク足を色分けするだけでなく、バックグラウンドでリアルタイムの自動最適化を実行し、目の前の銘柄に対して最適なストップロス、テイクプロフィット、およびシグナルの閾値を提示します。ワンクリックで実取引に適用でき、エントリーポイント、ストップロス、テイクプロフィットのラインが正確な価格位置にチャート上に表示され、方向性を示すアラートがリアルタイムで発動します。 このツールは、Stein Investmentsのエコシステムの一部です。  18種類以上のツールをすべて閲覧し、AIを活用したセットアップの推奨事項を入手し、  https://stein.investments でコミュニティに参加しましょう クローズしたバーごとに3,000回以上のトレードシミュレーション。9つの強さの状態。2つの戦略を並行してテスト。勝率の高い設定をワンクリックで適用。 なぜこれが必要なのか ほとんどの強
PainX 400 FAKEOUT DETECTOR MT5 Custom Indicator  ·  Sell-Side Bias  ·  Scalping  ·  RSI(6) Filtered   OVERVIEW   The Spike Fakeout Detector is a non repaint precision technical indicator built exclusively for Crash / PainX synthetic indices on the platform. It is engineered around one of the most consistent and exploitable patterns on this instrument — the false breakout above resistance followed by a sharp price drop. Crash/PainX is a growing index that produces a significant price drop app
Mahra Pro Indicator MT5 Overview Mahra Pro is a MetaTrader 5 chart indicator designed to support structured analysis of XAUUSD (Gold). It combines trend, momentum, volatility and price-structure conditions to identify potential buy and sell setups and display them directly on the chart. The indicator does not open, modify or close trades. All trading decisions and order execution remain under the user's control. Main features • Buy and sell signal arrows on the chart. • Fast and slow EMA lines w
M1 Quantum を使用したライブトレードシグナル : シグナル (取引は 自動的に Quantum Trade Assistant によって実行され、この製品に 無料 で含まれています。) 最新ニュース: バージョン1.64がリリースされました。現在、すべての取引で、関連するサポート/レジスタンスゾーンの後ろにStop Lossが設定されます。今回のバージョンでは、EAのパフォーマンスを向上させるためにSmart Close機能も改善されました。 8月9日から、ライブシグナルはバージョン1.64で稼働しています。 価格プラン: 現在価格: $169 (早期購入者向けオファー) 次回予定価格: $189 予定小売価格: $299 開発者からのお知らせ: ご購入後、 最新の推奨設定ファイル(Set File) 、運用アドバイス、および他の M1 Quantum ユーザーと交流できる VIPサポートグループ への招待をご希望の場合は、お気軽にご連絡ください。 よくある質問 - 設定ファイル - インストールガイド M1 Quantum は、M1専用のプロフェッショナルトレーディング
作者のその他のプロダクト
BTMM State Engine Pro by G-Labs — Beat The Market Maker indicator for MetaTrader 5. Asian session range, London and New York kill zones, level progression (L1/L2/L3), peak formation detection (PFH/PFL), entry signals, and a multi-pair scanner from one chart. Stop scanning charts one pair at a time. The State Engine tracks the BTMM daily cycle automatically — Asian box, room boundaries, level blocks, peak formations, and filtered entries — while the scanner dashboard shows level, peak status, d
Smart Market Structure Pro by G-Labs — ICT and Smart Money Concepts toolkit with built-in multi-symbol scanner for MetaTrader 5. Break of structure, change of character, order blocks, fair value gaps, liquidity sweeps, premium and discount zones, ICT sessions, confluence scoring, AI trade ideas, and a traffic-light scanner across up to 30 pairs and four timeframes from one chart. Map SMC and ICT on the active chart while the built-in scanner monitors your full watchlist. Each cell shows BUY, S
G-Labs Trade Manager by G-Labs — on-chart trade panel for MetaTrader 5. Risk-based lot sizing, visual entry stop and take profit lines, position management, news filter, currency strength, statistics, and OCO breakout tools. One panel for planning, executing, and managing manual trades. Set risk before you click buy or sell, drag stop loss and take profit on the chart, manage open positions and pending orders, and track performance — you stay in control of every decision. Trading utility, not a
BTMM State Engine Pro by G-Labs — Beat The Market Maker indicator for MetaTrader 4. Asian session range, London and New York kill zones, level progression (L1/L2/L3), peak formation detection (PFH/PFL), entry signals, and a multi-pair scanner from one chart. Stop scanning charts one pair at a time. The State Engine tracks the BTMM daily cycle automatically — Asian box, room boundaries, level blocks, peak formations, and filtered entries — while the scanner dashboard shows level, peak status,
Advanced Market Maker Dashboard by G-Labs — Beat The Market Maker multi-pair scanner for MetaTrader 5. Seventeen-column ADR dashboard with price formation, breaker blocks, TDI SharkFin, RSI divergence, stop hunt, daily candle confirmation, currency strength, and chart overlays from one panel. The full BTMM workflow dashboard for traders who have outgrown a basic scanner. Monitor 28 or more pairs in real time: trend direction, peak formation side (PFH/PFL), ADR expansion in MAX and real-time co
Smart Market Structure Pro by G-Labs — ICT and Smart Money Concepts toolkit with built-in multi-symbol scanner for MetaTrader 5. Break of structure, change of character, order blocks, fair value gaps, liquidity sweeps, premium and discount zones, ICT sessions, confluence scoring, AI trade ideas, and a traffic-light scanner across up to 30 pairs and four timeframes from one chart. Map SMC and ICT on the active chart while the built-in scanner monitors your full watchlist. Each cell shows BUY, SE
Connix MT5
Garry James Goodchild
5 (1)
Connix SMC Scanner by G-Labs — ICT and Smart Money Concepts multi-pair dashboard for MetaTrader 5. Order blocks, fair value gaps, break of structure, change of character, VWAP, premium and discount range, and multi-timeframe scanner from one chart. Connix scans multiple symbols across configurable timeframes and shows market structure status in an interactive table while drawing the same structures on the active chart. It is an analytical toolkit — you control every setting; it does not place
Advanced Market Maker Dashboard by G-Labs — Beat The Market Maker multi-pair scanner for MetaTrader 4. Seventeen-column ADR dashboard with price formation, breaker blocks, TDI SharkFin, RSI divergence, stop hunt, daily candle confirmation, currency strength, and chart overlays from one panel. The full BTMM workflow dashboard for traders who have outgrown a basic scanner. Monitor 28 or more pairs in real time: trend direction, peak formation side (PFH/PFL), ADR expansion in MAX and real-time col
G-Labs IC Breaker by G-Labs — ICT source and breaker order blocks for MetaTrader 4. Multi-timeframe structural zones, breaker invalidation on close, retest alerts, and per-timeframe colour control on one chart. Marks where opposing liquidity rested before a move and what happens when structure breaks. Source order blocks draw as outlined rectangles from the first opposite-colour candle after a structural break. When price closes through the tracked extreme, the zone flips to a filled breaker bl
G-Labs Market Maker Dashboard — Beat The Market Maker multi-pair scanner for MetaTrader 4. Peak Formation context (PFH/PFL), ADR cycle expansion, Asian session range, stop-hunt proximity, daily range versus ADR, and M15 RSI from one panel. Monitor your full watchlist without opening a chart for every pair. The dashboard scans symbols in real time and shows where each one sits in a BTMM-style daily workflow: peak formation side, movement in average daily range multiples, Asian range behaviour, s
G-Labs Trade Manager by G-Labs — on-chart trade panel for MetaTrader 4. Risk-based lot sizing, visual entry stop and take profit lines, position management, currency strength, statistics, and OCO breakout tools. One panel for planning, executing, and managing manual trades. Set risk before you click buy or sell, drag stop loss and take profit on the chart, manage open positions and pending orders, and track performance — you stay in control of every decision. Trading utility, not a black-box si
Connix Multi-Timeframe SMC Dashboard by G-Labs — ICT and Smart Money Concepts scanner for MetaTrader 4. Order blocks, fair value gaps, BOS, CHoCH, VWAP, and premium-discount range across 29+ pairs from one chart. Monitor market structure on your full watchlist without flipping charts — the Connix dashboard shows OB, FVG, structure breaks, VWAP status, and range position per symbol and timeframe while drawing the same zones on the active chart. Connix scans multiple symbols across configurable
G-Labs MagicLines by G-Labs — multi-currency cycle and trend dashboard for MetaTrader 4. Heikin-Ashi cycle detection, trend-filtered MagicLine, VWAP MagicLine, multi-pair scanner, Trade Helper panel, and entry suggestions with stop loss and take profit levels from one chart. MagicLines combines three analysis layers on each symbol. Heikin-Ashi cycle logic marks whether a pair is in an up or down cycle and records the structural anchor (swing high or low) where the cycle began. A trend-filtered
G-Labs MagicLines — multi-currency cycle and trend dashboard for MetaTrader 5. Heikin-Ashi cycle detection, trend-filtered MagicLine, VWAP MagicLine, multi-pair scanner, Trade Helper panel, and entry suggestions with stop loss and take profit levels from one chart. MagicLines combines three analysis layers on each symbol. Heikin-Ashi cycle logic marks whether a pair is in an up or down cycle and records the structural anchor (swing high or low) where the cycle began. A trend-filtered MagicLine
G-Labs IC Breaker by G-Labs — ICT source and breaker order blocks for MetaTrader 5. Multi-timeframe structural zones, breaker invalidation on close, retest alerts, and per-timeframe colour control on one chart. Marks where opposing liquidity rested before a move and what happens when structure breaks. Source order blocks draw as outlined rectangles from the first opposite-colour candle after a structural break. When price closes through the tracked extreme, the zone flips to a filled breaker bl
フィルタ:
レビューなし
レビューに返信