Key Zone

Please refer to full version:

https://www.mql5.com/en/market/product/140908
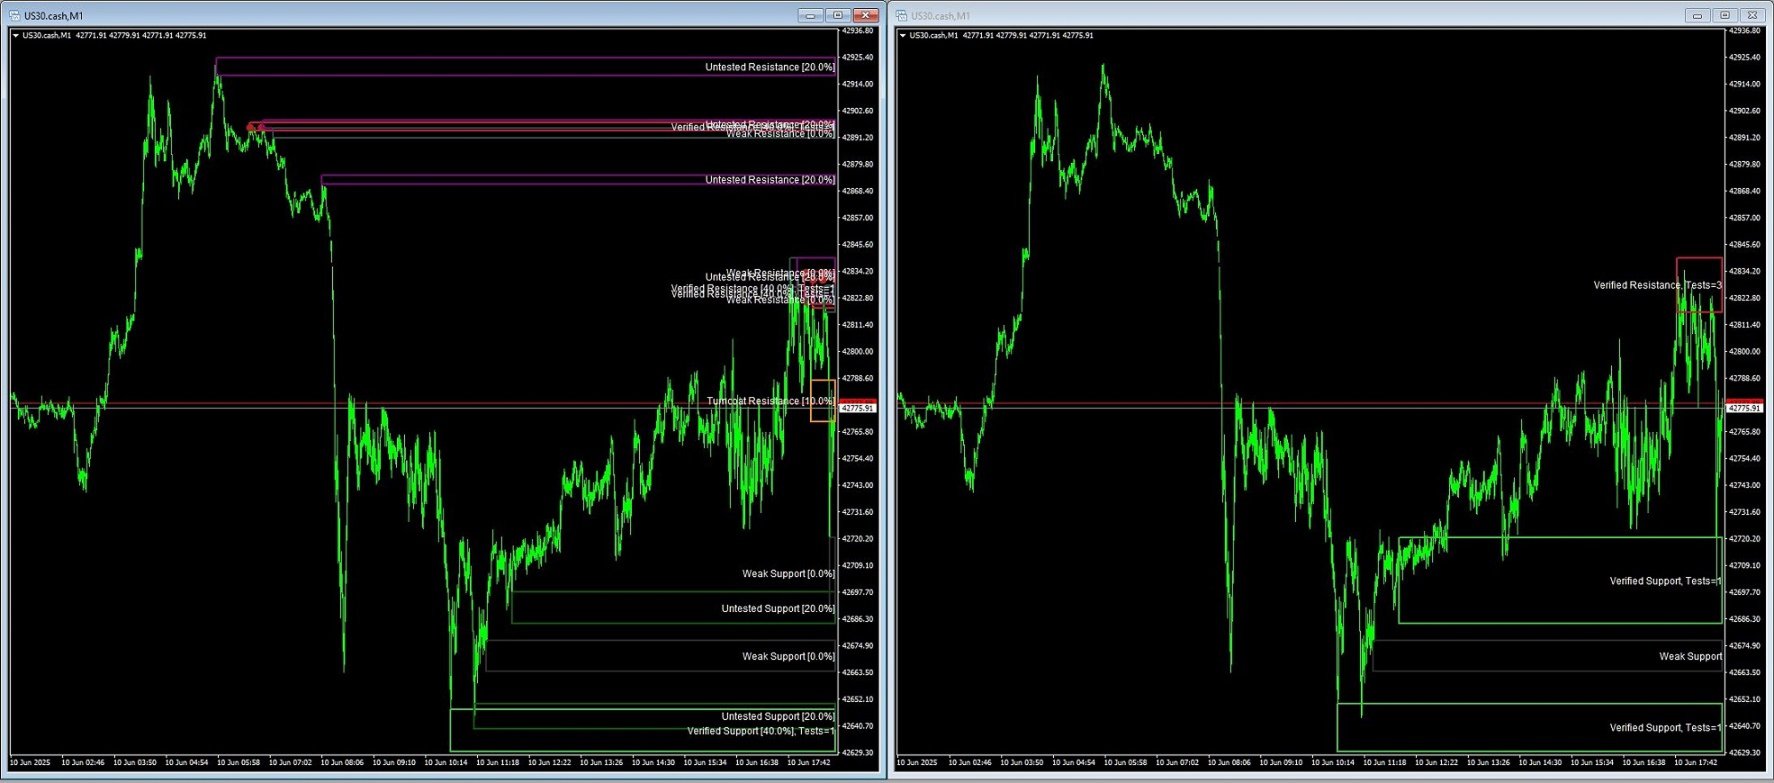
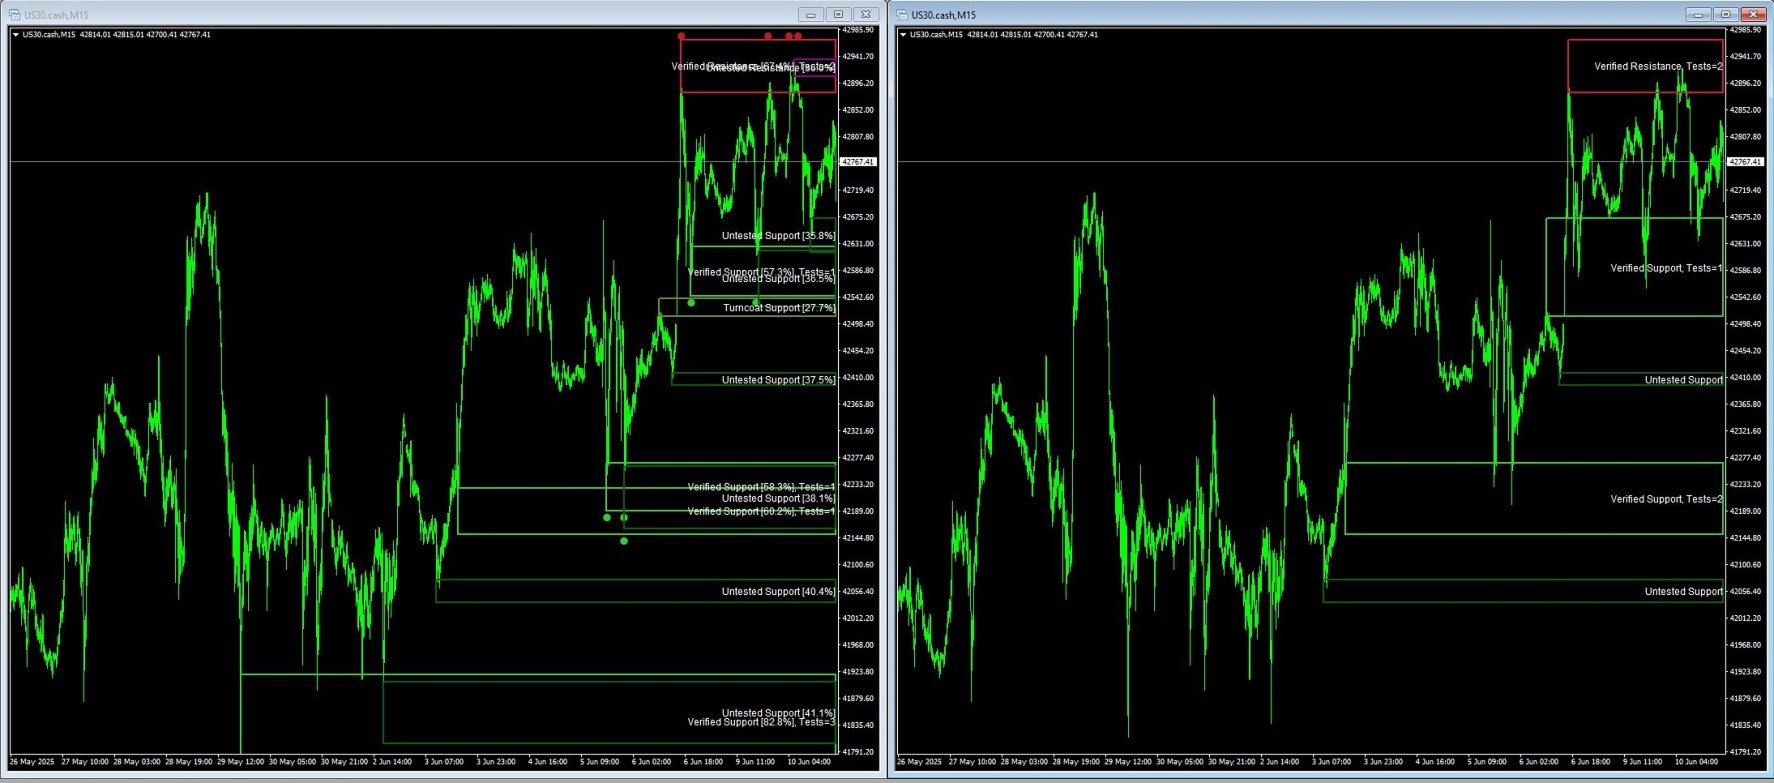

Key Zone Detector

Key Level Supply & Demand Zone Detector


Overview

A sophisticated supply and demand zone detection indicator that identifies and rates key price levels where significant market activity occurs. The indicator uses fractal analysis and multiple validation methods to detect and classify trading zones.

Key Features

Zone Detection

  • Auto-detects support and resistance zones
  • Uses dual fractal system (fast and slow) for confirmation
  • Dynamic zone thickness based on ATR (Average True Range)
  • Merges overlapping zones for cleaner display

Zone Classification

  • Proven Zones: Tested 4+ times, highest reliability
  • Verified Zones: Tested 1-3 times, good reliability
  • Untested Zones: New zones awaiting first test
  • Turncoat Zones: Zones that switched from support to resistance or vice versa
  • Weak Zones: Zones with lower probability of holding

Strength Rating System

  • Calculates zone strength percentage (0-100%)
  • Considers multiple factors:
    • Zone age (30% weight)
    • Number of tests (40% weight)
    • Recent test activity (30% weight)

Visual Features

  • Color-coded zones based on strength and type
  • Test point markers showing where price tested each zone
  • Customizable zone appearance (solid/outline, width, style)
  • Extendable zones to current price
  • Optional fractal points display

Alert System

  • Price entry alerts for zones
  • Customizable popup and sound notifications
  • Adjustable alert timeout settings

Customization Options

  • Historical lookback period
  • Zone thickness factor
  • Text and label settings
  • Color schemes for different zone types
  • Display filters for weak/untested/turncoat zones
  • Fractal sensitivity settings

This indicator is particularly useful for:

  • Identifying key support and resistance levels
  • Understanding zone strength and reliability
  • Planning entries and exits
  • Risk management around key price levels


おすすめのプロダクト
Supply and Demand Indicator + FREE Currency Strength Meter ADD-ON Looking for a powerful tool that can help you identify the most reactive zones in the forex market? Our supply and demand indicator for MetaTrader 4 and 5 is exactly what you need. With its advanced algorithms and real-time analysis, this indicator helps traders of all experience levels make informed trading decisions. The supply and demand indicator is a cutting-edge tool that helps traders identify areas where buyers and seller
This script generate close order history to a text file including order information such as    - TicketNumber, OpenTime, Type, Volume, Symbol,     - Price, S/L, T/P, CloseTime, Price, Commission,     - Swap, Profit, MagicNumber, Comment Text File located at \MQL4\Files   Please leave a comment or send me an email if you have any idea. #FF8,#FF10,#FF11,#WayneClassIsTheBest Email: fxac19@gmail.com
FREE
️ Ultimate Account Protection for Serious Traders The   Equity Protector Pro   is a professional-grade safety system that automatically safeguards your trading capital using advanced multi-level profit protection logic. Designed for traders using any strategy (manual or automated), this EA acts as your 24/7 risk manager to lock in gains and prevent account blowouts. Key Features:   3-Stage Protection System Level 1:   Base equity floor protection Level 2:   Dynamic trailing stop Level 3:
FREE
Vault Depth Indicator は、MetaTrader 4 向けの 非リペイント 型トレンドツールであり、3 つの測定可能なコンセプトを軸に構成されています。すなわち、パルスエンジンによるバーごとの「確信度」トラッキング、平均絶対偏差(Mean Absolute Deviation)を用いたボラティリティ適応型バンド、そして飽和ピーク崩壊を利用した構造レベル(重要価格帯)の検出です。各バーで買い手・売り手の関与度を追跡し、確信度が最も強くなった価格帯に自動でゾーンを設置し、価格がクールダウン条件を満たしたうえでそのゾーンを再テストしたときにシグナルを発します。トレンド反転矢印は、バンドの確定クロスが起きたタイミングで決定論的に表示されます。シグナルロジックは任意の平滑化表示ラインではなく「生の」バンド値を使用するため、再読み込みや時間足変更後でもシグナル位置は再現可能です。 MT5 版はこちら:  Vault Depth MT5 その他の製品はこちら:   全プロダクト リアルタイムの使用例や新ツールについては、プロフィールを訪問してフレンド申請をお送りください。最新情報
FREE
A technical indicator that calculates its readings on trading volumes. In the form of a histogram, it shows the accumulation of the strength of the movement of the trading instrument. It has independent calculation systems for bullish and bearish directions. Works on any trading instruments and time frames. Can complement any trading system. The indicator does not redraw its values, the signals appear on the current candle. It is easy to use and does not load the chart, does not require addition
The Game-Changing Engulfing Candle Hunter - Your Guide to Profitable Trend Trading Step into the realm of trading possibilities with our revolutionary product - The Engulfing Hunter. Designed by traders for traders, this dynamic indicator combines the potency of engulfing candlestick patterns and the versatility of proprietary trend detection system, offering a trading edge unlike any other. Engulfing candlestick patterns have always been a revered tool in the arsenal of seasoned traders. Acting
Reverse side scalper is the manual trading system, that works on choppy(anti-trend) market. As a rule markets are on 80% choppy and only 20% is trend phase. System is based on custom step Moving and RSI and reverse pattern. System defines up movement, down movement, trend / choppy phases. Indicator plots Buy signal arrow when current direction is down and phase is trend, Sell signal arrow is plotted when currently is up movement and phase is trend. As a rule it allows to "catch" local maximum/mi
Ugenesys AI MT4
Odaine Ramon Mcmillan
5 (1)
uGenesys AI - 90% Accurate Daytrading Indicator Introducing the ultimate forex trading indicator system, uGenesys AI, powered by cutting-edge AI technology and advanced analytical techniques, including Time-Series Analysis and Genetic Algorithms. Our AI-powered trading system leverages the power of time-series analysis to identify trends and patterns in historical price data, allowing traders to make informed predictions about future market movements. By analyzing vast amounts of data, our syst
Indicator (includes Volume Profile + Order Blocks) - a revolutionary indicator that combines two of the most powerful concepts of modern technical analysis: volume profiles and institutional players' order blocks. This tool allows you to see what is hidden from most traders and gives you a significant advantage in the market. Key benefits of the indicator: Visualization of "smart money": Clearly shows the areas of concentration of large players, highlighting areas with maximum volume in bright
Crypto_Forex MT4用インジケーター「 Trend Flat Pro Histogram 」(リペイント不要) - 「Trend Flat Pro Histogram」インジケーターは非常に高感度で、標準的な移動平均線よりもはるかに効率的です。 - 現在の市場状況(フラット、上昇トレンド、下降トレンド)を表示するように設計されています。 - インジケーターは3色で表示されます。フラット市場状況は黄色、下降トレンドは赤、上昇トレンドは緑です(色は設定で変更できます)。 - モバイルとPCの両方でアラート機能を搭載しています。 - このインジケーターは、プライスアクション、スキャルピング、モメンタムトレード、その他のインジケーターなど、他の取引手法と組み合わせるのに最適です。 - インジケーターには情報ディスプレイが搭載されており、接続された通貨ペアの現在のスプレッドとスワップが表示されます。 - 画面には、口座残高、エクイティ、マージンも表示されます。 - 情報ディスプレイはチャートの任意の場所に配置できます。 高品質のトレーディングロボットとインジケーターをご覧になるには
Multi Strategies Single Combined   Select from up to 6 Strategies solo or Combine different strategies for signal generation  (Combining more than 2 strategies may LIMIT a lot the number of signals)! ALL inputs and Strategies selection From Chart !!! Also Inputs editing from Chart !!! Push your strategy bottom (one strategy) OR Combine signal from as may strategies (up to 6) : Selected and enabled strategies will be in GREEN !!! 1- BUY SELL areas 2- Support resistance break signal 3- Elliot wave
The Super Volume Trend indicator uses a set of algorithms and indicators. The purpose of this indicator is to find healthy trends with specific volume movements. It uses some filtering systems to find these trends. The indicator is easy to use, simple and understandable. This is a standalone trend indicator which does not need additional indicators. Users can apply it together with other indicators that are appropriate to their strategy. Suggestions and working style The period settings have be
VIP signal for binary options. This indicator was created specifically for binary options. Set up for profitable work in binary options. Try this indicator if you want to trade binary options profitably. The terms of trade are very simple. We are waiting for directions. We open a deal on the current timeframe in the direction. < < < Indicator non repaint > > > Many users have already rated it positively. The results will surprise you too. According to the test results, this indicator per
OrderFlow Absorption – MT4用プロフェッショナル・デルタ&アブソープションシグナルインジケーター OrderFlow Absorptionで本物のオーダーフロー分析の力を解き放ちましょう。MetaTrader 4向けの究極のデルタヒストグラム&アブソープションシグナルインジケーターです。あらゆる価格変動の裏側で何が起きているのかを知りたいトレーダーのために設計されており、市場を動かす隠れた買い/売り圧力や吸収イベントを明らかにします。 特徴 デルタヒストグラムの可視化:   買い圧力・売り圧力を色分けされたヒストグラムで即座に表示。 アブソープションシグナル検出:   高度なロジックで強気・弱気の吸収イベントを特定し、反転の兆しを早期に通知。 チャートマーカー:   吸収シグナルをチャート上に直接マークし、視覚的に分かりやすく表示。 ポップアップアラート:   新しい吸収シグナルが出現した際にリアルタイムで通知。 カスタマイズ可能な閾値:   弱いシグナルを除外し、高確率のセットアップに集中。 リソース管理:   大きなチャートでも高速に動作する効率的な計算。
The Magneto Volume Trigger indicator is designed for determining the volume confirmed by the candlestick pattern and predicting the trend tendency. Indicator setup and use The calculation of values is affected by two parameters - Period and Gate . The lower the value of Gate , the higher the sensitivity of the indicator. Period allows making a sample of data for the specified number of candles. The lower the value of Period , the more the indicator is adapted to the current market conditions. I
Forex Blow Up Manager The Spacial Forex Blow up Manager is help you account order on  insufficient margin. Start the program when it reaches the margin level you entered,the system find out maximum profit order & cut off. Avoid the largest loss order closed by the broker due to insufficient margin. The Para Lower Margin Level Start Close Order - if margin level below value, start cut off order Lower Margin Level End Close Order -if margin level greater then value ,stop cut off order Use Open O
Entry Volume Zones helps traders find better trade entry locations by highlighting recent volume-based support and resistance zones and key volume levels. The tool is designed mainly for planning trade entries, but it can also be used as a broader support and resistance indicator based on volume. Built for Traders Who Want To: Plan cleaner entries   from strong volume-based support and resistance zones. Improve reward-to-risk potential   by finding better entry locations, while keeping the ori
The   Visual Volatility Clustering   indicator clusters the market based on volatility. The indicator does not redraw and gives accurate data, does not use closing prices. Uses the opening prices or the highs or lows of the previous completed bar. Therefore, all information will be clear and unambiguous. The essence of the indicator is to divide the price market into certain areas according to a similar type of volatility. This can be done in any way. In this example, the indicator is configure
User friendly Interface. On panel fat finger protection. High speed for sending   manual  orders. Auto follow up for manual orders placed by the panel. Highly customized parameters for automated or manual buy/sell orders. Customized  money management system. Advanced users can choose their buy/sell decision according to their views and leave the rest to the EA to follow up their initial decisions. Beginners can fully rely on the built-in technology  to make transaction decisions. Users can limi
Crypto_Forexインジケーター「 MFI FLAT Detector 」は、取引における効率的な補助ツールです!リペイント不要。 このMT4対応の優れたインジケーターで、取引手法をアップグレードしましょう。 - このインジケーターは、チャート上の価格がフラットな領域を表示します。「フラット感度」パラメータが搭載されており、フラットな領域を検知します。 - 「MFI FLAT Detector」はダイバージェンス検知に非常に有効で、プライスアクションとの組み合わせにも最適です。 - トレンドフォローシステムでフラットゾーンを検知し、そこでの取引を回避するために使用できます。 - リバーサルスキャルピング(フラットな領域からの反転を狙う取引)にも使用できます。 - 標準的なMFIオシレーターの代わりに「MFI FLAT Detector」を使用する機会は数多くあります。 - Money_Flow_Index (MFI) 自体は、価格と出来高データを用いて売られ過ぎと買われ過ぎの領域を特定するテクニカルオシレーターです。 - MFIが80を超える場合は買われ過ぎから売りエントリーし
MV Liquidity Sniper High EA If you’re the type who doesn’t like staring at charts all day, this EA is built to help simplify your trading flow with a more structured setup. This EA uses High Line (HA) as Liquidity Level together with momentum detection to automate entries, exits, and recovery flow. Simple concept: Price closes above the HA High Line → BUY Price closes below the HA High Line → SELL The EA continuously follows market direction based on the active High Line level. Entry Logic The
User friendly Interface. On panel fat finger protection. High speed for sending   manual  orders. Auto follow up for manual orders placed by the panel. Highly customized parameters for automated or manual buy/sell orders. Customized  money management system. Advanced users can choose their buy/sell decision according to their views and leave the rest to the EA to follow up their initial decisions. Beginners can fully rely on the built-in technology  to make transaction decisions. Users can limi
Using multiple timeframes for analysis with Multi Timeframe Bollinger Bands  can provide several significant benefits for traders: Comprehensive Market View: By applying Mtf Bands Standard across different timeframes, traders gain a broader perspective on market dynamics. This allows them to identify trends, patterns, and potential reversal points that might be more apparent or consistent across various scales. Enhanced Pattern Recognition: Multiple timeframes help in identifying repeating patte
FREE
This indicator is based on the Weis wave principle of wave volume. Below are few features of the indicator It draws the wave on the chart while the accumulated volume per wave in a different window at the bottom of the chart You can configure the turning point move It displays the accumulated volume (in thousands, eg for 15000 volume it will show 15) at the end of each wave You can also configure to show number of candles in the wave along with the wave volume The indicator calculates the distin
Volume Profile Sniper v11.1は、包括的な市場分析ツールです 取引への専門的なアプローチ ボリュームプロファイルスナイパー v11.1は、市場状況の包括的な評価に基づいて明確な信号を提供し、一つの指標に15以上の主要なフィルタを組み合わせ 主な特長 ボリューム不均衡分析-アルゴリズムは、各キャンドルの買い手と売り手のシェアを計算し、当事者の1つの優位性を通知します(50%から90%までの設定可能なしきい値)。 マルチレベル信号フィルタリング-インジケータは考慮されます: トレンド指標(9/21) 買われ過ぎ/売られ過ぎゾーンを除くRSI キャンドルパターン(ピンバー、吸収、ハンマー) サポート/抵抗レベル(自動検出) 主要なプレーヤーの活動を識別するためのボリュームスパイク クラシックと増幅されたRSIの相違 ボラティリティ評価のためのATR 傾向の強さを決定するためのADX 価格アクション(内部バーと外部バー) 複数の時間枠の確認 市場構造(高値/安値) セッションフィルタ(アジア、ロンドン、ニューヨークセッション) ニュースの
The brand new trading indicator using the box breakout strategy is presented by KING.Ai. This indicator with four-mode alerts is developed by KING.Ai ONLY. It is probably impossible that you could find a box breakout indicator like this one. It is very difficult for you to trade with the box breakout strategy as there is limited time for traders to monitor every currency. However, the box breakout strategy is very profitable. It is because when the price breaks the box, the trend will go further
Meet the Tweezer Hunter, an essential tool for every Forex trader looking to make accurate, trend-following trades. This powerful, intuitive indicator helps traders spot potential trend reversals before they happen, providing a significant advantage in the fast-paced world of Forex trading. The Tweezer Hunter is more than your average tweezer candle indicator; it's designed with a built-in trend identification feature that accurately detects whether the market is bearish or bullish. By integrat
Wild Baboon Zone Recovery - 無料版 Wild Baboon Zone Recovery は、構造化されたゾーンリカバリーとバスケット管理手法をテストするために設計された無料の MetaTrader 4 エキスパートアドバイザーです。この EA は、完全な商用版を検討する前に、ストラテジーテスターまたはデモ口座でリカバリー型の取引ロジックを評価したいトレーダー向けです。 主な機能 バスケットベースの取引管理のためのゾーンリカバリーロジックを実装 買いと売りの両方のリカバリーサイクルに対応 リカバリー距離、ロットサイズ、間隔パラメータを設定可能 ユーザー定義の入力に基づくバスケット目標管理 上位時間足のトレンド方向と連動する EMA ベースのエントリーシグナル 市場状態を確認するための ADX と Choppiness Index フィルター リスク管理のためのセッションフィルターと金曜日保護オプション バスケット状態、ゾーンレベル、口座データ、サイクル情報を表示するビジュアルダッシュボード 主要な Forex ペアに対応し、XAUUSD は調整された間隔設定で
FREE
Here   our more valuable tools SMC Trend Trading   ,  Easy SMC Trading  ,  Institutional SMC Architect Volume Analysis Tools  ,  Volume flow Profile  ,  Market volume profile  , FVG with Volume  , Liquidity Heatmap Profile  ,  Volume Spread Analysis The Market Profile & Volume Profile Indicator is a powerful technical analysis tool designed to visualize market activity and price distribution over specific timeframes. Unlike standard technical indicators that focus solely on price over time, th
Crypto_Forexインジケーター「 Major_Trend_Correction Histogram 」(MT4用、リペイント機能なし) - Major_Trend_Correction Histogramインジケーターは、大きなトレンドを検知するために設計されています。 - インジケーターは2色で表示されます。赤は弱気トレンド、青は強気トレンドです(色は設定で変更できます)。 - ヒストグラムの列が10列以上連続して同じ色の場合、新しいトレンドの始まりを意味します。 - インジケーターにはモバイルとPCの両方でアラートが通知されます。 - パラメーター「Period」はインジケーターの感度を決定します。 買いトレードの場合: 1) ヒストグラムの列が10列以上連続して青色の場合、新しい上昇トレンドの始まりを意味します。 2) その後、反対色の赤色の列が1つまたは2つ発生し、その後に主要トレンドの青色の列が続く場合、上昇トレンドの修正です。 3) 修正後、買いトレードを開始できます。 売りトレードの場合: 1) ヒストグラムの列が少なくとも10列連続して赤色になっているか
このプロダクトを購入した人は以下も購入しています
Neuro Poseidon is a new indicator by Daria Rezueva. It combines precise trading signals with adaptive TP/SL levels - creating best possible trades as a result! Message me and get  Neuro Poseidon Assistant  as a gift to automize your trading process! What makes it stand out? 1. Proven profitability on all assets and timeframes 2. Only confirmed BUY and SELL signals present on the chart 3. Adaptive TP & SL levels generated by the software for each trade 4. Easy to understand - suitable for all
M1 SNIPER は使いやすいトレーディングインジケーターシステムです。M1時間足向けに設計された矢印インジケーターです。M1時間足でのスキャルピングのためのスタンドアロンシステムとして、また既存のトレーディングシステムの一部としても使用できます。このトレーディングシステムはM1時間足での取引に特化して設計されていますが、他の時間足でも使用できます。元々、この手法はXAUUSDとBTCUSDの取引用に設計しましたが、他の市場においても役立つと考えています。 インジケーターのシグナルは、トレンドの方向と逆方向に取引できます。インジケーターのシグナルを利用して両方向に取引するのに役立つ特別な取引テクニックをご紹介します。この手法は、特別な動的なサポートとレジスタンスの価格帯を利用することに基づいています。 ご購入後、M1 SNIPER矢印インジケーターをすぐにダウンロードできます。さらに、M1 SNIPERツールのすべてのユーザーに、以下のスクリーンショットに表示されているApollo Dynamic SRインジケーターを無料で提供しています。この2つのインジケーターを組み合わせることで
Gann Made Easy は、ミスター・ギャンの理論を使用した取引の最良の原則に基づいた、プロフェッショナルで使いやすい外国為替取引システムです。 W・D・ガン。このインジケーターは、ストップロスとテイクプロフィットレベルを含む正確な買いと売りのシグナルを提供します。 PUSH通知を利用して外出先でも取引可能です。 ご購入後、取引方法の説明と優れた追加インジケーターを無料で入手するには、私にご連絡ください! おそらく、ギャンの取引手法についてはすでに何度も聞いたことがあるでしょう。通常、ギャンの理論は初心者のトレーダーだけでなく、すでにある程度の取引経験がある人にとっても非常に複雑なものです。なぜなら、ギャンの取引手法は理論的にはそれほど簡単に適用できるものではないからです。私はその知識を磨き、最良の原則を私の外国為替インジケーターに組み込むために数年を費やしました。 このインジケーターは非常に簡単に適用できます。必要なのは、それをチャートに添付し、簡単な取引推奨事項に従うだけです。このインジケーターは常に市場分析の仕事を行い、取引の機会を探します。適切なエントリーポイントを検出す
Dynamic Forex28 Navigator - 次世代の Forex 取引ツール。 現在 49% オフ。 Dynamic Forex28 Navigator は、長年人気のインジケーターを進化させたもので、3 つの機能を 1 つにまとめています。 Advanced Currency Strength28 インジケーター (レビュー 695 件)  + Advanced Currency IMPULSE with ALERT (レビュー 520 件) + CS28 コンボ シグナル (ボーナス)。 インジケーターの詳細 https://www.mql5.com/en/blogs/post/758844 次世代の Strength インジケーターが提供するもの  オリジナルで気に入っていたすべての機能が、新機能と精度の向上によって強化されました。 主な機能: 独自の通貨強度計算式。 すべての時間枠でスムーズかつ正確な強度ライン。 トレンドの特定と正確なエントリーに最適です。 ダイナミックマーケットフィボナッチレベル (マーケットフィボナッチ)。 このインジケーターに固有
Scalper Inside PRO Scalper Inside PRO は、MetaTrader 4 向けの短期トレンドおよびスキャルピング用インジケーターです。独自アルゴリズムを用いて、市場の方向性と主要なターゲットレベルを素早く検出します。エントリー、イグジット、複数の利確ターゲットを自動計算し、詳細なパフォーマンス統計を表示することで、さまざまな銘柄やストラテジーがどのように機能してきたかを確認できます。これにより、現在のマーケットコンディションに最も適した取引銘柄を選択するのに役立ちます。さらに、Scalper Inside PRO には、お使いの矢印インジケーターを簡単に接続でき、その統計と過去のパフォーマンスを素早く評価できます。 本インジケーターは、あらゆる銘柄と時間足で動作し(短期トレードには M5 を推奨)、複数の内蔵ストラテジーを備えています。そのため、単体のスキャルピングツールとしても、トレーディングシステム内の強力な分析コンポーネントとしても活用できます。 主な機能 独自アルゴリズム(Next‑Generation Trend Detection Algor
Enigmera
Ivan Stefanov
5 (8)
ENIGMERA: 市場の中心 重要:MQL5.comのデモはStrategy Testerで実行されており、Enigmeraの機能を完全には反映していない場合があります。詳細については、説明、スクリーンショット、ビデオをご確認ください。質問があれば、遠慮なくメッセージを送ってください! インジケーターのコードは完全に書き直されました。バージョン3.0は新機能を追加し、インジケーターの開始以来蓄積されたバグを修正しました。 紹介 このインジケーターとトレーディングシステムは、金融市場への注目すべきアプローチです。ENIGMERAはフラクタルサイクルを使用して、サポートとレジスタンスのレベルを正確に計算します。真の蓄積フェーズを示し、方向と目標を提供します。トレンドでも修正でも機能するシステムです。 動作方法 インジケーターのほとんどの機能は、チャートの左側にあるボタンで制御され、市場の状況に迅速に対応できるようになっています。 ボタン ON/OFF – インジケーター全体を表示または非表示にします。 Channel – サポートチャネルを有効にし、許容範囲の偏差を示します。 Dev
多くの矢印インジケーターは、シグナルだけを表示して、その後の判断はすべてトレーダー任せです。KT Alpha Hunter Arrows は、最初から完成されたトレードプランを提供します。 各シグナル矢印が表示されると、エントリーライン、ストップロス、4つのテイクプロフィット水準、そして現在の銘柄と時間足を今トレードする価値があるかを示すリアルタイムのエッジ判定が、チャート上にまとめて描画されます。付属の Trade Manager EA は、手動でエントリーした後の管理をサポートし、相場が荒れて感情が揺れやすい場面でも、トレードの規律を保ちやすくします。リペイントなし。確定足のみでシグナルを表示。Forex、ゴールド、指数、その他あなたが取引するあらゆる銘柄向けに設計されています。 主な機能 リペイントしない買い・売り矢印。シグナルは足が確定した後にのみ表示されます。 各シグナルにエントリーライン、構造的なストップロス、4つのテイクプロフィット水準を表示。 Edge Dashboard が、現在のチャート上で買いと売りのセットアップを個別に評価。 判定システム:No Edge、Ma
Trend Catcher ind
Ramil Minniakhmetov
5 (2)
トレンドキャッチャーインジケーター トレンドキャッチャーインジケーターは、開発者独自の適応型トレンド分析指標を組み合わせることで、市場価格の動きを分析します。短期的なノイズを除去し、根底にあるモメンタムの強さ、ボラティリティの拡大、価格構造の挙動に焦点を当てることで、真の市場方向性を特定します。また、移動平均線、RSI、ボラティリティフィルターなどの平滑化およびトレンドフィルタリング機能を備えたカスタマイズ指標も使用します。 実際の運用状況のモニタリングやその他の製品については、こちらをご覧ください: https://www.mql5.com/en/users/mechanic/seller ご注意ください。私はTelegramでEAや設定を販売していません。詐欺です。すべての設定はブログで無料で公開しています。 重要!ご購入後すぐにご連絡ください。手順とボーナスをお送りします!
PRO Renko Systemは、特別にRENKOチャートを取引するために設計された高精度の取引システムです。 これは、様々な取引商品に適用することができる普遍的なシステムです。 システムは効果的に正確な逆転信号へのアクセスを与えるいわゆる市場の騒音を中和する。 表示器は非常に使いやすく、信号の生成に責任がある1つの変数だけがあります。 あなたは簡単にお好みの任意の取引ツールとレンコバーのサイズにツールを適応させることができます。 私はいつもあなたが私のソフトウェアで収益性の高い取引を支援するために余分なサポートを提供する準備ができています! 私はあなたに幸せで収益性の高い取引をしたいです! ご購入後にご連絡ください! 私はあなたに私のレンコチャートジェネレータを送信します。 私はまた、私の個人的な推奨事項やシステムの他のモジュールを無料で共有します!
トレンドラインプロ   市場の真の方向転換点を理解するのに役立ちます。この指標は、真のトレンド反転と主要プレーヤーが再び参入するポイントを示します。 分かりますか     BOSライン   複雑な設定や不要なノイズなしに、より長い時間足でのトレンドの変化と重要なレベルを把握できます。シグナルは再描画されず、バーが閉じた後もチャート上に残ります。 VERSION MT 5     -     RFI LEVELS PRO インジケーター と組み合わせることで、その潜在能力を最大限に発揮します。 インジケーターが示す内容: 本当の変化   トレンド(BOSライン) 一度シグナルが現れたら、それは有効です!これは、リペイント機能を持つインジケーターとの重要な違いです。リペイント機能を持つインジケーターは、シグナルを発した後、それを変更し、資金の損失につながる可能性があります。これにより、より高い確率と精度で市場に参入できます。また、矢印が現れた後、目標値(利益確定)に達するか、反転シグナルが現れるまで、ローソク足の色を変更する機能もあります。 繰り返しエントリ       主要プレーヤーの
Genesis Matrix Pro is a professional multi-timeframe trend detection indicator designed to help traders identify high-quality market alignment with clarity and structure. It combines 12 different technical indicators into one visual alignment matrix, allowing traders to quickly see when market conditions are bullish, bearish, or neutral. A signal is generated only when the selected strategies are aligned, helping reduce noise and improve decision-making. PLEASE CONTACT ME AFTER PURCHASE TO GET
この製品は 2026 年の市場向けに更新され、最新の MT5 ビルドに最適化されています。 価格更新のお知らせ: Smart Trend Trading System は現在 $99 で提供されています。 次の 30 件の購入 後、価格は $199 に上がります。 特別オファー: Smart Trend Trading System を購入後、私にプライベートメッセージを送ることで、 Smart Universal EA を無料 で受け取り、Smart Trend のシグナルを自動売買に変えることができます。 Smart Trend Trading System は、リペイントなし、再描画なし、遅延なしの完全なトレーディングシステムです。よりクリーンなシグナル、より明確なトレンド方向、そしてより整理された取引方法を求めるトレーダー向けに作られています。 Online course , manual and download presets . このシステムは、トレンド検出、反転ゾーン、Smart Cloud、トレーリングストップロジック、サポートとレジスタンス、ローソク足の色分け、ア
トレンドトレーディング は、タイミングのプルバックとブレイクアウトにより、市場で起こっているトレンドから可能な限り利益を得るように設計された指標です。確立されたトレンドの中で価格が何をしているかを分析することにより、取引の機会を見つけます。 [ インストールガイド | 更新ガイド | トラブルシューティング | よくある質問 | すべての製品 ] 自信を持って効率的に金融市場を取引する むち打ちにならずに確立されたトレンドから利益を得る 収益性の高いプルバック、ブレイクアウト、早期の逆転を認識する この指標は、独自の品質とパフォーマンスを分析します 複数時間枠のダッシュボードを実装します インジケーターは再描画されていません 電子メール/音声/視覚アラートを実装します 確立されたトレンドは多くの取引機会を提供しますが、ほとんどのトレンド指標はそれらを完全に無視しています。インジケーターの解釈はかなり簡単です: (1) トレンドの変化 (2) トレンドの方向への後退 (3) トレンドの方向へのブレイクアウト 赤いダッシュ は下降トレンド中の修正です 青いダッシュ は上昇トレンド中
Step into the world of Forex trading with confidence, clarity, and precision using   Gold Indicator   a next-generation tool engineered to take your trading performance to the next level. Whether you’re a seasoned professional or just beginning your journey in the currency markets, Gold Indicator equips you with powerful insights and help you trade smarter, not harder. Built on the proven synergy of three advanced indicators, Gold Indicator focuses exclusively on medium and long-term trends eli
スイングトレーディング は、トレンドの方向のスイングと可能な反転スイングを検出するように設計された最初のインジケーターです。トレーディングの文献で広く説明されているベースラインスイングトレーディングアプローチを使用します。インディケータは、いくつかの価格と時間のベクトルを調査して、全体的なトレンドの方向を追跡し、市場が売られ過ぎまたは買われ過ぎて修正の準備ができている状況を検出します。 [ インストールガイド | 更新ガイド | トラブルシューティング | よくある質問 | すべての製品 ] むち打ちを起こさずに市場スイングの利益 インジケーターは常にトレンドの方向を表示します 色付きの価格帯は機会のベースラインを表します 色付きのダッシュは、可能な反転スイングを表します この指標は、独自の品質とパフォーマンスを分析します 複数時間枠のダッシュボードを実装します カスタマイズ可能なトレンドおよびスイング期間 電子メール/サウンド/プッシュアラートを実装します インジケータは再描画またはバックペインティングではありません Swing Tradingとは Swing Tradingは
Current event:  https://c.mql5.com/1/326/A2SR2025_NoMusic.gif A. A2SR とは何ですか ?   * 先行テクニカル指標です (塗り直しなし、ラグなし)。 -- ガイダンス : -- https://www.mql5.com/en/blogs/post/734748/page4#comment_16532516 -- そして https://www.mql5.com/en/users/yohana/blog A2SR には、サポート (需要) とレジスタンス (供給) のレベルを決定する特別な手法があります。 ネットで見かける通常の方法とは異なり、A2SR は実際の SR レベルを決定する独自のコンセプトを持っています。 元の手法はインターネットから取得されたものではなく、インターネット上で公開されたこともありません。 A2SR は、取引スタイルに応じて SR レベルを自動選択します。 時間枠を変更しても、SR レベルはその位置にとどまります。 実際のSRは、使用する時間枠から取得されるわけではないため. A2SR
BTMM State Engine Pro is a MetaTrader 4 indicator for traders who use the Beat The Market Maker approach: Asian session context, kill zone timing, level progression, peak formation detection, and a multi-pair scanner from a single chart. It combines cycle state logic with a built-in scanner dashboard so you do not need the same tool on many charts at once. What it does Draws the Asian session range; session times can follow broker server offset or be set in inputs. Tracks level progression (L
「 Dynamic Scalper System 」インジケーターは、トレンド波の中でスキャルピング取引を行う手法のために設計されています。 主要通貨ペアと金でテスト済みで、他の取引商品との互換性があります。 トレンドに沿った短期的なポジションオープンのシグナルを提供し、追加の価格変動サポートも提供します。 インジケーターの原理 大きな矢印はトレンドの方向を決定します。 トレンド波の中では、小さな矢印の形でスキャルピングシグナルを生成するアルゴリズムが機能します。 赤い矢印は強気方向、青い矢印は弱気方向です。 トレンドの方向には敏感な価格変動ラインが描かれ、小さな矢印のシグナルと連動します。 シグナルは次のように機能します。適切なタイミングでラインが現れるとエントリーシグナルが形成され、ラインが開いている間はポジションが保持され、完了すると取引が終了します。 推奨される動作時間枠はM1~H4です。 矢印は現在のローソク足に形成され、次のローソク足が開いている場合は、前のローソク足の矢印は再描画されません。 入力パラメータ Trend Wave Period - トレンド方向
Price & Time Market Structure Indicator A professional market structure tool that analyzes waves through both price and time — not price alone. Main Description NeoWave PRO is a professional market structure indicator for MetaTrader 4 designed for traders who want to move beyond traditional one-dimensional wave tools such as ZigZag, swing indicators, and basic high/low systems. Most wave indicators analyze only one thing: Price. But a real market wave is not only a price movement. A true wave de
MonsterDash Harmonic Indicator is a harmonic pattern dashboard. It recognizes all major patterns. MonsterDash is a dashboard that displays all detected patterns for all symbols and (almost) all timeframes in sortable and scrollable format. Users can add their own user defined patterns . MonsterDash can open and update charts with the pattern found. Settings MonsterDash's default settings are good enough most of the time. Feel free to fine tune them to your needs. The color settings are for thos
Apollo SR Master は、サポート/レジスタンスゾーンを利用した取引をより容易かつ確実にする特別な機能を備えたサポート/レジスタンスインジケーターです。このインジケーターは、ローカル価格の高値と安値を検出することで、タイムラグなしでリアルタイムにサポート/レジスタンスゾーンを計算します。そして、新たに形成されたSRゾーンを確認するために、インジケーターは特別なシグナルを表示します。このシグナルは、SRゾーンを実際の売りまたは買いシグナルとして考慮して使用できることを示します。この場合、SRゾーンの強度が高まり、SRエリアからの取引が成功する確率も高まります。これがこのインジケーターの基本的な考え方です。 SRゾーンは、ストップロスとテイクプロフィットの設定を容易にします。シグナルの方向に応じて、SRゾーンの上または下のスペースをストップロスとして設定できます。さらに、反対側のSRゾーンは、潜在的なテイクプロフィットエリアとして設定できます。 また、Apollo SRマスターインジケーターをご利用のすべてのユーザーには、「Apollo Price Action System」
現在40%オフ 初心者やエキスパートトレーダーに最適なソリューション! このインジケーターは、独自の機能と新しい計算式を取り入れた、ユニークで高品質、かつ手頃な価格のトレーディングツールです。たった1枚のチャートで28の為替ペアの通貨強度を読み取ることができます。新しいトレンドやスキャルピングチャンスの引き金となるポイントを正確に特定することができるので、あなたのトレードがどのように改善されるか想像してみてください。 ユーザーマニュアルはこちら  https://www.mql5.com/en/blogs/post/697384 これが最初の1本、オリジナルだ! 価値のないクローンを買わないでください。 特別な サブウィンドウの矢印で強い通貨の勢いを表示 GAPがあなたのトレードを導く! 基準通貨や気配値が売られすぎ・買われすぎのゾーン(外相フィボナッチレベル)にあるとき、個別チャートのメインウィンドウに警告表示。 通貨がレンジの外側から反落した場合、プルバック/リバーサルのアラート。 クロスパターンの特別なアラート 複数の時間枠を選択可能で、トレンドを素早く確認できます
Auto Optimized Parabolic RSI: 高度な3Dモメンタムエンジン ほとんどのリテール向けインジケーターは、市場のボラティリティが変化した瞬間に破綻する静的な入力値に依存しているため、失敗に終わります。Auto Optimized Parabolic RSIは、自らの数学的優位性を継続的に再計算することで「インジケーターの陳腐化」問題を解決し、機関投資家レベルの定量的適応力をMT5ターミナルに直接もたらします。 最大の強み: カスタムインメモリ3D最適化   標準的な自動最適化ツールは、インジケーターの呼び出しで端末に過負荷をかけるため、頻繁にMT5プラットフォームをフリーズさせます。本ツールは、このボトルネックを完全に回避しています。RAMベースのカスタムネイティブ計算機を内蔵した内部エンジンは、チャートを読み込んだりタイムフレームを変更したりするたびに、超高速の3Dグリッド探索を実行します。RSI期間(頻度)、SARステップ(加速度)、SAR最大値(制限速度)を同時にスイープし、プラットフォームを遅延させることなく、数万通りものパラメーターの組み合わせを絶対的
Advanced Supply Demand
Bernhard Schweigert
4.91 (300)
現在40%オフ 初心者にもエキスパートトレーダーにも最適なソリューション このインジケーターは独自の機能と新しい公式を多数内蔵しており、ユニークで高品質かつ手頃な取引ツールです。このアップデートでは、2つの時間枠ゾーンを表示できるようになります。より長いTFだけでなく、チャートTFとより長いTF(ネストゾーンを表示)の両方を表示できます。すべてのSupply Demandトレーダーの皆さんのお気に召すはずです。:) 重要情報の公開 Advanced Supply Demandの可能性を最大化するには、 https://www.mql5.com/ja/blogs/post/720245 にアクセスしてください。   エントリーまたはターゲットの正確なトリガーポイントを正確に特定できれば取引がどのように改善されるか想像してみてください。新しい基盤となるアルゴリズムに基づいて構築されているため、買い手と売り手の間の潜在的な不均衡をさらに簡単に特定できます。これは、最も強い需要と供給のゾーンと、過去のパフォーマンス(古いゾーンを表示)がグラフィカルに表現されるためです。これらの機能は、最適な
このインジケーターは、エリオット波動理論と組み合わせて作動し、2つの方法で使用されます: 自動モード: このモードでは、インジケーターがチャート上の全ての5つのモーティブ波を自動的に検出し、予測とポテンシャルな逆転ゾーンを提供します。また、アラートやプッシュメッセージを生成する能力も備えています。この自動機能により、エリオット波動パターンの識別と分析のプロセスが効率化されます。 手動モード: このオプションは、エリオット波動理論を手動で扱いたいトレーダー向けです。9つの段階を使用して波を描画することができます。各段階は、表示された後に描画されたラインを調整して個別に定義できます。この機能により、手動で波を描画するプロセスがより効率的になります。重要な点として、すべての描画データが将来の参照のためにプラットフォームのデータフォルダに保存されることに注意してください。 パラメータ: Name: インジケーターの名前。 Use_System_Visuals: インジケーターのテーマを有効または無効にして、取引プラットフォーム全体の外観に合わせます。 Explain_Comment: 波の番号
Introduction to Fractal Pattern Scanner Fractal Indicator refers to the technical indicator that makes use of the fractal geometry found in the financial market. Fractal Pattern Scanner is the advanced Fractal Indicator that brings the latest trading technology after the extensive research and development work in the fractal geometry in the financial market. The most important feature in Fractal Pattern Scanner is the ability to measure the turning point probability as well as the trend probabi
Send us a message after your purchase to receive more information on how to get your  BONUS  for FREE  that works in great combination with Bull vs Bear ! Bull versus Bear is an easy-to-use Forex indicator that gives traders clear and accurate signals based on clear trend retests . Forget about lagging indicators or staring at charts for hours because  Bull vs Bear provides real-time entries with no lag and no repaint, so you can trade with confidence. Bull vs Bear  helps you enter trades during
Scalper Vault は、スキャルピングを成功させるために必要なすべてを提供するプロフェッショナルなスキャルピング システムです。このインジケーターは、外国為替およびバイナリー オプションのトレーダーが使用できる完全な取引システムです。推奨される時間枠は M5 です。 システムは、トレンドの方向に正確な矢印シグナルを提供します。また、トップとボトムのシグナルとギャン マーケット レベルも提供します。 インジケーターは、プッシュ通知を含むすべてのタイプのアラートを提供します。 インジケータの購入後にご連絡ください。私の個人的な取引の推奨事項と素晴らしいボーナス指標を無料で共有します! 幸せで有益な取引をお祈りします!
The Propfolio Master Suite is the ultimate all-in-one analytical workstation for professional traders. Combining the power of the Beat The Market Maker (BTMM) methodology, Smart Money Concepts (SND/Liquidity), and Advanced Volume Profile, this suite replaces multiple different indicators with one optimized engine. Monitor up to 14 pairs simultaneously from a single chart, instantly identify market cycles, and seamlessly map institutional footprints with the click of a button. The Command Center
Introduction Harmonic Patterns are best used to predict potential turning point. Traditionally, Harmonic Pattern was identified manually connecting peaks and troughs points in the chart. Manual harmonic pattern detection is painfully tedious and not suitable for everyone. You are often exposed under subjective pattern identification with manual pattern detection. To avoid these limitations, Harmonic Pattern Plus was designed to automate your harmonic pattern detection process. The functionality
作者のその他のプロダクト
OrderFlow Absorption – MT5用プロフェッショナル・デルタ&アブソープションシグナルインジケーター OrderFlow Absorptionで本物のオーダーフロー分析の力を解き放ちましょう。MetaTrader 5向けの究極のデルタヒストグラム&アブソープションシグナルインジケーターです。あらゆる価格変動の裏側で何が起きているのかを知りたいトレーダーのために設計されており、市場を動かす隠れた買い/売り圧力や吸収イベントを明らかにします。 特徴 デルタヒストグラムの可視化:   買い圧力・売り圧力を色分けされたヒストグラムで即座に表示。 アブソープションシグナル検出:   高度なロジックで強気・弱気の吸収イベントを特定し、反転の兆しを早期に通知。 チャートマーカー:   吸収シグナルをチャート上に直接マークし、視覚的に分かりやすく表示。 ポップアップアラート:   新しい吸収シグナルが出現した際にリアルタイムで通知。 カスタマイズ可能な閾値:   弱いシグナルを除外し、高確率のセットアップに集中。 リソース管理:   大きなチャートでも高速に動作する効率的な計算。
OrderFlow Absorption – MT4用プロフェッショナル・デルタ&アブソープションシグナルインジケーター OrderFlow Absorptionで本物のオーダーフロー分析の力を解き放ちましょう。MetaTrader 4向けの究極のデルタヒストグラム&アブソープションシグナルインジケーターです。あらゆる価格変動の裏側で何が起きているのかを知りたいトレーダーのために設計されており、市場を動かす隠れた買い/売り圧力や吸収イベントを明らかにします。 特徴 デルタヒストグラムの可視化:   買い圧力・売り圧力を色分けされたヒストグラムで即座に表示。 アブソープションシグナル検出:   高度なロジックで強気・弱気の吸収イベントを特定し、反転の兆しを早期に通知。 チャートマーカー:   吸収シグナルをチャート上に直接マークし、視覚的に分かりやすく表示。 ポップアップアラート:   新しい吸収シグナルが出現した際にリアルタイムで通知。 カスタマイズ可能な閾値:   弱いシグナルを除外し、高確率のセットアップに集中。 リソース管理:   大きなチャートでも高速に動作する効率的な計算。
Flat Reminder Overview Flat Reminder is a powerful technical analysis tool that identifies and highlights price consolidation zones on your chart. It detects when price action slows down and moves sideways, indicating potential reversal points, continuation setups, or key decision zones in the market. Key Features Consolidation Detection : Automatically identifies flat price zones where market momentum decreases Range Measurement : Calculates and displays the exact range of each consolidation in
FREE
MA Reminder Overview MA Reminder is a versatile moving average indicator that provides visual cues and background coloring to help traders identify trend direction and potential trading opportunities based on MA crossovers. Key Features Multiple Moving Averages : Displays up to 4 configurable moving averages on the chart Background Coloring : Highlights chart background based on MA1 and MA2 crossovers Timeframe Flexibility : Choose between dynamic (follows chart timeframe) or fixed timeframe mod
FREE
大家睇住冬令夏令時間呀~ MEDIAN = (High + Low)/2 TYPICAL = (High + Low + Close)/3 WEIGHTED =   (High + Low + Close + Open)/4 --------------------- 附上自己用緊的 Setting, 不代表是最好的, 還需大家反饋 附上真倉紀錄, 全部EA入市, 但出市我成日手動, 但手動的效果欠佳, 應該信EA的... 附上今日2024/2/23的Cap圖, 16727.44追升, 16819.28手動平左, 高位~16895,  有進步空間的 --------------------- Min distance 係咩 ? Check time同Ordertime相距的距離 原意係, 兩個價差唔多即係冇方向, 就唔開單 用呢個最少距離可以只做大單邊 Checktime恆指16000 最少距離10000 <- 100點 Ordertime 16100以上/15900以下先會開 其他都當佢橫行唔玩 --------------------- -Check time means r
附上20240307市況, 順勢加單真開心 附上20240306市況, 順勢加單真開心 ※ ※ ※ This configuration is extremely aggressive and extremely risky. Please conduct your own backtesting and adjust it to a suitable risk level. ※ ※ ※ Additionally, please share the configuration and EA modification requirements with me. ※ ※ ※ ※ This EA trades based on the multi-time frame Parabolic SAR indicator. E.G. if there still a buy signal on the M15 timeframe SAR, In the M1 timeframe, the EA will execute a buy trade when M1 SAR buy signal.
---Bar Open Time Trading--- Most of the EA in the market, it is often the case that trades are executed at the beginning of each bar, known as "Per Bar." We can infer the future trend in the first few seconds of each bar. Let the bullets fly! This EA compares the opening price of each bar with the price "after a few seconds" to make trades. This EA is suitable for all markets, including gold, indices, forex, and more. Let's explore different strategies for various markets and time periods. Have
What goes to the extreme must reverse; what goes to the negative will bring prosperity. This EA captures technical rallies when there are consecutive bearish (bullish) candles making new lows (highs). It buys on the upward reversal when a consecutive bearish candle starts to retrace from a low position. It sells on the downward reversal when a consecutive bullish candle starts to retrace from a high position. === 物極必反、否極泰來 此 EA 捕捉連續陰(陽)燭創新低(高)時的技術性反彈(Technical Rally) 在 連續陰 燭 低位 回調開始時反手買升 在 連續
Raging Demon This EA can place stop orders on both sides up to 1 second before the news release. Please try the demo live version yourself to see what happens first. Use it at your own risk; I do not recommend gambling. The screenshots show actual results from the U.S. non-farm payroll data. It's all real. I tried it three times before daring to share it. It is possible to lose. But winning once can offset 4-5 losses. You can trade major news events on Friday at 8:30(HKT). I've traded CPI, I
BallBallG BallBallG エキスパートアドバイザー (EA) は、複数のテクニカル指標を組み合わせて取引判断を行います。主に ADX (平均方向性指数) とその上昇/下降傾向、DI+ と DI- の差、RSI (相対力指数)、およびパラボリック SAR 指標を利用します。この戦略は、6 つの異なる時間枠に適用され、堅牢性と精度を高めます。 主な特徴: 指標に基づく戦略 :取引は ADX、DI+ と DI- の差、RSI、およびパラボリック SAR 指標からのシグナルに基づいて実行されます。 マルチタイムフレーム分析 :エントリーポイントとエグジットポイントを最適化するために、6 つの異なる時間枠を使用します。 柔軟な取引スタイル :単一ベット取引とマーチンゲール戦略の両方をサポートします。 多市場適用性 :金、指数、外国為替など、さまざまな市場での取引に適しています。 BallBallG は、さまざまな市場条件で正確にナビゲートできる、洗練された適応性の高い取引ツールを求めるトレーダー向けに設計されています。
Mad Max This EA trades based on the ADX, ADX rising/falling, Di+ and Di- difference, RSI, 5-timeframe 6-MA, total 30 MAs indicators, and their difference. Can trade single bets, can trade Martingale. This EA is suitable for all markets, including gold, indices, forex, and more. ====== 瘋狂麥斯 此EA跟據 ADX, ADX 升緊/跌緊, Di+ 和 Di- Difference, RSI, 5 個 TimeFrame 6 條 MA 指標共30條MA, 和它們的相差 作出交易; 可玩單注, 可玩馬丁 此EA適用於所有市場, 黃金, 指數, 外匯......
Ichiichiichiku This EA trades based on the ADX, ADX rising/falling, Di+ and Di- difference, RSI, 5-timeframe 2-ichimoku conversion, base line, total 10 MAs indicators. Can trade single bets, can trade Martingale. This EA is suitable for all markets, including gold, indices, forex, and more. ====== 一齊一齊一齊沽 此EA跟據 ADX, ADX 升緊/跌緊, Di+ 和 Di- Difference, RSI, 5 個 TimeFrame 2 條 ichimoku conversion, base line 指標共10條MA, 作出交易; 可玩單注, 可玩馬丁 此EA適用於所有市場, 黃金, 指數, 外匯......
YinYang Marty This EA trades based on 2-timeframe ADX, ADX rising/falling, Di+ and Di- difference, RSI indicators. Martin Rule: Only open a Buy order when the previous candlestick is bullish; Only open a Sell order when the previous candlestick is bearish. Can trade single bets, can trade Martingale. This EA is suitable for all markets, including gold, indices, forex, and more. ====== 陰陽馬丁 此EA跟據 2 個 TimeFrame ADX, ADX 升緊/跌緊, Di+ 和 Di- Difference, RSI, 作出交易; 馬丁單限制: 上支陽燭才可開Buy單; 上支陰燭才可開Sell單 可玩單注,
DarkGhost DarkGhostは、複数のテクニカルインジケーターを使用して取引の決定を行うブレイクスルー型のEA(エキスパートアドバイザー)です。主に以下の指標を使用してモメンタムを判断します: 平均真の範囲指標(ATR)の値 平均方向指数(ADX)の値およびADXが上昇しているか下降しているかの判断 DI+ と DI- の間の差 この戦略は、ロバスト性と精度を高めるために6つの異なる時間枠で適用されています。 取引シグナル: DI+、DI-、RSI、パラボリックSAR指標のシグナルを利用します。 モメンタムインジケーター: ATRの値、ADXの値、ADXが上昇しているか下降しているか、DI+ と DI- の間の差を使用してモメンタムを決定します。 エントリーポイントおよび出口ポイント: エントリー: 十分なモメンタムがあるときにブレイクスルーします。 出口: 利益目標(TP)、ストップロス(SL)、トレーリングストップ(TR)を設定します。 複数の時間枠での分析: 6つの異なる時間枠を使用してエントリーポイントおよび出口ポイントを最適化します。 複数市場への適用性: 金、指数
キーゾーン検出器 (Key Zone Detector) 需給レベル検出器 (Key Level Supply & Demand Zone Detector) 概要 (Overview) 市場で重要な活動が行われる主要な価格レベルを識別し評価する、高度な需給ゾーン検出インジケーター。フラクタル分析と複数の検証方法を使用して取引ゾーンを検出・分類します。 主な特徴 (Key Features) ゾーン検出 (Zone Detection) サポートとレジスタンスゾーンを自動検出 高速/低速デュアルフラクタルシステムで確認 ATR(Average True Range)に基づく動的ゾーン厚 重複ゾーンを統合しクリーン表示 ゾーン分類 (Zone Classification) 実証済みゾーン (Proven Zones): 4回以上テスト済み、最高信頼性 検証済みゾーン (Verified Zones): 1-3回テスト済み、良好な信頼性 未検証ゾーン (Untested Zones): 初回テスト待ちの新規ゾーン 転向ゾーン (Turncoat Zones): サポート⇔レジスタンス
EnergyX Indicator EnergyX is a unique tool that visualizes the "energy" of the market in a separate window. It helps you quickly see when energy is rising or falling, making it easier to spot potential trading opportunities. Yellow bars  show when energy is increasing. Red bars  show when energy is decreasing. How to Use: When price is approaching a  resistance  level: If energy is high and increasing (yellow), there is a higher chance the price will break the resistance. You may consider a  buy
Breakout Detector — 高度なボラティリティ分析とブレイクアウト検出ツール 説明 Breakout Detectorは、価格の大きなブレイクアウトに先行することが多い低ボラティリティ期間を特定する高度なテクニカルインジケーターです。パーキンソン・ボラティリティ計算とRSI分析を組み合わせることで、トレーダーがブレイクアウトのチャンスを事前に捉えるのをサポートします。 このインジケーターが解決する課題 ブレイクアウトの見逃し :気付いた時にはすでに最適なエントリーポイントを逃している ダマシのブレイクアウト :高ボラティリティ時にエントリーし、すぐに価格が反転する タイミングの難しさ :市場が「エネルギーを溜めている」タイミングを見極めにくい ボラティリティの混乱 :通常の値動きと本当の圧縮ゾーンの区別が難しい 遅いエントリー :ブレイクアウトパターンに気付いた時にはすでに大きく動いている このインジケーターの解決方法 早期警告 :ブレイクアウト前の低ボラティリティ期間(値が30未満)を特定 視覚的な準備ゾーン :ゴールドの四角で圧縮エリアをハイライト スマートアラート
# TrendBoard - Painel Definitivo de Análise Técnica Multi-Timeframe **Transforme seu trading com a ferramenta de análise de tendências mais abrangente do mercado!** ## **VERSÃO GRATUITA DISPONÍVEL - Baixe e Teste Agora!** Experimente o poder da análise técnica de nível profissional na ponta dos seus dedos. Baixe a versão de teste e descubra por que os traders chamam isso de "mudança de jogo" para sua estratégia de trading. ## **Por Que o TrendBoard é Diferente** O TrendBoard combina
KmeanSuperTrend – AI搭載の高度なSuperTrend指標 KmeanSuperTrendでアダプティブトレーディングの力を解き放とう! AI K-meansクラスタリング技術を搭載した世界初のSuperTrend指標でトレーディングを変革しましょう。KmeanSuperTrendは、実証済みのSuperTrend方法論と最先端の機械学習を組み合わせ、トレンド検出と市場分析において前例のない精度を提供します。 革命的な機能   AI K-means ATRクラスタリング: 先進的な5クラスターアルゴリズムが100以上の過去足を分析し、現在の市場ボラティリティ条件にATR計算を知的に適応させます。   動的SuperTrend可視化: 市場条件に自動的に調整される適応的カラーコーディング(上昇トレンド、下降トレンド)による明瞭なトレンドシグナル。 ️   完全にカスタマイズ可能なパラメータ: ATR期間(デフォルト:10) ATR乗数(デフォルト:3.0) ルックバック期間(デフォルト:100) カスタムカラーとライン スタイル 高度
CVD ダイバージェンス検出 - 高度なボリュームデルタ分析   我々が解決する問題 ほとんどのトレーダーは価格アクションのみに依存し、真の市場センチメントを明らかにする重要なボリュームフロー情報を見逃しています。従来の指標は価格の動きに遅れをとり、エントリーが遅れ、リスク管理が不十分になります。CVD ダイバージェンス検出は、価格とボリュームデルタモメンタムの関係を分析することでこれを解決し、大きな市場の動きの前に早期警告信号を提供します。   CVD ダイバージェンス分析の利点   早期市場反転検出   - 価格チャートに現れる前にモメンタムシフトを発見   スマートマネー追跡   - 機関投資家がいつ蓄積または配布しているかを確認   偽シグナル削減   - ボリュームが価格の動きを確認し、より高い確率のセットアップを提供   マルチタイムフレームの優位性   - スキャルピングからスイングトレーディングまで全ての時間枠で機能   汎用的な応用   - FX、株式、商品、暗号通貨に対応   4つの市場フェーズ - 実際のトレーディングストーリ
フィルタ:
レビューなし
レビューに返信