Pivot Points MT4
- インディケータ
- バージョン: 1.5

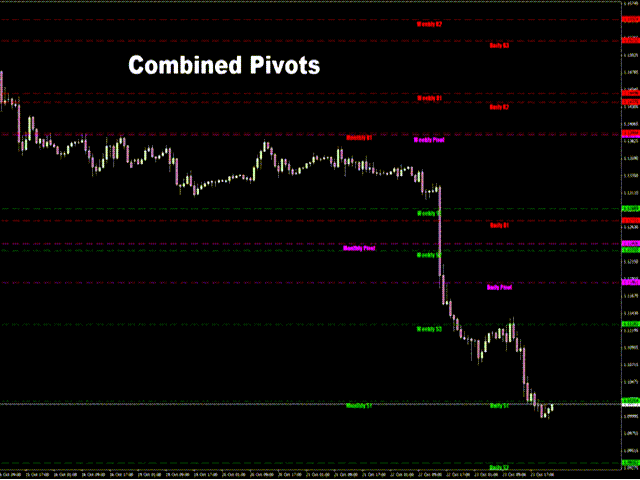
KT Pivot Points は、最新の市場データに基づいて、日足・週足・月足のピボットレベルをチャート上に自動で表示します。ピボットポイントは、特にFX市場において、テクニカル分析で広く利用されている指標の一つです。
特徴
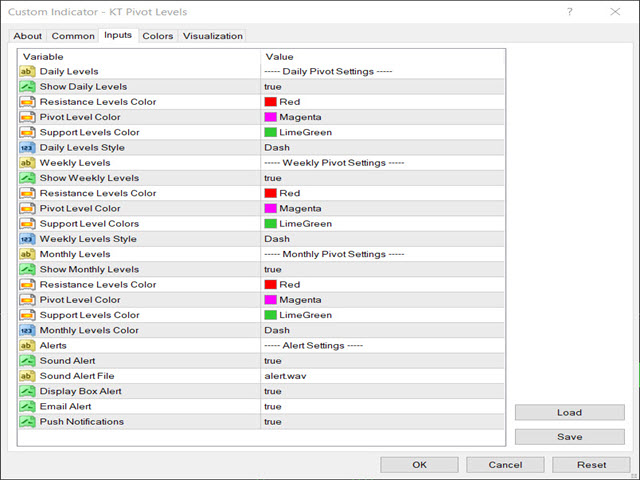
- 価格がピボットレベルに到達した際にアラートを送信します。
- 各種類のピボットレベルに対して完全なカスタマイズが可能です。
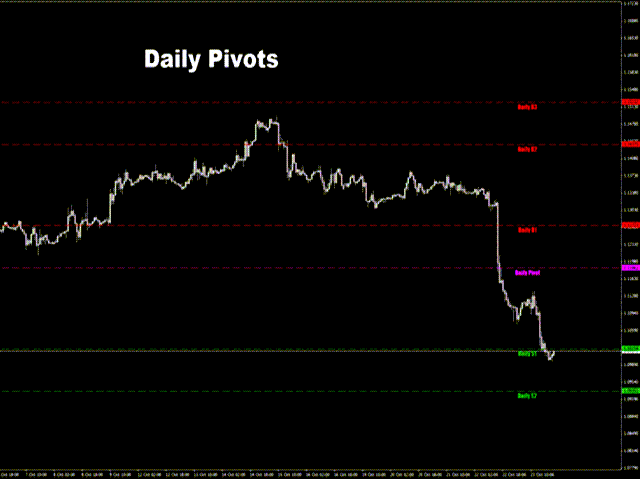
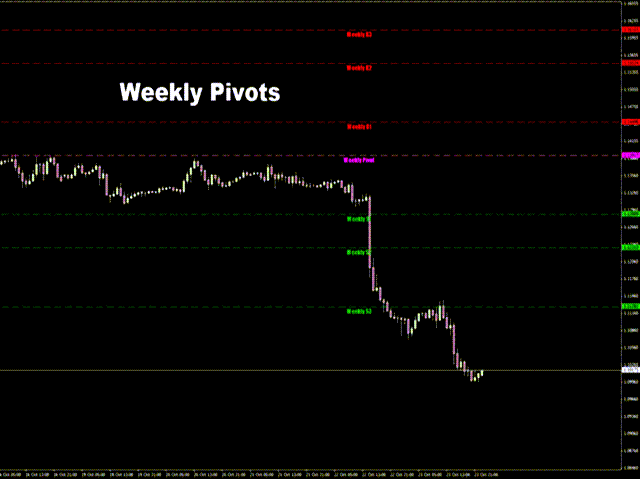
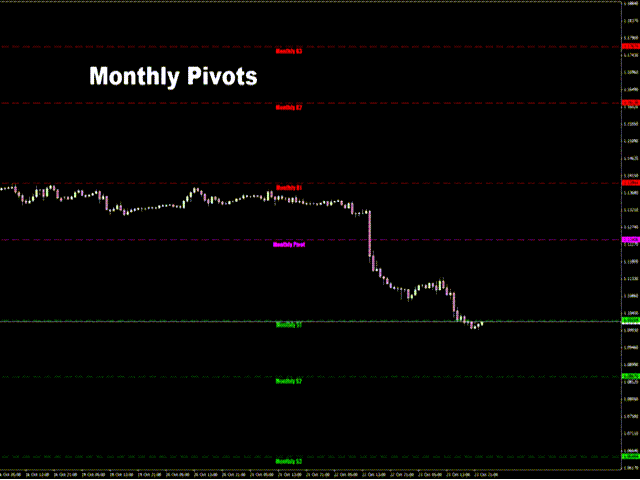
- シンプルな表示で、日足・週足・月足のピボットレベルを一目で確認できます。
- 最小限のCPUリソースを使用し、高速な計算を実現します。
- チャート上の他のインジケーターとも互換性があります。
ピボットポイントとは
ピボットポイントは、前の取引日の高値、安値、終値の平均から算出されます。
この計算により、将来のサポートおよびレジスタンスレベルを予測でき、価格がこれらのレベル付近でどのように動くかを判断する手助けとなります。
また、価格がピボットポイントの上にあるときは強気傾向、下にあるときは弱気傾向とされるのが一般的です。
ピボットの計算式
ピボットレベルの計算には、前日、週、または月の高値、安値、終値が使用されます。
- P = (H + L + C) / 3
- R1 = P + (P − L) = 2×P − L
- S1 = P − (H − P) = 2×P − H
- R2 = P + (H − L)
- S2 = P − (H − L)
- R3 = H + 2×(P − L) = R1 + (H − L)
- S3 = L − 2×(H − P) = S1 − (H − L)
ここで、
P = ピボット, H = 高値, L = 安値, C = 終値
R = レジスタンス(抵抗線)
S = サポート(支持線)
ピボットポイントの使い方
ピボットレベルは、反転・継続・ストップロス・利確ターゲットの判断材料として使用できます。デイトレーダーは日足のピボット、スイングトレーダーは週足、長期投資家は月足を参考にすることが多いです。
ポジショントレーダーや長期投資家は、年間データを使って今後の主要レベルを予測することも可能です。
ピボット戦略
一般的な戦略として、価格がサポートに触れたら買い、レジスタンスに触れたら売りというものがありますが、トレンドが強い場面では危険です。
ピボットレベルはより賢く使うことができます。中心ピボットより下なら相場は下降傾向、上なら上昇傾向と見ることができます。
どんなインジケーターや手法でも完全ではありません。ピボットが効かない場面もありますが、戦略の指針として非常に有効なツールです。