Trend Screener
- インディケータ
-
STE S.S.COMPANY
 Hello,
my name is Ashraf a fintech Software Engineer.
I create amazing forex indicators and expert advisors for Metatrader 4 and Metatrader 5, the best trading platforms.
Use my service and let me build your trading strategies ( Indicator coding or EA coding ) by click on bellow link - バージョン: 22.30
- アップデート済み: 31 1月 2025
- アクティベーション: 10
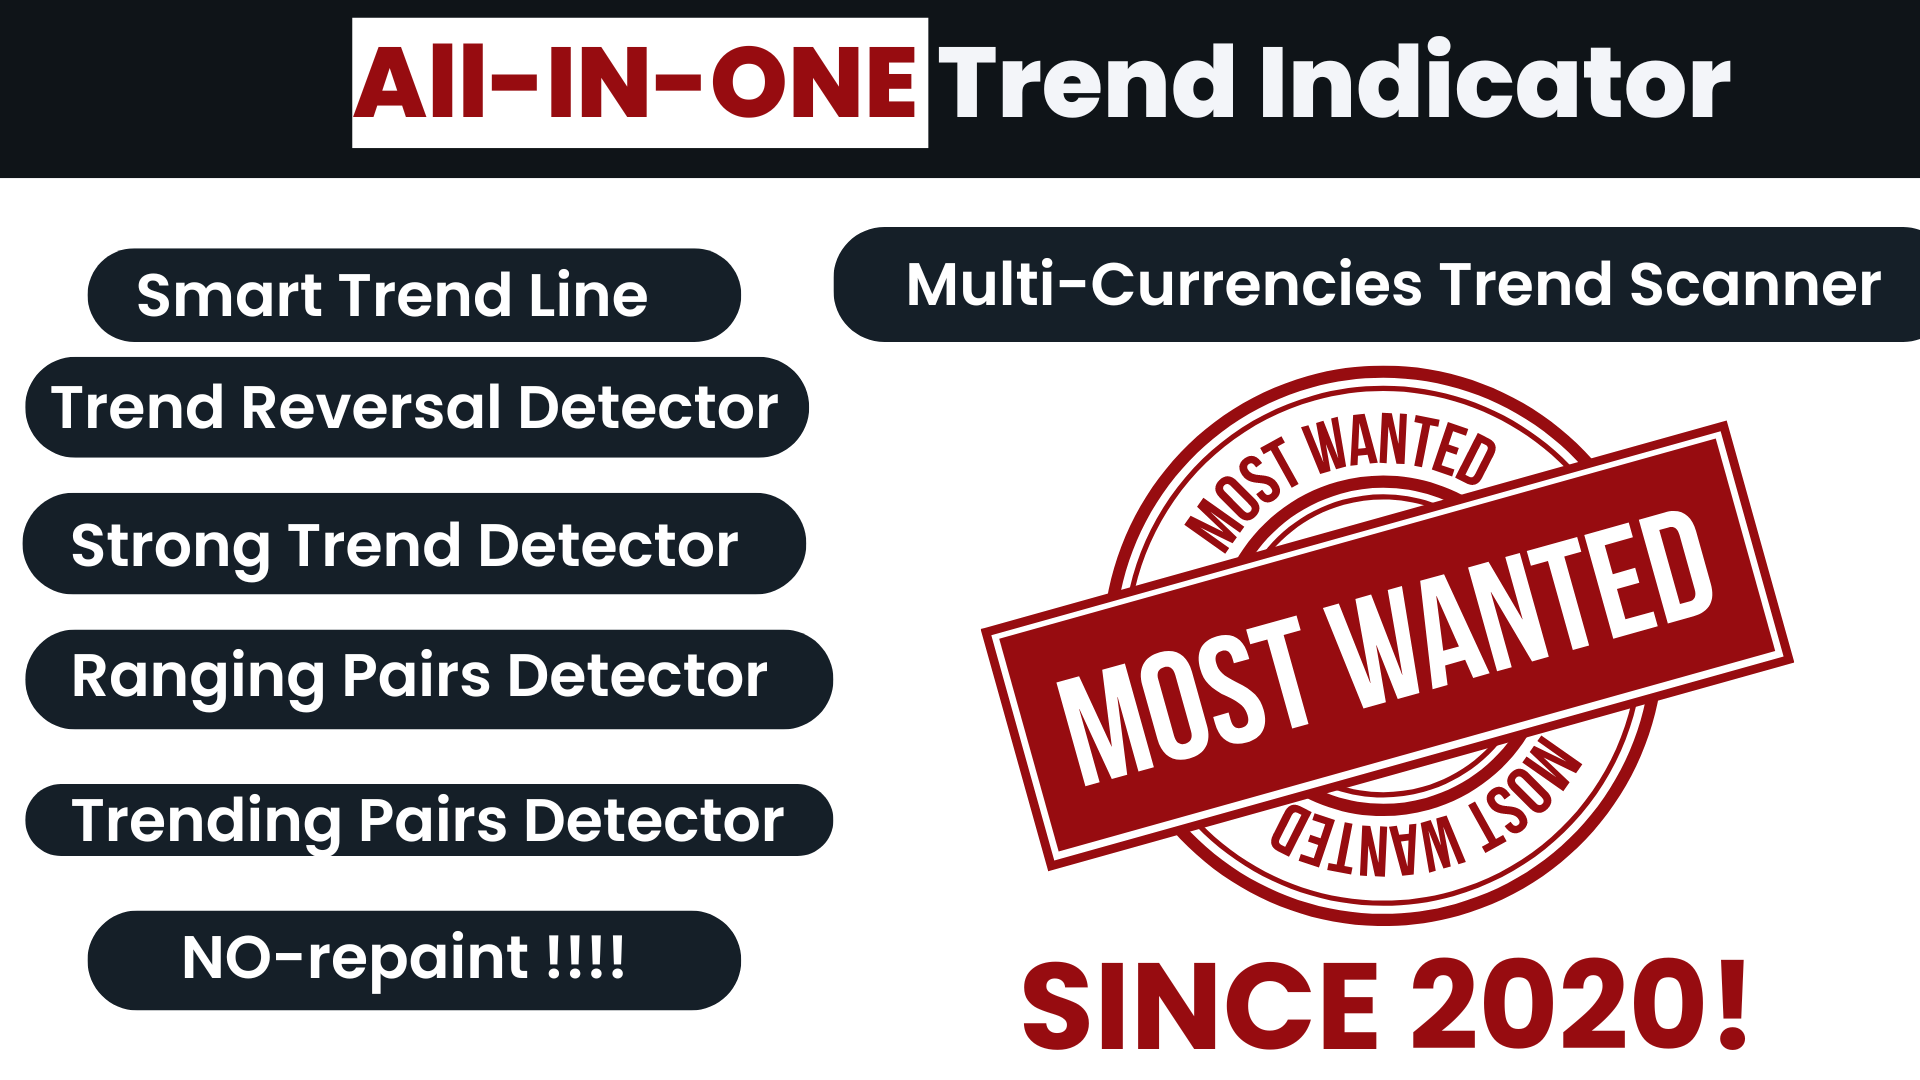
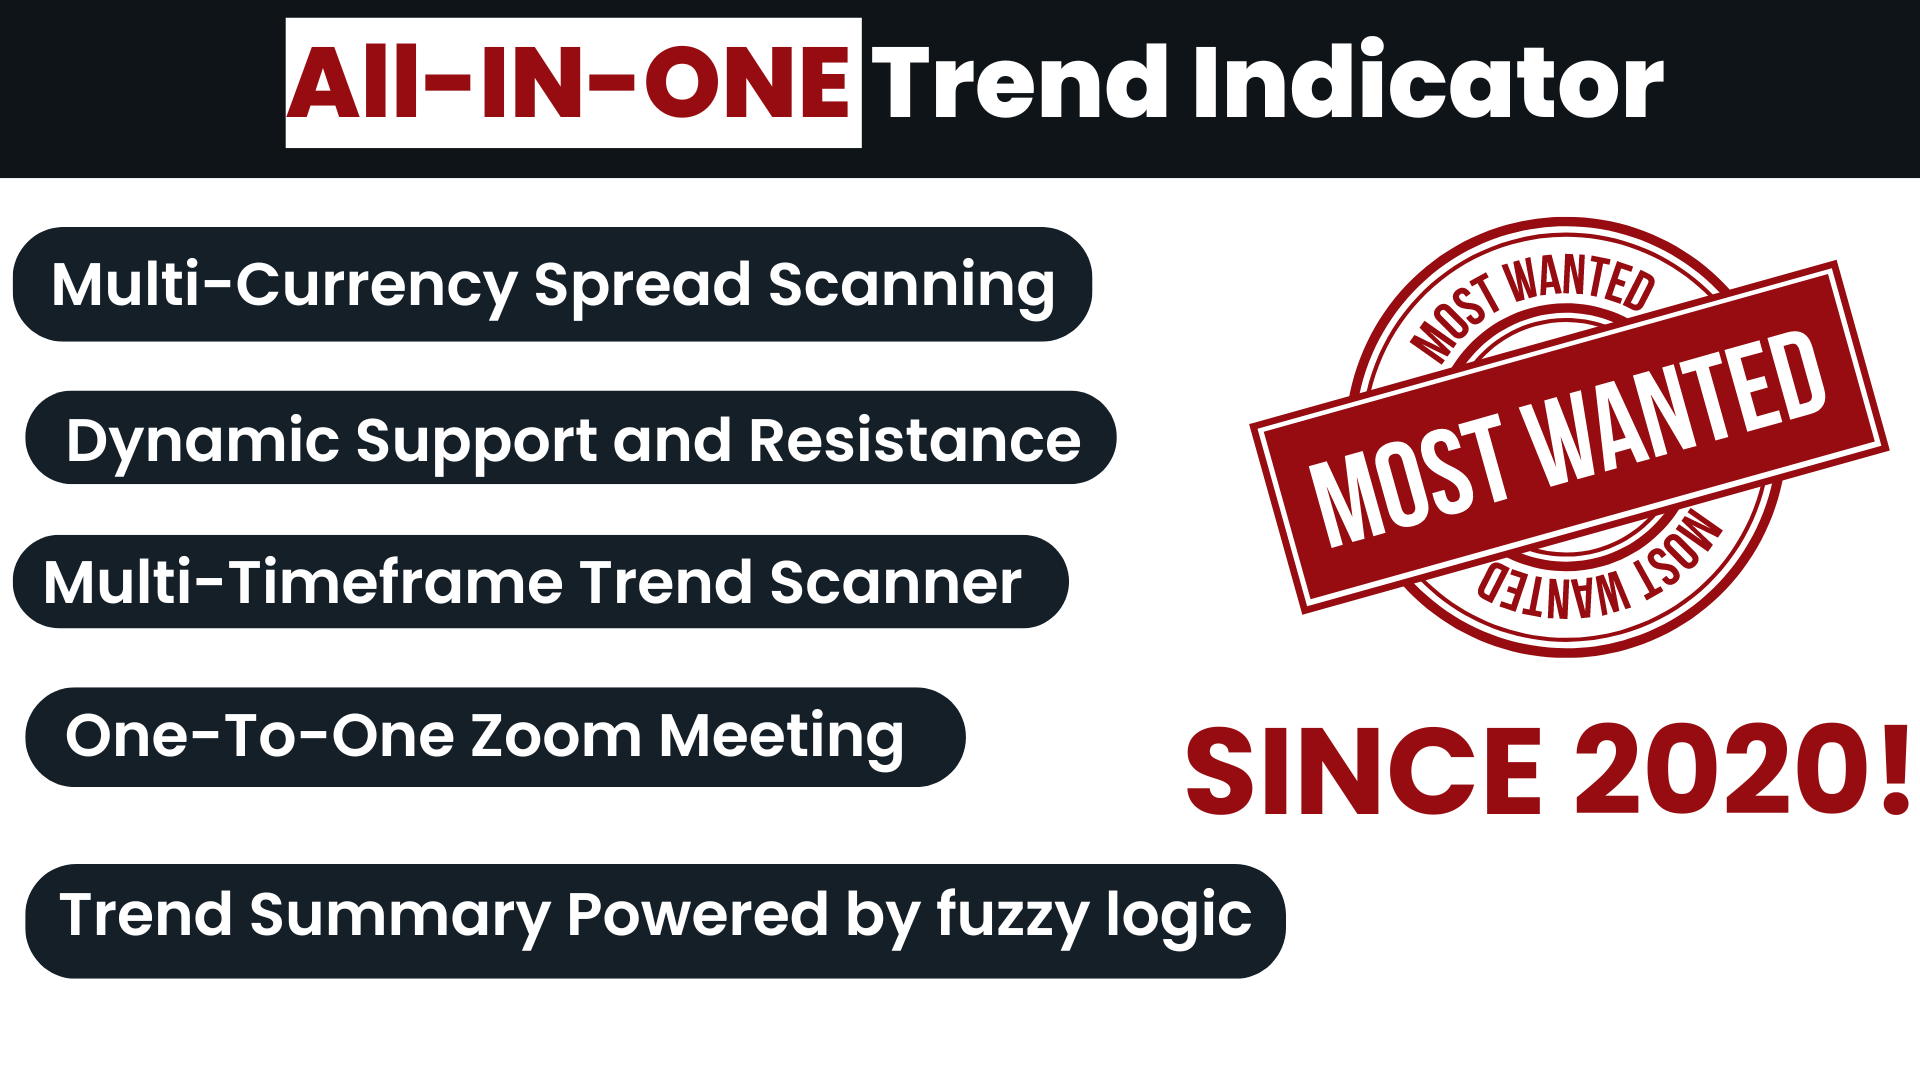
トレンドインジケーター、1つのツールに組み込まれたすべての重要なトレンド機能を備えたトレンドトレーディングとフィルタリングのための画期的なユニークなソリューション! これは、すべてのシンボル/商品(外国為替、商品、暗号通貨、インデックス、株式)で使用できる100%再描画されていないマルチタイムフレームおよびマルチ通貨インジケーターです。
期間限定オファー: サポートおよびレジスタンス スクリーナー インジケーターは、たった 65 ドルで永久的にご利用いただけます。(元の価格 250 ドル) (オファー延長)
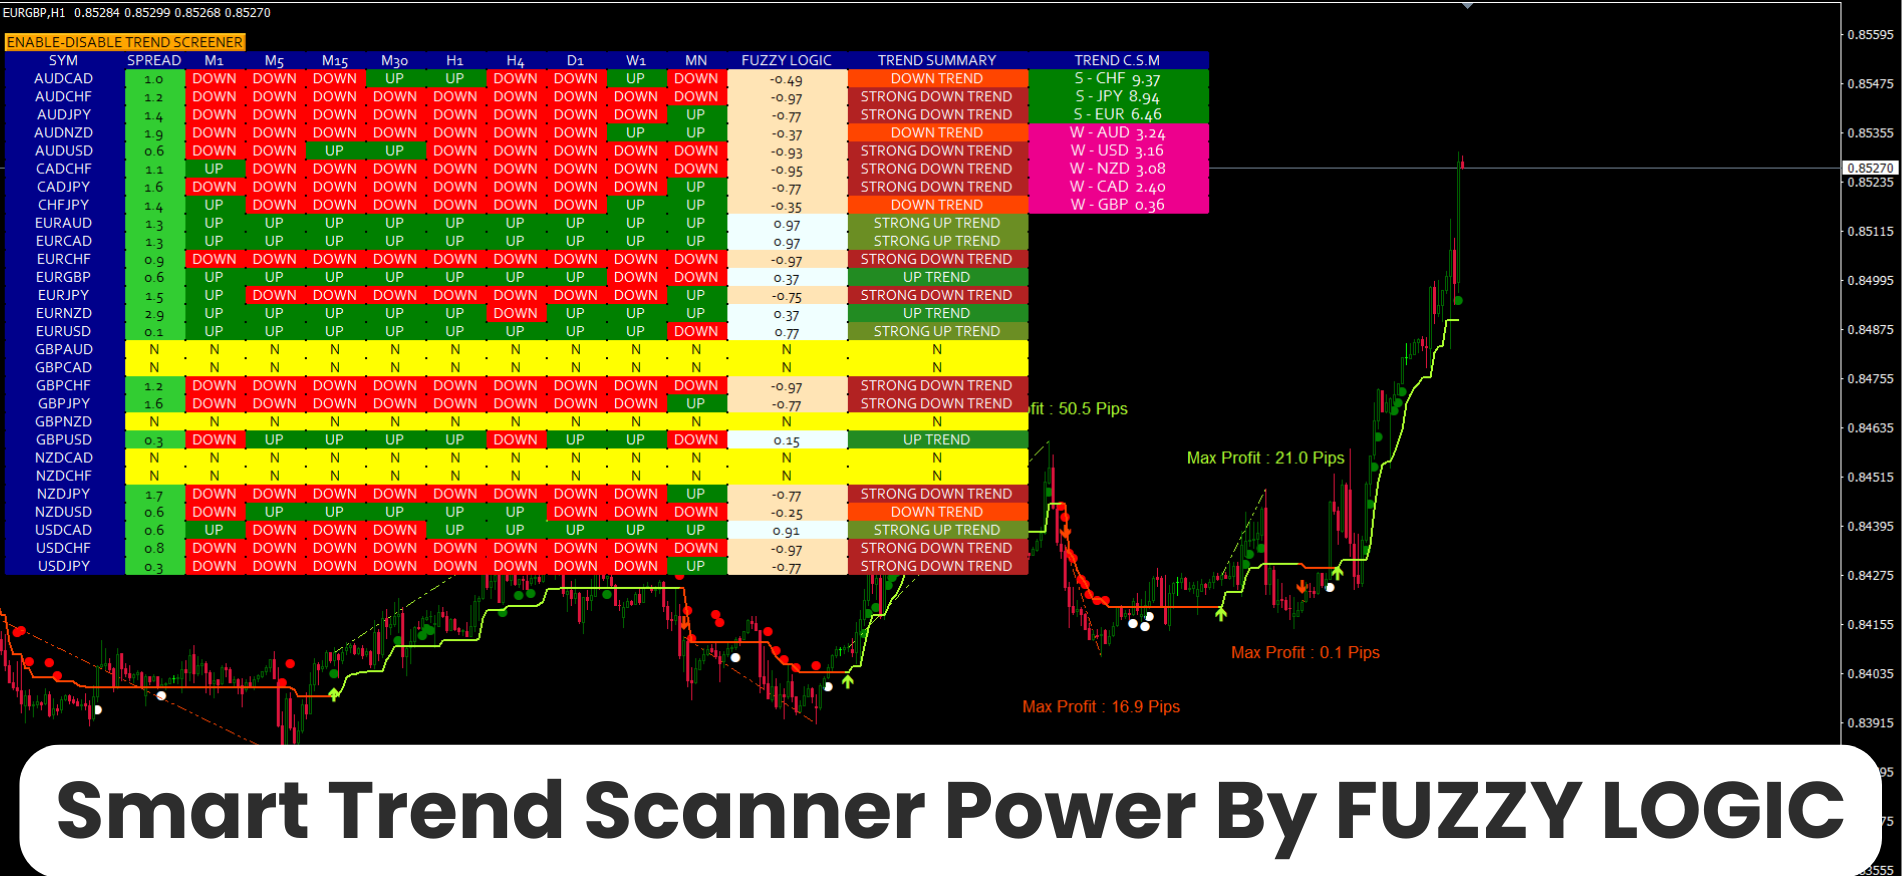
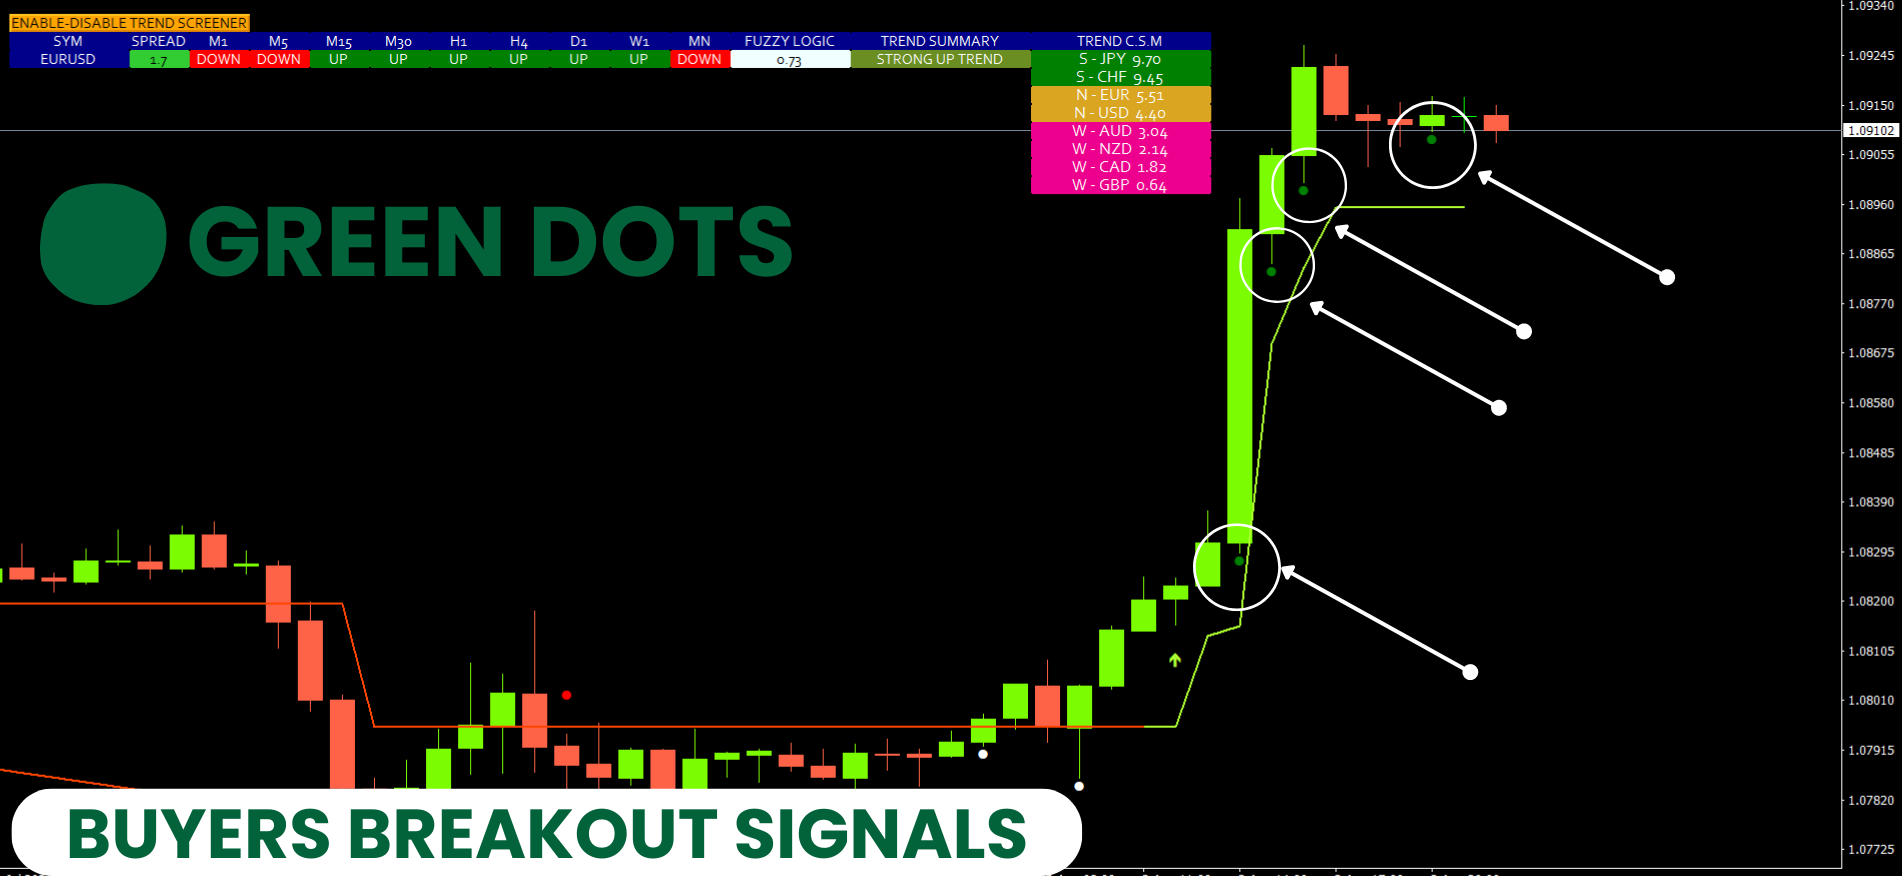
トレンドスクリーナーは、チャート内のドットで矢印トレンドシグナルを提供するインジケーターに続く効率的なインジケーターです。 トレンド分析インジケーターで使用できる機能:
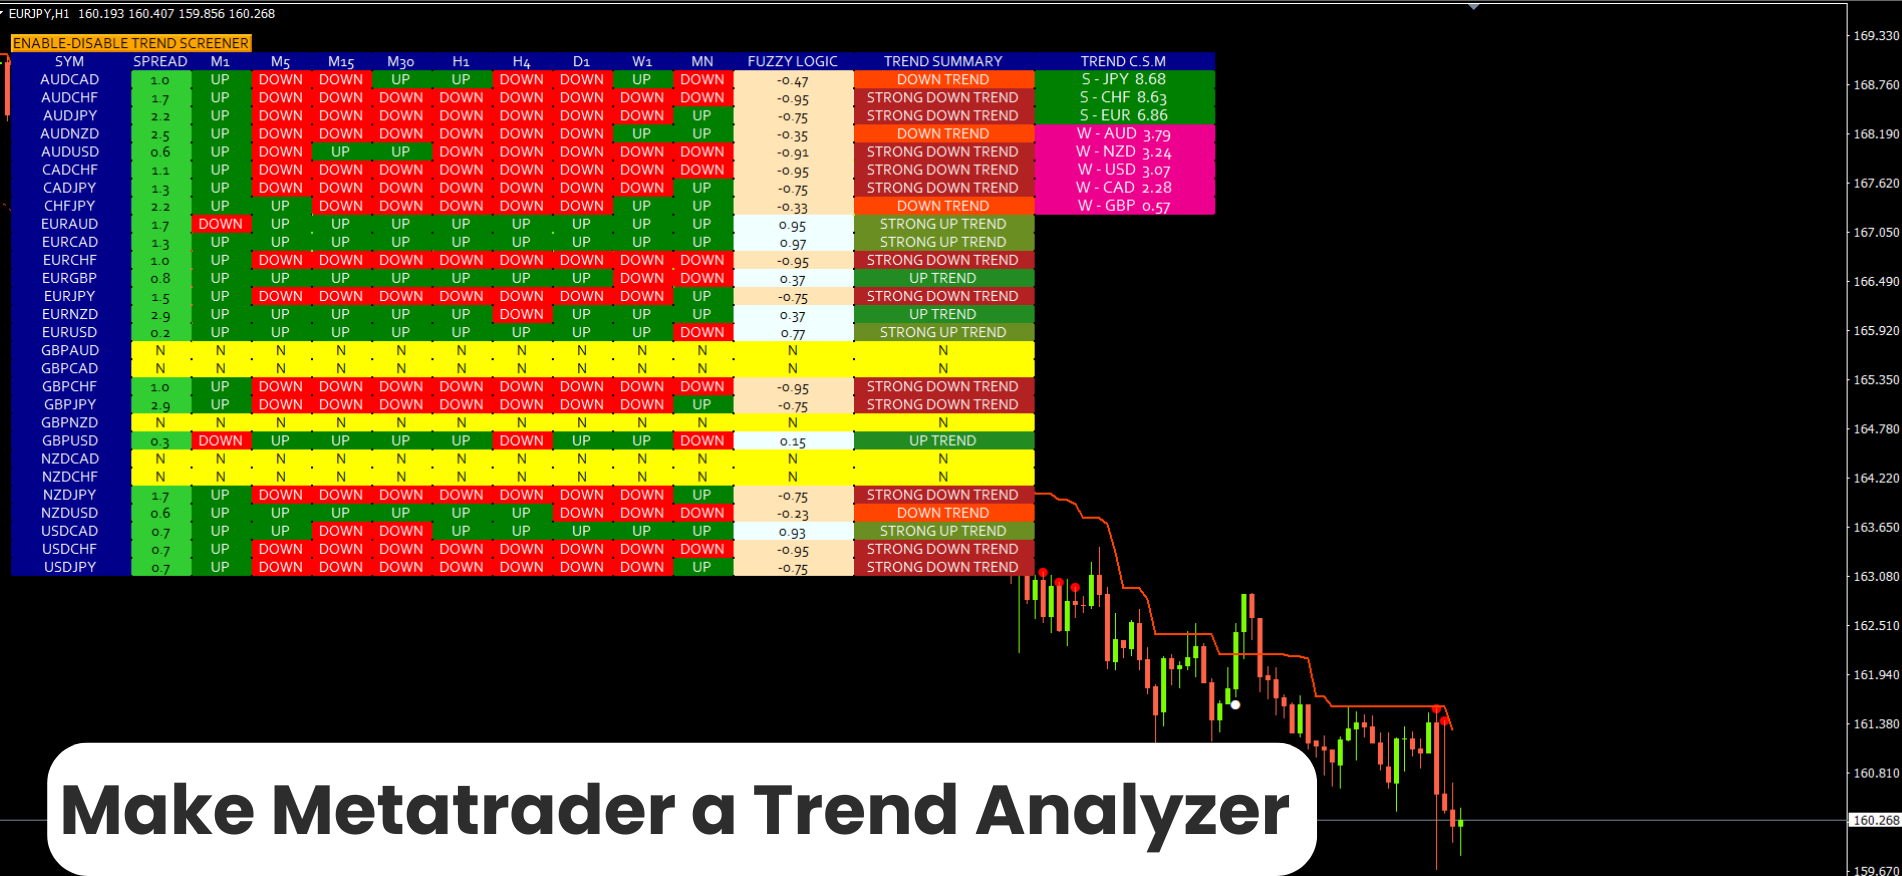
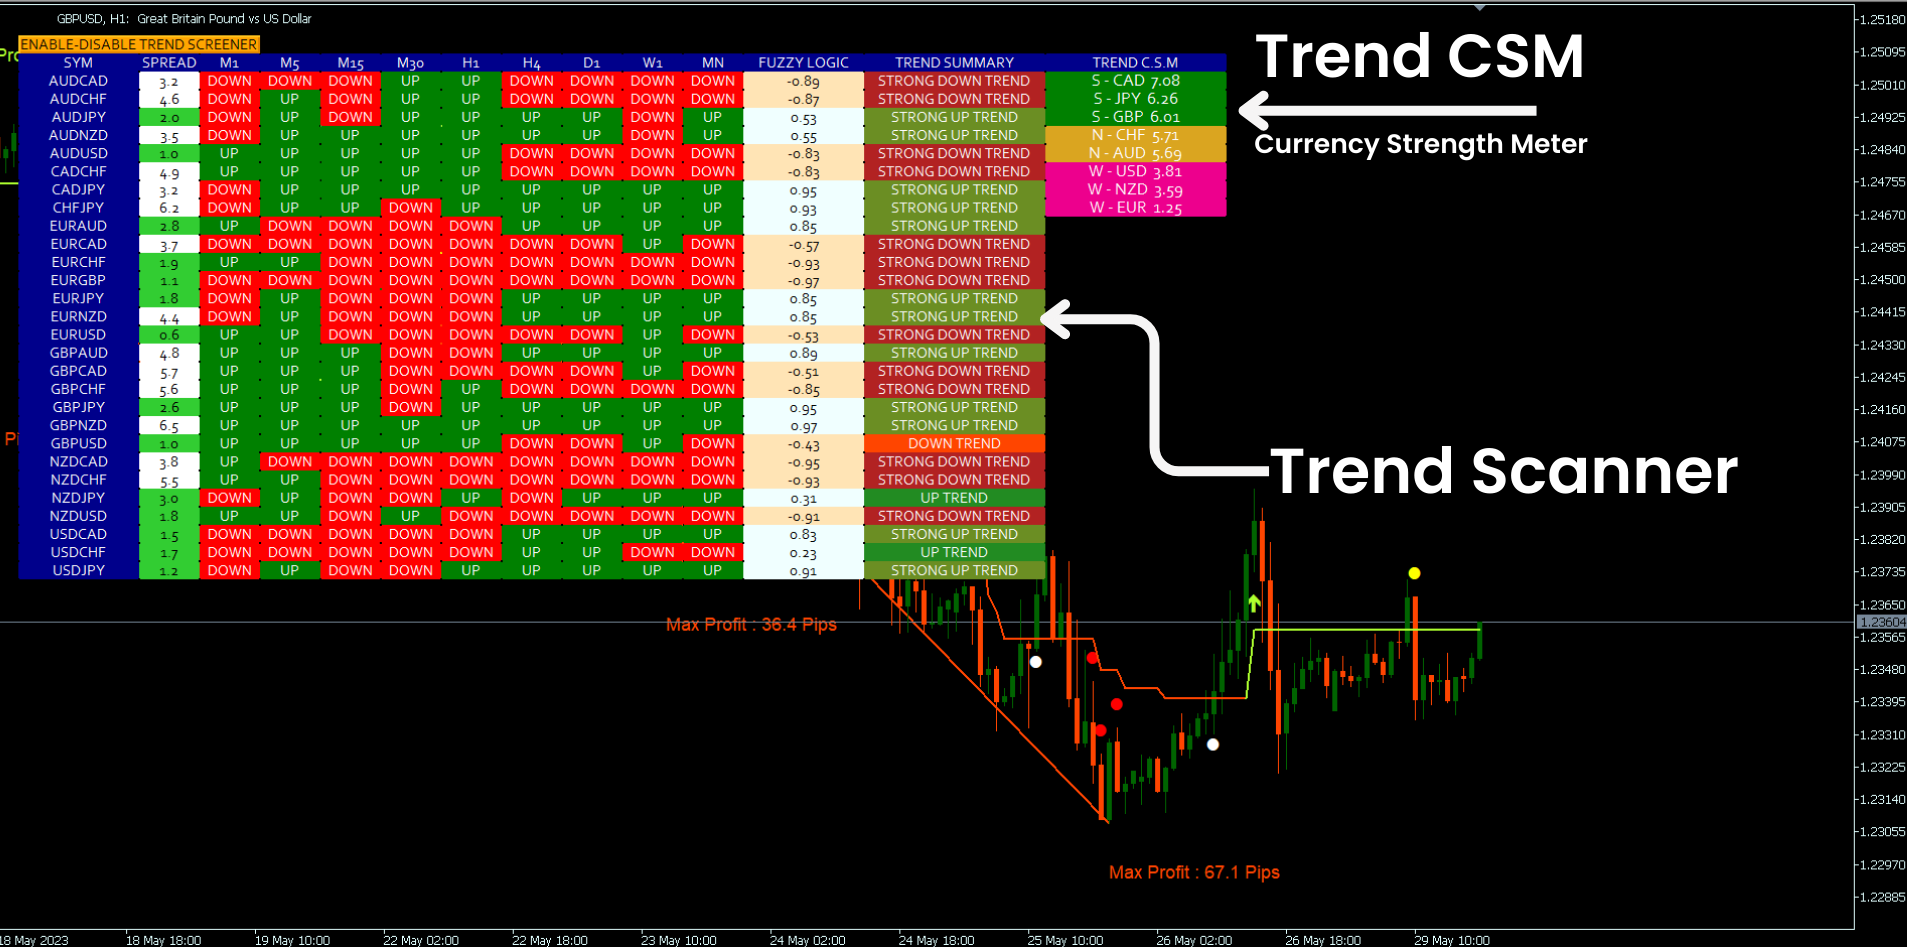
1.トレンドスキャナー。
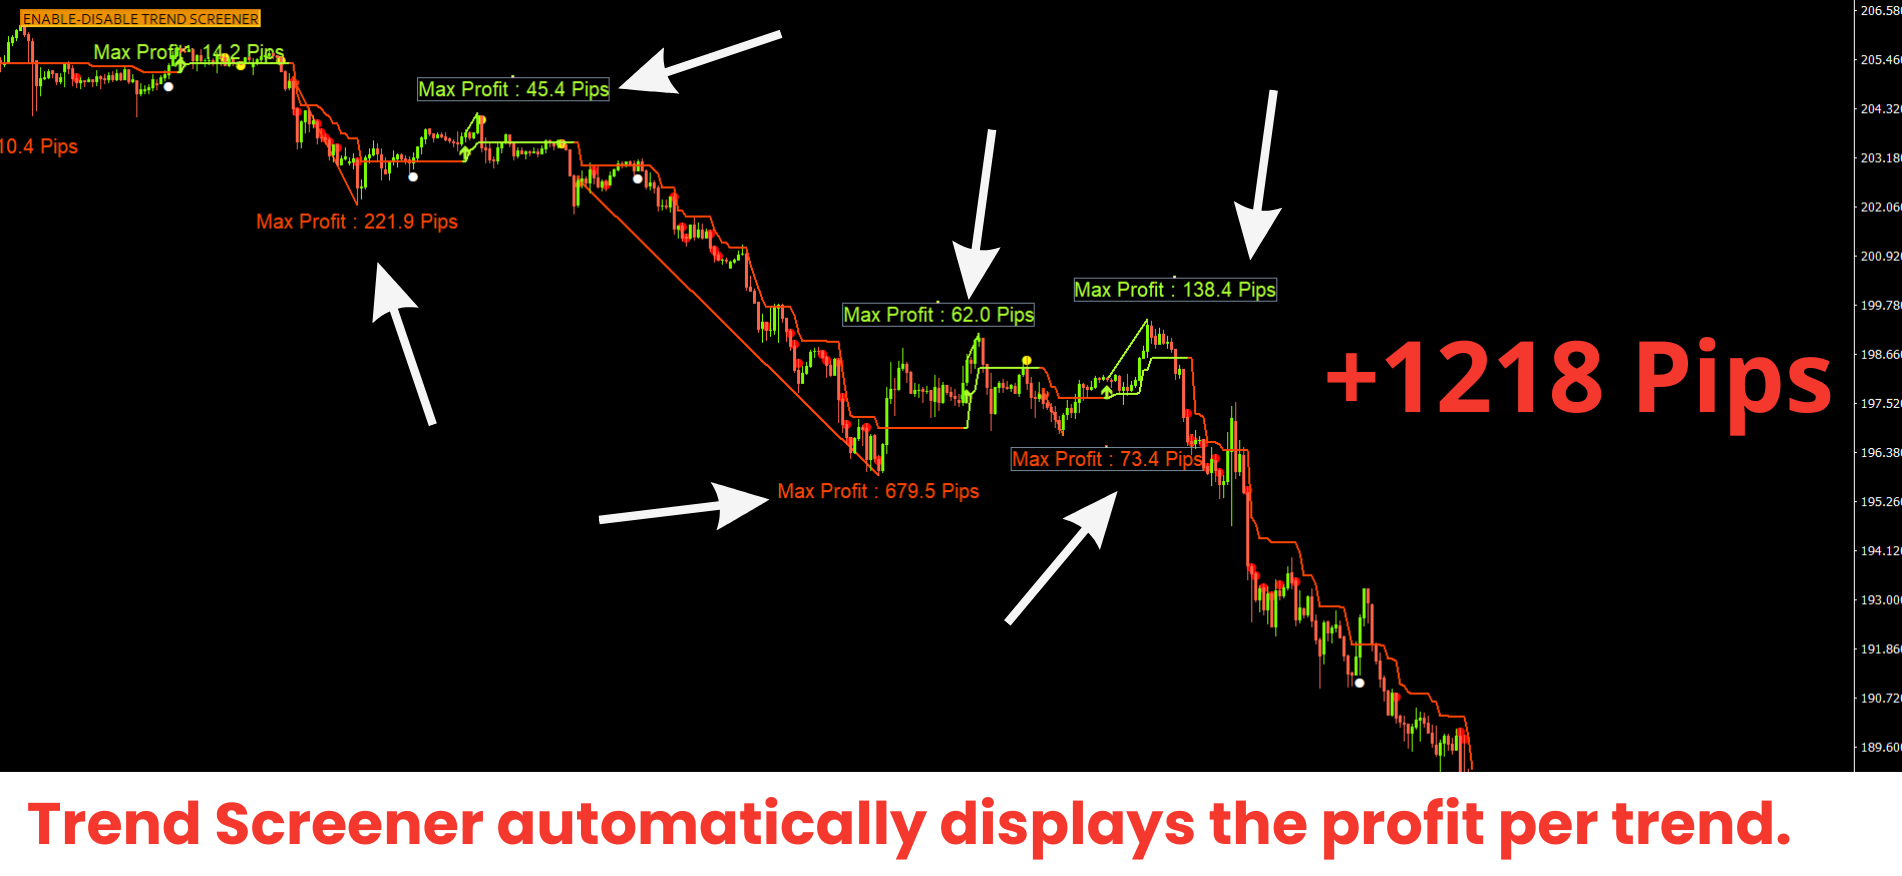
2.最大利益分析を備えたトレンドライン。
3.トレンド通貨強度メーター。
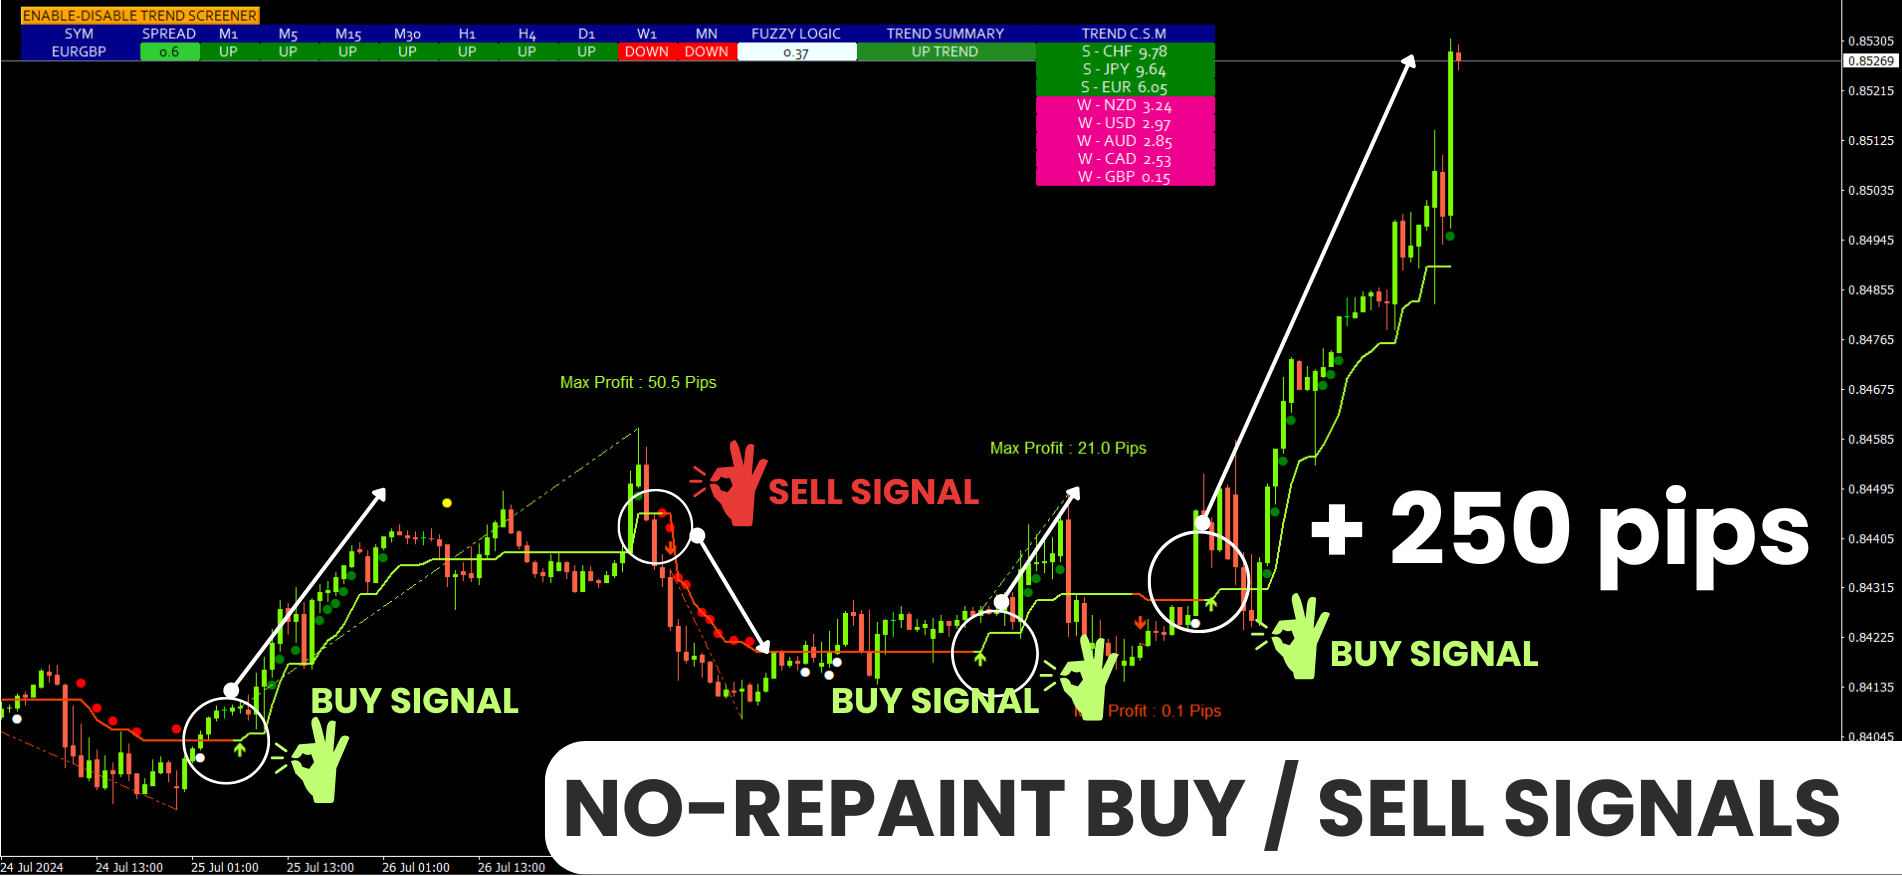
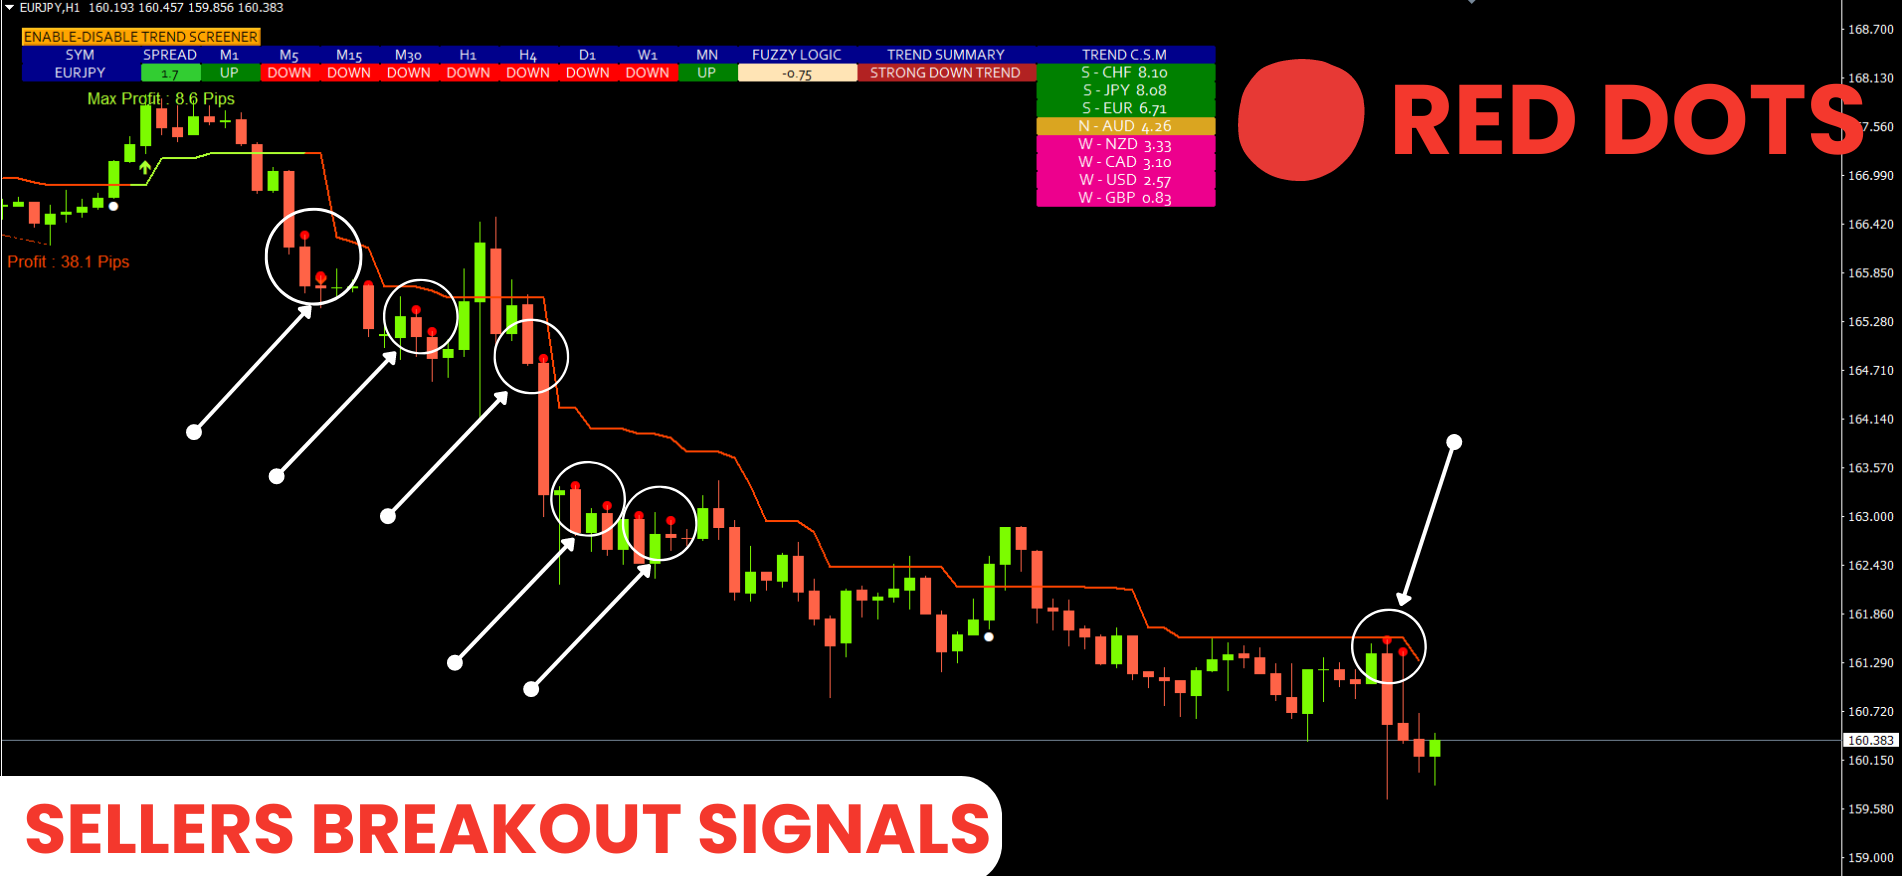
4.アラート付きのトレンド反転ドット。
5.アラート付きの強いトレンドドット。
6.トレンド矢印
毎日の分析例、毎日のシグナルパフォーマンス...など、トレンドスクリーナーインジケーターを使用して、ここで見つけることができます:ここをクリックしてください
期間限定オファー:トレンドスクリーナーインジケーターは、50ドルと生涯でのみご利用いただけます。 (元の価格125 $)
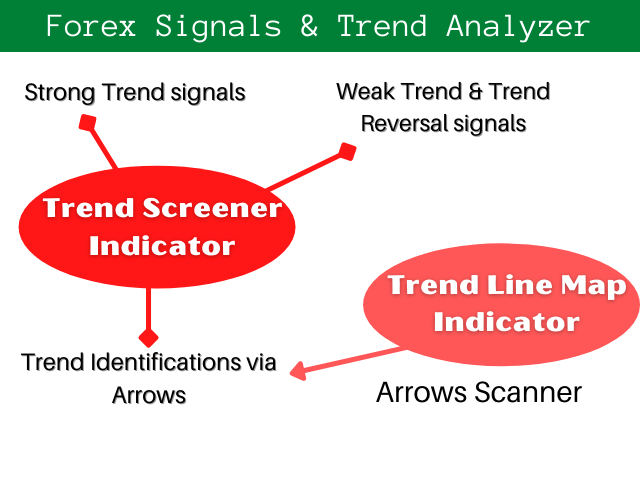
MQL5ブログにアクセスすると、分析例、毎日の信号パフォーマンスなどを含むすべてのプレミアム指標を見つけることができます。 : ここをクリック2つの指標で構成されるトレンドシステム:
1.Trend Screener Indicator :トレンドダッシュボード、チャートのトレンドライン、エントリーポイントなどを表示します。
2.Trend Line Map Indicator:ダッシュボードとして売買を表示し、アクティブなシグナルは利益/損失...などを表示します。
トレンドラインマップインジケーターをダウンロード
Youtube ビデオのチュートリアル :
MQL5 ブログをチェックすると、トレンド スクリーナー インジケーターの使用方法と取引方法を説明する多くの YouTube ビデオ チュートリアルを見つけることができます。 すべてのビデオを検索するには、ここをクリックしてください。
主な機能
- トレンド強度アナライザー。
- マルチタイムフレームおよびマルチ通貨トレンド分析。
- トレンドダッシュボード
- トレンド反転シグナル。 (ドット信号)
- 強いトレンドシグナル。 (ドット信号)
- トレンドライン
ドキュメント(手順)
すべてのトレンドスクリーナーのドキュメント(手順)と戦略の詳細は、MQL5ブログのこの投稿で入手できます:ここをクリックしてください。
コンタクト
ご不明な点がある場合やサポートが必要な場合は、プライベートメッセージでご連絡ください。
著者
SAYADI ACHREF、フィンテックソフトウェアエンジニアおよびFinansyaの創設者。 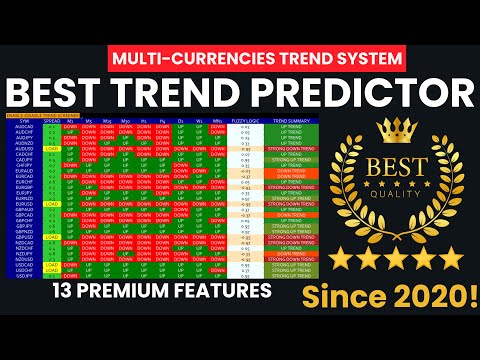


I have been using this trading system for three years. I've found that having all three indicators is significantly more effective, as they create a complete and comprehensive system.