Delta Fusion Pro
- 지표
- 버전: 8.0
- 업데이트됨: 6 12월 2025
- 활성화: 5

Delta Fusion Pro – 인트라데이 트레이딩을 위한 고급 주문 흐름 분석
Delta Fusion Pro는 MetaTrader 4용 전문 지표로, 공격적인 주문 흐름을 드러내고 기관 압력의 강도와 방향을 실시간으로 보여줍니다. 기존의 거래량 지표와 달리, Ask와 Bid 거래량 간의 델타를 분석하여 반전 예측, 추세 확인 및 전문 관심 영역을 식별합니다.
주요 특징
지능형 자동 조정 시스템
다음 조건에 따라 모든 매개변수를 자동으로 조정합니다:
- 상품 유형 (외환, 암호화폐, 지수, 원자재, 주식)
- 운영 타임프레임
- 시장 변동성 (ATR)
- 최근 평균 거래량
초보 트레이더를 위한 수동 설정 없음 – 지표가 자동으로 보정됩니다!
기능
- NetDelta 및 누적 델타
- Ask/Bid 공격적 거래량 차이 계산, 사용자 지정 EMA 스무딩
- 실시간 방향 압력 시각화
- 히스토그램 색상 사용자 지정 (매수/매도)
- 가격/거래량 다이버전스
- 일반 및 숨겨진 다이버전스 자동 감지
- 강도 분류: 강/중/약
- 고급 필터: 거래량 확인, 추세, 시간 거리
- 화살표로 그래픽 신호 표시
- 시장 불균형
- Ask/Bid의 중요한 불균형 식별 (비율 설정 가능)
- 검증을 위한 최소 거래량 임계값
- 차트에 색상 점 표시 (강세/약세)
- Infusion Volume
- 평균 대비 비정상적인 거래량 급증 감지
- 배수 및 기간 사용자 지정 가능
- 기관 개입 및 거래량 클라이맥스 강조
- Splash Signal
- 거래량 피크의 그래픽 표시
- 캔들 위/아래 Wingdings 기호
- 캔들 마감 시 신호 생성 (리페인트 없음)
- 오프셋 및 크기 사용자 지정 가능
- POC Delta (Point of Control)
- 델타 집중도가 가장 높은 가격 계산
- 자동 방법: Freedman-Diaconis 또는 ATR
- 수평선 + 선택적 밴드
- 세션 중 동적 업데이트
- Delta Profile
- 공격적 델타 기반 거래량 프로파일
- 모드: 순 델타 또는 절대값
- 좌/우 앵커 설정 가능
- 가장 중요한 N 레벨 강조 표시
- 강도에 비례한 색상 직사각형
- VWAP Delta
- 공격적 거래량 기반 가중 평균 가격
- 세 가지 계산 모드:
- NET_DELTA_WEIGHTED: 순 델타만
- NET_ALL_VWAP: Ask + Bid 방향 포함
- NET_AVG_BUY_SELL: 매수/매도 VWAP 평균
- 매수, 매도, 순 델타 라인 분리 표시
인터랙티브 패널
- 제어 패널 (UCP)
모든 기능의 실시간 ON/OFF 관리:
- Delta Profile
- POC Delta
- VWAP Net
- 다이버전스
- 불균형
- Infusion
- Splash
드래그 가능 – 차트에서 자유롭게 배치, 색상 표시기 포함 (파란색 = ON / 회색 = OFF).
매수/매도 비율 패널
- 공격적 매수/매도 거래량 비율 표시
- 동적 색상 (매수 > 매도 시 녹색)
- 사용자 지정 텍스트 템플릿
- 멀티 타임프레임 강도 패널
- 현재 TF + M15 + H1 + H4의 집계 분석
- 강도 분류가 있는 진행형 그래픽 바 (강/중/약)
- 각 타임프레임 값에 대한 상세 툴팁
- 성능 최적화를 위한 캐시 시스템
설정 가능한 매개변수
- 세션 리셋: 사용자 지정 세션 시작 시간
- 스무딩 기간: 누적 델타 EMA 필터 (기본값: 10)
- 다이버전스: 7개의 고급 매개변수 (스윙, 임계값, 추세/거래량 필터)
- 불균형: 비율 및 최소 거래량
- Infusion/Splash: 기간 및 배수
- POC: 계산 방법, 밴드, 스냅 투 틱
- Delta Profile: 빈, Top N, 너비, 색상
- VWAP: 계산 모드, 라인 색상, 스타일
- 패널: 위치, 글꼴 크기, 색상, 템플릿
운영상의 이점
- POC 및 Delta Profile을 통한 기관 영역 식별
- 다중 확인 다이버전스로 반전 예측
- 불균형 및 Infusion으로 돌파 확인
- 매수/매도 패널 및 MTF로 실시간 심리 분석
- 인터랙티브 패널로 컨텍스트 적응
- 확인된 신호에 지연 없음 (Splash는 리페인트 없음)
- 색상, 임계값 및 시각화 완전 사용자 지정
대상 사용자
- 외환, 지수, 암호화폐, 원자재의 인트라데이 트레이더
- 고급 거래량 분석이 필요한 스캘퍼 및 데이 트레이더
- 다중 신호 확인을 원하는 재량 트레이더
- 초보자: Auto-Tuning 활성화 시 자동 보정
- 전문가: 고급 매개변수 완전 제어
기술 요구 사항
- 플랫폼: MetaTrader 4
- 타임프레임: 모든 (M1–H4 최적화)
- 도구: 외환, 지수, 암호화폐, 원자재, 주식
- 리소스: 경량 및 최적화 (스마트 캐시, 온디맨드 계산)
완전한 문서
구매 후 MQL5 개인 메시지를 통해 판매자에게 직접 연락하면 상세 기술 매뉴얼, 베스트 프랙티스 및 단계별 가이드 제공.
면책 고지
Delta Fusion Pro는 트레이딩 활동을 지원하는 분석 도구입니다. 운영 권장 사항이나 성과 보증을 제공하지 않습니다. 거래 결정은 사용자 책임입니다. 기술적 지식과 적절한 리스크 관리가 필요합니다.
전문적인 주문 흐름 분석으로 인트라데이 트레이딩을 혁신하세요!
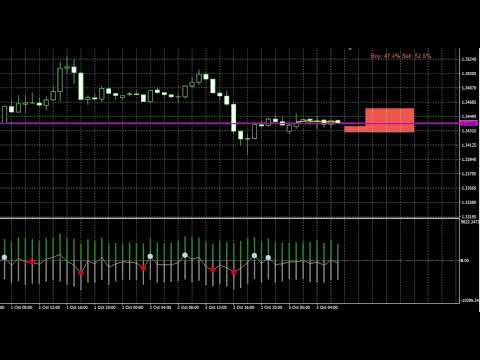


buonasera, ho appena acquistato il tuo indicatore e vorrei avere maggiori informazioni sui parametri da usare per avere leggibile i volume profile che vedo in foto e la linea vwap, grazie