Guarda i video tutorial del Market su YouTube
Come acquistare un Robot di Trading o un indicatore
Esegui il tuo EA
hosting virtuale
hosting virtuale
Prova un indicatore/robot di trading prima di acquistarlo
Vuoi guadagnare nel Market?
Come presentare un prodotto per venderlo con successo
Expert Advisors e Indicatori per MetaTrader 5 - 46

Core Positioning A lightweight risk calculation tool tailored exclusively for the MT5 platform, focusing on the core needs of traders' daily risk control calculations. It deeply optimizes the operation experience and data display effect, adapts to various chart viewing and trading scenarios such as intraday trading and swing trading, and is a highly practical auxiliary tool for traders' daily risk control operations. Core Functions Easy Lot Size Editing: Click the input box to enter values dire
FREE

MT4 Version Most indicators draw lines.
This one draws the battlefield. If you ever bought an EA or indicator based on a perfect equity curve — and then watched it bleed out live — you’re not alone.
The problem? Static logic in a dynamic market. Fibonacci Bollinger Bands adapts.
It combines Bollinger structure with customizable Fibonacci levels to mark zones of control — where price reacts, pauses, or reverses. No magic. Just logic that follows volatility. Why this tool matters It
FREE
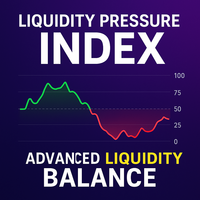
Liquidity Pressure Index (LPI) is an advanced technical indicator designed to uncover the hidden battle between buyers and sellers in the market. Unlike conventional oscillators that only rely on price movements, LPI integrates market depth (order book data), ATR-based volatility compression, and adaptive smoothing to give traders a deeper view of true liquidity dynamics.
By combining price action with volume absorption and order flow pressure, the LPI helps traders anticipate shifts in market
FREE

RENKO Reversal by StockGamblers Actually working RENKO in MT5. Uses "custom symbols" for drawing. You can apply any indicators with complete peace of mind. The movement of the last price is displayed in real during the formation of the "brick". Put the script in the MQL5/Experts folder. More precisely: C:\Users\user\AppData\Roaming\MetaQuotes\Terminal\terminal_number\MQL5\Experts Settings: ValuePerBar - height of the "brick" in points revCandle - multiplier for the height of the turning "brick".
FREE

Presentation
Another indicator that makes scalping on tick charts easier, it displays an Heiken Ashi graph in Ticks.
It allows to detect entry points and trend reversals. Recommended number of ticks in a candle : 5, 13 or 21.
Parameters Ticks in candle: Number of ticks in a candle (default 5), Displays Trend arrows : displays a trend arrow based on EMA8 and EMA20 crossing, Displays MM50, Displays MM100, Max Candle (CPU): number of candles max to manage, low value will save ressources of your
FREE

What is SMC Market Structure Pro? SMC Market Structure Pro is an automated trading Expert Advisor for MetaTrader 5 , developed based on Smart Money Concept (SMC) and market structure analysis . The EA is designed to help traders follow the natural flow of the market , focusing on price structure instead of indicators or lagging signals. How Does the EA Work? The EA analyzes market structure changes using pure price action: Detects higher highs & higher lows for bullish structure Detects l
FREE

Introducing our innovative Expert Advisor (EA) designed to capitalize on pullback opportunities in the forex market, with the support of the Average True Range (ATR) indicator. This strategy focuses on identifying moments when the price temporarily retraces within a dominant trend, offering potential entry points with controlled risk. The ATR is a volatility indicator that measures the amplitude of price movements over a given period of time. By integrating the ATR into our EA, we can assess the
FREE
AutoGrid Assistant - Strumento di Posizionamento Automatico di Ordini a Griglia ASSISTENTE GRATUITO per i trader che utilizzano strategie di trading a griglia! COSA FA: AutoGrid Assistant posiziona automaticamente una griglia di ordini pendenti (Buy Stop/Sell Stop o Buy Limit/Sell Limit) con una singola esecuzione. Nessun clic manuale richiesto! CARATTERISTICHE PRINCIPALI: Posizionamento automatico della griglia con un clic Supporto per ordini Stop e Limit Impostazioni flessibili della griglia (
FREE

RUHM GOLD (TF M1)
## Test on XAU/GOLD | RAW Account (not suitable for microcent accounts), Adjust spread and level, minimum equity limit $100 ## Adjust the parameters according to your Trading Style, to get the estimated value of the strategy calculation. ## You must provide feedback in the comments column, regarding the trials you have conducted.
This Expert Advisor (EA) is provided FREE OF CHARGE for testing and educational purposes only .
It is NOT recommended for use on live (real) t
FREE
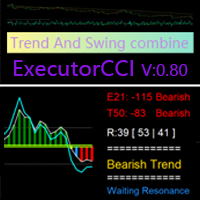
Based on the CCI Trend-Following Principle, Improved to Identify Trend Reversals
This indicator is designed to confirm trends after identifying them using the ( Executor Trend Indicator ) indicator, making it a tool for both trend confirmation and reversal detection. Features Green and Red Histogram: Represents the development of bullish (green) or bearish (red) trends in the current timeframe. Blue Line and Green Histogram (Bullish Confirmation): When the blue line rises above +10
FREE
Forex Trade Manager MT5 simplifies managing open orders in MetaTrader 5. If you open a new order, the manager automatically sets Stop Loss and Take Profit. When price will move, then the program could move Stop Loss to Break Even (stop loss = open price) or continuously moving Stop Loss (Trailing Stop) to protect your profits. Forex Trading Manager is able to control orders for only current symbols (where EA works) or for all opened orders (regardless symbol) and hide the Stop Loss and Take Prof
FREE

Mr. Charles – The Gentleman of Trend Trading (MT5) Mr. Charles is not just another trading algorithm; he is a sophisticated, trend-following Expert Advisor designed for the MetaTrader 5 platform. Named after the precision and discipline of high-tier financial consultants, Mr. Charles combines advanced mathematical filters with a robust recovery system to deliver consistent results in the EURUSD market. Why "Mr. Charles" is the Best Choice for Your Portfolio: The "Gentleman" Filter (ADX Log
FREE

Position Size Companion – Interactive Risk & Lot Calculator for MT5
Position Size Companion is a professional, chart-based position sizing tool designed for traders who demand precision, speed, and visual clarity when managing risk. It is fully suitable for both Forex markets and synthetic instruments such as Volatility indices (e.g., V75), and similar symbols.
With this tool, traders can bid farewell to constantly using external or built-in GUIs that require manual input of entry and stop-l
FREE

GridMA Scalper EA is a semi-aggressive grid-based trading robot that combines Moving Average (MA) crossover logic with time-filtered grid entries. It is designed to capture both trending and pullback opportunities with built-in risk control mechanisms. Strategy Overview: Uses MA crossover (SMA 21) as signal Automatically opens grid entries when price moves against initial entry Supports both BUY and SELL directions Grid lot size increases using a multiplier Built-in trailing stop, breakeve
FREE

Market Cycle and Trading Sessions Indicator
Introducing our Market Cycle and Trading Sessions Indicator, a tool designed to provide you with a comprehensive view of the financial market like never before. Observe the market's pulse with our exclusive indicator. Gain a deep understanding of market phases, from accumulation to distribution, to make informed, strategic decisions with a high probability.
What makes our indicator?
1. Date Range for Calculations: Customize the start and end dates
FREE

Hunt markets with Hunttern ZigZag . Easy to use with one parameter
You can use it for the following: -Classic patterns -Heads and shoulders -Harmonic patterns -Elliott Wave -Support and resistance -Supply and Demand
Single parameter: -Period (1-120)
Features: -Candle time -Single parameter -Light mode template
This is version 1 of Hunttern ZigZag. We are very happy to receive feedback from you.
FREE

MSX Unified Hybrid PRO Advanced hybrid EA combining Heiken-Ashi Double Smoothed + Hull MA Double Smoothed filters with ATR-driven stops, breakeven, trailing, and capital protection. Fully automated and MQL5 Market compliant. MSX Unified Hybrid PRO is a fully automated Expert Advisor that merges precision trend detection with intelligent capital management.
It uses Heiken-Ashi candle smoothing and Hull Moving Average smoothing confirmation to identify clean directional moves, while its ATR-dri

A useful dashboard that shows the RSI values for multiple symbols and Time-frames. It can be easily hidden/displayed with a simple click on the X top left of the dashboard. You can input upper and lower RSI values and the colours can be set to show when above/below these values. The default values are 70 and 30. You can choose whether the dashboard is displayed on the right or left of the chart. If you want to have 2 dashboards on the same chart you must input a different name for each. The sca
FREE

EA di trend completamente automatizzato con strategia attiva e sistema di media avanzato. Gli ordini vengono aperti secondo un filtro di tendenza che utilizza oscillatori per una maggiore sicurezza del segnale. Ha una configurazione semplice e chiara. L'EA è adatto per l'uso su qualsiasi strumento e intervallo di tempo vantaggi: Sistema automatizzato con la possibilità di aggiungere ordini manuali Algoritmo di recupero per sovrapposizione regolabile Possibilità di fare trading in una o entrambe
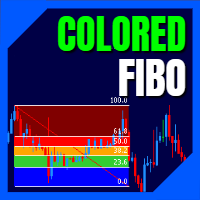
LT Colored Fibo is a simple indicator that paints the price zones between Fibonacci Retracement levels. Its configuration is extremely simple. It is possible to change the colors of each level of the retracement, choose between background or front of the chart and also work only with the current asset or all open. If you found a bug or have any suggestion for improvement, please contact me. Enjoy!
This is a free indicator, but it took hours to develop. If you want to pay me a coffee, I apprecia
FREE

A clean Bollinger Bands indicator with single-color filling designed to reduce chart clutter. What is This Indicator? This is a Bollinger Bands technical indicator designed with visual simplicity in mind. Unlike standard Bollinger Bands implementations that display multiple colored lines and bands, this indicator uses a single-color filled area to represent the trading bands. This approach minimizes visual clutter while maintaining full functionality for technical analysis. How It Works The ind
FREE

Ispirato dal corso di mentorship privato di ICT del 2016 (mese 05), condiviso su YouTube, il nostro innovativo strumento permette ai trader di navigare con precisione sui mercati. Segnando periodi di 60, 40 e 20 giorni, aiuta a identificare movimenti significativi del mercato, attingendo alla saggezza trasmessa da ICT. Ciò che veramente distingue questo indicatore è la sua capacità di proiezione in avanti, una caratteristica che offre preziose prospettive sul comportamento futuro del mercato bas
FREE

BigBull EA (BigB) — XAUUSD Trend-Following Expert Advisor for MetaTrader 5 BigBull EA is a precision-engineered trend-following system built for traders who demand high-confidence entries, disciplined risk control, and adaptive market behavior. Designed primarily for XAUUSD/Gold , BigB dynamically adjusts to different market environments and can be deployed across Forex and other instruments with its flexible system profile. What BigBull EA Does BigBull EA identifies emerging trends, validates

GEN UT Bot Developer: Gede Egi Overview GEN UT Bot is an Expert Advisor (EA) for MetaTrader 5 that fully automates the trading strategy based on the popular "UT Bot Alerts" indicator. This EA is designed as a pure trend-following system, where trading signals are generated when the price crosses over a dynamic trend line calculated from the Average True Range (ATR). With comprehensive risk management, this EA is suitable for traders looking for a systematic approach to following market trends.
FREE
Incontra Master Oscillators, un bot che rende il trading semplice e flessibile! Scegli tra i segnali RSI, CCI o Stochastic e costruisci la tua strategia. Questo bot ti offre molti strumenti, come il filtro MA, dimensioni del lotto dinamiche, calcolatrice del criterio di Kelly, livelli SL e TP dinamici, e molto altro. Qualunque sia il tuo stile di trading, Master Oscillators è qui per te. Ti fornisce informazioni importanti, statistiche e altro ancora, mantenendo sempre sicuro il tuo trading. Se
The RMI Scalper EA is a fully automated Expert Advisor that trades pullbacks from the major trend using RMI and limited averaging. The EA trades using market orders and uses averaging to safely turn otherwise negative trades positive. This EA works best on USDJPY, EURUSD, GBPUSD, USDCAD, USDCHF, AUDJPY, EURCAD, EURGBP and EURJPY using the M30 timeframe and has the option to trade multiple pairs but only one pair at any one time to increase trade frequency without increasing draw down.
Please not
FREE

Swiss VWAPsimple Motivation Did not find free VWAP that works, the one that I found craseh. So I created a VWAP which calculates values only for the actual day. So computer resouces are not over stressed.
What is VWAP, how is it used? VWAP stands for Volume Weighed Average Price, it calculates the running sum of tick volume and the runnung sum of price times tickvolume. The division of these sums result in a weighed price (Sum P*V/Sum V). The calculation starts normally at midnight. The values
FREE

CandleForce Pro: The Ultimate Decision-Support Dashboard for Modern Traders Introduction: Overcoming the Chaos of Modern Markets
In today's hyper-connected financial markets, the modern trader faces a paradox of choice. We are inundated with an endless stream of data, indicators, news, and strategies, all promising to unlock the secrets of profitable trading. This constant influx often leads to "analysis paralysis"—a state of cognitive overload where conflicting signals create confusion, hesit
FREE

It is a panel that seems common, however, far beyond those of additional buttons for closing multiple orders, it is essential for those using the offline charts generators for Renko, Range, Ticks, and similars because in the Metatrader 5 does not allow the manual operation of orders in these charts that are generated synthetically. The "TRADE PANEL" makes it very easy to handle both orders executed to the market and the placing of pending orders, offering practically the same immediate action
FREE
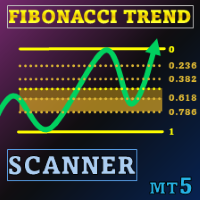
Offerta speciale : ALL TOOLS , solo $35 ciascuno! New tools will be $30 for the first week or the first 3 purchases ! Trading Tools Channel on MQL5 : Join my MQL5 channel to update the latest news from me In un ambiente di trading volatile, uno strumento di analisi potente e intuitivo può aiutarti a cogliere rapidamente le opportunità. Fibonacci Trend Scanner non solo integra le funzioni tradizionali dell’indicatore Fibonacci e SuperTrend, ma amplia anche le funzionalità con la sca

BEHOLD!!!
One of the best Breakout Indicator of all time is here. Multi Breakout Pattern looks at the preceding candles and timeframes to help you recognize the breakouts in real time.
The In-built function of supply and demand can help you evaluate your take profits and Stop losses
SEE THE SCREENSHOTS TO WITNESS SOME OF THE BEST BREAKOUTS
INPUTS
MaxBarsback: The max bars to look back
Slow length 1: Period lookback
Slow length 2: Period lookback
Slow length 3: Period lookback
Slow leng
FREE

Advanced Market Analysis Tool : Dive into market depth with the MT5 Volume Profile Indicator. Seamless MT5 Integration : Perfectly compatible with the MT5 platform. Enhances Pro Thunder v9 : Integrates smoothly with Pro Thunder v9 for deeper market insights. Detailed Volume Analysis : Explore market dynamics through in-depth volume data. ️ Simple Installation : Easy-to-follow setup steps for quick integration with MT5. Efficient Single Chart Application : Best used on a single c
FREE

Infinity Predictor MA
Infinity Predictor MA is a next‑generation forecasting indicator that transforms the traditional Moving Average into a powerful predictive tool. Unlike standard MAs that only smooth past data, this indicator projects the moving average line up to 40 bars into the future, giving traders a unique perspective on potential market direction.
The engine behind Infinity Predictor MA combines multiple advanced regression models to capture both smooth trends and sudden market shi
FREE

I think you all know Donchian Channels. so I am not going to write about it.
With this indicator I tried to create Donchian Trend Ribbon by using Donchian Channels.
How it works ?
- it calculates main trend direction by using the length that is user-defined. so you can change it as you wish
- then it calculates trend direction for each 9 lower lengths. if you set the length = 20 then the lengths are 19, 18,...11
- and it checks if the trend directions that came from lower lengths is same
FREE
The Ultimate Signal Builder Basic combines the features of other 3 expert advisors, providing all their trading signals in one single place: 1. the Price Action Builder Basic ; 2. the Bollinger Bands Builder Basic ; 3. the Chart Patterns Builder Basic .
The Ultimate Signal Builder Basic expert advisor shares the same characteristics as the 3 underlying experts: usage of stop loss orders, maximum 1 managed open trade, automatic trade closure and configurable validation mechanism. While being ess
FREE
Oscillatore Elliott - Uno strumento di analisi del momentum che rileva le inversioni di tendenza attraverso modelli di convergenza delle medie mobili. L'indicatore mostra istogrammi blu per il momentum rialzista e istogrammi rossi per condizioni ribassiste, mentre disegna automaticamente linee di tendenza tra picchi e valli significativi. Sistema di Avvisi : Scegli tra due modalità - Avvisi Barra Corrente (alertsOnCurrent = true) si attivano immediatamente su barre in sviluppo ma possono ridipin
FREE

Structure Blocks: a structured way to analyze market structure
This indicator is for you if you are a price action or smart money concept trader. It identifies market trends' ultimate highs and lows and intermediaries' swing lows and highs. It adjusts based on candles' body where most of the volume is, disregarding wicks. Need help or have questions? I am Lio , don't hesitate to reach out! I am always available to respond, help, and improve. How it works:
Each block consists of a move with
FREE

My other indicators
https://www.mql5.com/en/market/product/156702 https://www.mql5.com/en/market/product/153968 (FREE) https://www.mql5.com/en/market/product/153960 (FREE)
️ Multi-Timeframe Supply & Demand Zones with Fair Value Gaps (FVG) MyFXRoom Supply & Demand Zones with FVG is a multi-timeframe indicator that automatically detects and draws Supply and Demand zones directly on your chart — complete with Fair Value Gap (FVG) validation, gap-aware zone sizing , and smart clean-up logic to
FREE

TrianglePatternGannEA Pro v7.0 Standalone - Complete Analysis & Optimization Guide Overview TrianglePatternGannEA Pro v7.0 is an advanced all-in-one Expert Advisor that combines Gann Triangle pattern detection with an intelligent anti-extreme filtering system. This EA operates completely standalone without requiring external indicators, making it efficient and reliable for automated trading. Core Features Analysis 1. Pattern Detection System Gann Triangle Recognition The EA identifies classic G
FREE
The RFOC Candle Timer 2x was created for the trader to locate himself in time, having access to the pending time for the formation of a new candle. Additionally, it is possible to include in the chart a second timer that shows the pending time for the formation of a new candle in a time period different from the current one. The user will have the option to select up to 4 different positions for the timer display ("No candle", lower left corner, lower right corner or upper right corner). In ad
FREE
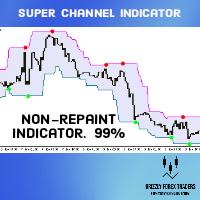
Super Signals Channel Indicator Its channel is a non-repaint indicator that reacts more with recent price movements. For this reason, the Super Signals Channel Indicator is a better match for short-term or day trading strategy. The Super Signals Channel only plots swing trading opportunities. So most of its trade signals appear during consolidation or sidelined periods of the market. Super Signals Channel Indicator for MT5 Explanation The green band below the price shows the dynamic support lev
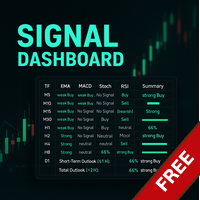
Link to the full version: https://www.mql5.com/de/market/product/138246?source=Site +Profile+Seller#description Feature enhancements or comments are always welcome! Description: This powerful script provides traders with a comprehensive real-time signal overview across multiple timeframes using some of the most reliable technical indicators. It is designed as a clear, compact table on the chart and displays actionable insights for selected timeframes - helping traders make informed decisions ba
FREE

Take Control of Risk with Smart Trailing Stop Manager for MetaTrader 5 Looking for MetaTrader 4 version? I t is available separately in the Market: Smart Trailing Stop Manager MT4 Full User Guide – Public channel: CLICK HERE Tired of missed profits or manual stop loss adjustments?
Smart Trailing Stop Manager is a powerful utility for MetaTrader 5 designed to automate your trailing stop, breakeven, partial close, and SL management. Whether you're a discretionary trader, signal follower, o

Introduzione Break Asian Range è un bot di trading che automatizza la famosa strategia dei “massimi e minimi asiatici”. È progettato per rilevare e operare le rotture della sessione asiatica su asset come EURUSD, GBPJPY e altre coppie volatili. Combina conferme tecniche personalizzabili con una gestione del rischio avanzata (SL, TP, trailing stop, rischio variabile, rientri...) per adattarsi a stili di trading sia conservativi che aggressivi. Funziona con più timeframe e riconosce i principali
FREE

News Scalper EA is an Expert Advisor for trading EURUSD - GBPUSD - XAUUSD pairs, positioning your positions during the news. Developed by an experienced trader with over 17 years of trading experience. News Scalper EA uses a news calendar from MQL5 and trades according to them. With sophisticated strategy and risk management, the EA protects your positions from larger losses! News Scalper EA lets you close the SL after the set time (1 minute, planned) when the position is in minus, which proves
FREE

BarTimer v1.0 | Visualización Dinámica de Tiempo para MT5 BarTimer v1.0 es un indicador de alta precisión diseñado para traders que buscan gestionar el tiempo de cierre de sus velas sin saturar su espacio de trabajo. A diferencia de los contadores numéricos tradicionales, utiliza una barra de progreso visual que permite interpretar el ciclo del mercado de un solo vistazo. BarTimer v1.0 "La gestión del tiempo es tan crítica como la gestión del riesgo. BarTimer transforma un dato abstracto en una
FREE
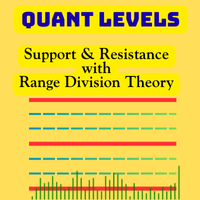
Quant Levels Indicator is a premium component of the Quantitative Trading Analysis Toolkit , designed to transform subjective trading into data-driven decision making. This advanced tool provides institutional-grade support and resistance analysis directly on your MT5 charts. " Please support our work by leaving a review ". As a thank-you gift , we’ll share a special template that helps you display signal trade history directly on your chart. Free indicator to visualize any MT5/MT4 signals i
FREE
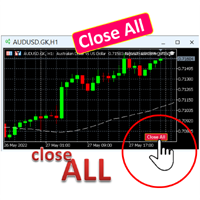
A simple button to completely close all existing open trades (both Buy and Sell) on the current chart .
Warning : Once the button is pressed, all open trades on the current chart will be deleted immediately without any more questions or dialogue.
Use this utility very carefully. We recommend that you do a trial of removing open trades on a demo account first, before trying to use this utility on a real account.
FREE

Break Even Line by MMD
The Break Even line is a useful indicator for people using strategies that allow simultaneous trades in both directions, such as the MMD methodology. This indicator is useful when playing statistical models and averaging positions in accumulation and distribution zones. The indicator draws levels by summing positions in three groups: positions included in BUY, positions included in SELL and all positions included.
Functionality description:
Show BUY BELine - shows or
FREE

INTRODUZIONE
Deriv AlgoTraders EA (bot) è progettato e sviluppato da esperti professionisti del mercato con anni di esperienza con l'obiettivo di preservare il capitale di trading realizzando profitti costanti. Funziona sulla piattaforma MT5 fornita da Deriv Limited, una società di brokeraggio che offre un'ampia gamma di asset derivati da mercati reali o simulati. Alcuni dei vantaggi di questo tipo di mercato sono la sua disponibilità 24 ore su 24, 7 giorni su 7 e l'influenza limitata da notiz

Phoenix Moving Average Meter (MT5)
Strumento professionale di analisi e visualizzazione dei trend delle medie mobili per MetaTrader 5. Combina analisi intelligente della pendenza, misurazione della larghezza del cloud e classificazione del regime in un dashboard pulito e in tempo reale.
Panoramica
Phoenix Moving Average Meter analizza la relazione tra una media mobile veloce e una lenta per determinare la direzione, la forza e la maturità del trend. L'indicatore monitora continuamente l'angol
FREE

Мой самый популярный и востребованный продукт здесь https://www.mql5.com/ru/market/product/41605?source=Site+Market+Product+From+Author#
Индикатор стрелочник идеален для торговли в боковике, очень точно показывает моменты перекупленности и перепроданности инструмента, с дополнительными фильтрами также можно использовать для торговли по тренду. На экран выводятся стрелки сигнализирующие о развороте тренда, направление стрелки показывает дальнейшее направление торговли, также имеется звуковое о
FREE

Market Hours Pro shows Tokyo, London, and New York trading sessions directly on your MT5 chart, including scheduled overlap periods. It’s designed to give you a clear view of global market timing so you can plan trades, spot high-activity periods, and align strategies with standard Forex hours. How It Works Displays scheduled session times visually on your chart. Highlights session overlaps for London/New York and Tokyo/London. Automatically adjusts times for your timezone or broker time. Shows
FREE

This indicator calculates fibonacci levels via moving averages trend and draw these lines. You can change fast and slow Moving Averages settings for customization. Inputs:
Fast MA Time Period : 64 Fast MA Shift: 0 Fast MA Method: Smoothed Fast MA Apply To: Median Price Slow MA Time Period: 32 Slow MA Shift: 0 Slow MA Method: Smoothed Slow MA Apply To: Median Price ZigZag: False ZigZag Color: Red ZigZag Type: DashDot ZigZag Width: VeryThin Fibo Settings TrendFibonacci: True FiboTrendColor: Black
FREE

Trade Hunter MT5 - Buy and Sell Indicator
Unlock precise trading opportunities with Trade Hunter MT5! This powerful indicator identifies potential buy and sell signals by analyzing price movements over a customizable period. Blue arrows mark buy opportunities below key lows, while red arrows highlight sell signals above critical highs. With adjustable parameters like bar range, percentage offset, and alert settings, Trade Hunter adapts to your strategy. Optional alerts and notifications ensur
FREE

Probability emerges to record higher prices when MACD breaks out oscillator historical resistance level. It's strongly encouraged to confirm price breakout with oscillator breakout since they have comparable effects to price breaking support and resistance levels; surely, short trades will have the same perception. As advantage, many times oscillator breakout precedes price breakout as early alert to upcoming event as illustrated by 2nd & 3rd screenshot. Furthermore, divergence is confirmed
FREE

EA_XAU_RollingRange_ScalpBreakouts_v1_04_MODERN_PROD_EMA
XAUUSD – Rolling Range Breakout con EMA-Bias (M1 Execution)
Breve descrizione
EA_XAU_RollingRange_ScalpBreakouts è un Expert Advisor strutturato per il breakout su XAUUSD che opera sul grafico M1 e negozia i breakout da un intervallo intraday rolling.
La strategia combina una definizione precisa dei livelli, rigorosi filtri di costo e tempo e un filtro di tendenza a intervalli di tempo più elevati (M15 EMA50/200) per sfruttare i movimen
FREE

This is an indicator of trading sessions that can display all levels (Open-High-Low-Close) for four sessions . The indicator can also predict session levels. Sessions can be drawn with lines or rectangles (empty or filled), lines can be extended to the next session. You can easily hide/show each session by pressing hotkeys (by default '1', '2', '3', '4'). You can see ASR (Average Session Range) lines (default hotkey 'A'). This is similar to the ADR calculation, only it is calculated based on

Sure, here's a description:
Introducing the Arbitrage Forex Scalper Expert Advisor - your ultimate solution for precise and lightning-fast trading in the forex market. Designed with cutting-edge algorithmic technology, this expert advisor (EA) empowers traders with the ability to capitalize on micro price differentials across various currency pairs, effortlessly exploiting arbitrage opportunities.
Built upon years of meticulous research and development, the Arbitrage Forex Scalper EA operates
FREE

Introducing a sophisticated BreakOut and RecoveryZone tool designed to empower traders in any market scenario, facilitating the optimization of trade opportunities.
The core strategy revolves around executing price breakouts using BuyStop and SellStop orders to achieve specific profit targets in dollars. Notably, traders can manually set the BuyStop and SellStop levels by simply clicking and dragging lines on the chart (FixedZone=true is required).
For swift market entry, you can drag the BuyS
FREE
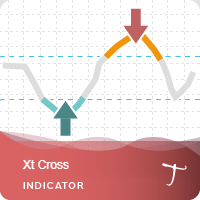
Xt Cross is a port of a famous TS /MT indicator.
When the oscillator is above the overbought band (red lines) and crosses down the signal (dotted line), it is usually a good SELL signal. Similarly, when the oscillator crosses above the signal when below the Oversold band (green lines), it is a good BUY signal.
Xt Cross Advantages The indicator is suitable for scalping and intraday trading. It is possible to evaluate the effectiveness of the indicator on history. The indicator does not
FREE

Volume Calculator
This indicator shows the volume to be used in an operation based on the maximum acceptable stop value and the size of the stop. That way you will not use a calculator to calculate the volume you are going to use every time. This indicator makes your life much easier and faster. Suitable for any type of trader: Scalper, DayTrader, SwingTrader.
FREE

Advanced SatoshiMind AI Bitcoin Robot MT5 - JUST PLUG & PLAY ON BTCUSD CHART in M5 time- For Back test Use 1 Mint OHLC Mode Upgraded with Best AI & Neural Network Features for Higher Accuracy in BTCUSD Trading- MUST BUY THIS PROFITABLE AI ROBOT!! - Upgraded version Date 22Dec 2025 Introducing Advanced SatoshiMind AI Bitcoin Robot MT5 — a next-generation Expert Advisor built to trade Bitcoin/BTCUSD with intelligent precision, using a unique blend of technical mastery and AI-driven decision-maki

This indicator was developed to support multiple timeframe analysis. In the indicator settings, the user can set the color, width, and style of the horizontal lines for each timeframe. This way, when the horizontal lines are inserted into the chart, they will be plotted with the timeframe settings.
MTF Lines also allows visibility control of another objets like rectangles, trend lines and texts.
This is a product developed by Renato Fiche Junior and available to all MetaTrader 4 and 5 users!
FREE

Money Mind BTC — BTCUSD su H1 (v13.00) Sistema automatizzato con gestione globale del rischio e comportamento adattivo Money Mind BTC 13.00 è un Expert Advisor progettato per operare su BTCUSD con un controllo totale del rischio e una logica di adattamento automatico. Combina stabilità operativa, flessibilità di configurazione e una struttura di gestione globale che adatta il suo comportamento alle condizioni di mercato. Caratteristiche principali Simbolo: BTCUSD Timeframe consigliato: H1 Filtri
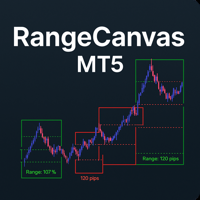
Daily Range Boxes : The indicator draws rectangular boxes around each day's high and low prices, creating a clear visual boundary for the daily trading range. Color-Coded Logic : Green boxes when the current price (or close) is above the daily open Red boxes when the current price is below the daily open Percentage Level Lines : Inside each box, it draws three horizontal lines at: 25% of the daily range 50% of the daily range (midpoint) 75% of the daily range Range Information : Each box displa
FREE

BUILD YOUR GRID
The expert is a system to help any trader to make a grid of orders (without martingale, lite martingale, or full martingale) easy and simple. Please make your test to find your settings. Default settings are just to take an idea of how the expert works. The expert can make according or contrary grid of orders. You can set the expert to work in hedge mode if the losses are huge. The system uses a high-risk strategy. It's better to test it first in a demo account. Version for MT4:
FREE
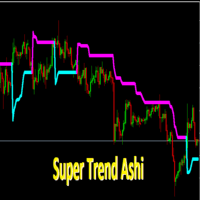
SuperTrendAshi Description SuperTrendAshi is an advanced and optimized version of the SuperTrend indicator that incorporates Heikin Ashi calculation to provide smoother and more reliable signals. This unique combination results in an indicator that reduces false signals and identifies trends with greater precision. Key Features Combines the strength of SuperTrend with Heikin Ashi smoothing More stable signals with less noise Intuitive color system (Aqua for uptrend, Magenta for downtrend) Custo
FREE

Esegue l'esportazione della cronologia delle transazioni del conto di trading corrente. Il file viene salvato nella cartella dati, che può essere aperta tramite il menu principale del terminale: File -> Apri directory dati (Ctrl+Shift+D) e vai alla cartella MQL5/File . Il nome del file viene generato automaticamente o impostato manualmente tramite i parametri dello script. Il file di cronologia può essere utilizzato per analizzare la cronologia in Excel (potrebbe essere neces
FREE

Versione MT4 | FAQ L' indicatore Owl Smart Levels è un sistema di trading completo all'interno dell'unico indicatore che include strumenti di analisi di mercato popolari come i frattali avanzati di Bill Williams , Valable ZigZag che costruisce la corretta struttura a onde del mercato, e i livelli di Fibonacci che segnano i livelli esatti di entrata nel mercato e luoghi per prendere profitti. Descrizione dettagliata della strategia Istruzioni per lavorare con l'indicatore Consulente-assistente
Il MetaTrader Market è un sito semplice e pratico dove gli sviluppatori possono vendere le loro applicazioni di trading.
Ti aiuteremo a pubblicare il tuo prodotto e ti spiegheremo come prepararne la descrizione per il Market. Tutte le applicazioni sul Market sono protette da crittografia e possono essere eseguite solo sul computer dell'acquirente. La copia illegale è impossibile.
Ti stai perdendo delle opportunità di trading:
- App di trading gratuite
- Oltre 8.000 segnali per il copy trading
- Notizie economiche per esplorare i mercati finanziari
Registrazione
Accedi
Se non hai un account, registrati
Consenti l'uso dei cookie per accedere al sito MQL5.com.
Abilita le impostazioni necessarie nel browser, altrimenti non sarà possibile accedere.