YouTubeにあるマーケットチュートリアルビデオをご覧ください
ロボットや指標を購入する
仮想ホスティングで
EAを実行
EAを実行
ロボットや指標を購入前にテストする
マーケットで収入を得る
販売のためにプロダクトをプレゼンテーションする方法
MetaTrader 5のためのエキスパートアドバイザーとインディケータ - 51

The Investment Castle Chances indicator will show signals on the chart for entering a buy or sell trade. There are 2 types of signals for each direction as follows: Buy / Sell (Orange colored candlesticks) Strong Buy (Green colored candlesticks) / Strong Sell (Red colored candlesticks) You may place a buy trade once you see the Buy arrow or vise versa, or you might prefer to wait for a further confirmation “Strong Buy” / “Strong Sell”. This indicator works best with the high time frames H1,
FREE

Professional Gold Trading EA - Advanced Algorithmic System Professionally engineered trading system designed specifically for XAUUSD and other Gold symbols. This EA has been developed using advanced quantitative methods that institutional traders rely on. Info
Timeframe: H1 (1-hour charts) Minimum Account Size: $1000 USD or equivalent cent account Usage Instructions Simple 3-step setup process: Load the EA to any XAUUSD H1 chart Set your preferred position sizing - either fixed lots or risk pe

Combining the best of Price Action , Directional Movement , and Divergence/Convergence analysis, Candle Color Trend is a easy and reliable way to identify trend direction. The indicator automatically paints the candles according to the assumption that an uptrend is defined by prices that form a series of higher highs and higher lows. In contrast, a downtrend is defined by prices that form a series of lower highs and lower lows. Additionally, ADX Wilder indicator is used to measure trend weakness
FREE

This EA is based on statistical observations how a price moves after American, European or Asian stock exchanges are open.
You can fine-tune this EA according to your favorite FX pair, its daily price range, your risk tolerance and signal sensitivity. How it works:
The EA is taking Hi-Lo price levels (ATR) from time range set buy a trader and watches for breakout of one of the level during the trading hours. If level is broken and other conditions are met, it places an order to open a long or s

WYSIWYG Candle for WYSIWYG ORB Smart Breakout Candles is a professional multi-method breakout detection indicator that combines ATR, Bollinger Bands, Opening Range Breakout (ORB), and Squeeze Detection to identify high-probability breakout opportunities across all financial instruments. This indicator provides real-time visual signals through colored candles and precise arrow placements, making it ideal for traders seeking reliable volatility-based entries. "Use in conjunction with the WYS
FREE
Robofxea Pro - Automated Trading System for XAUUSD and BTCUSD Robofxea Pro is an automated trading system designed for XAUUSD (Gold) and BTCUSD (Bitcoin). The system uses a breakout strategy with pending orders and includes risk management features such as hard stop loss on every trade, news filtering, and spread protection. The system does not use martingale, grid, or averaging strategies. Live Trading Results View verified live account performance: Vantage Markets Live Account: https://www.mql

1. Introduction The CM_Ultimate_RSI_MTF is a powerful and versatile custom indicator for MetaTrader 5, designed to enhance your Relative Strength Index (RSI) analysis. It provides multi-timeframe (MTF) capabilities, visual signals, and customizable alerts, making it an invaluable tool for traders seeking to identify overbought/oversold conditions, trend strength, and potential entry/exit points across various timeframes. 2. Key Features Multi-Timeframe (MTF) Analysis: Allows you to view RSI from
FREE

Quant Panel Pro The Ultimate Multi-EA Performance Dashboard for Quantitative Traders Stop juggling multiple charts or external tools to monitor your algorithmic strategies! Quant Panel Pro delivers institutional-grade portfolio monitoring in one sleek, professional interface.
Key Features Quantitative Analytics at Your Fingertips Real-time P&L aggregation across all Expert Advisors Statistical win rate analysis with trade frequency metrics Advanced drawdown tracking (realized & unrealized

Double EMA Scalping EA – Clean Crossover with Reversal Logic This Expert Advisor uses a smart EMA crossover strategy across two different timeframes to enter trades with high precision. A trade is placed only when the fast EMA crosses the slow EMA , confirming short-term trend shifts. It also includes auto-reversal logic , price-based SL/TP , and an optional trailing stop system . Key Features: Multi-Timeframe EMA Crossover
Customizable EMA periods and timeframes for precise entry.
FREE

Introduction
Auto Chart Alert is a convenient tool to set alert for your trading in your chart. With Auto Chart Alert, you can set the alert line in one click in your desired location in your chart. You can even set alert over the sloped lines in your chart. Auto Chart Alert is a great tool when you have to watch out importnat support and resistance levels for your trading. You can receive the sound alert, email and push notification when the price hit the alert line at you desired location. Au
FREE

This is the Stargogs Volatility Arrow V1 Yeahhh!!! This Arrow is based on trend, support and demand and based on EMA's. You can change the parameters or settings like you want to. Message Me for the System which works best with this Indicator for free (include: Template, and other indicators). This indicator works with all Currency Pairs, All Volatility indices, All Indices, Boom & Crash Indices, Gold and NASDAQ. Works on All Timeframes Add the following to your chart with Stargogs Volatility A
FREE

The Simple ICT Concepts Indicator is a powerful tool designed to help traders apply the principles of the Inner Circle Trader (ICT) methodology. This indicator focuses on identifying key zones such as liquidity levels, support and resistance, and market structure, making it an invaluable asset for price action and smart money concept traders.
Key Features Market Structure: Market structure labels are constructed from price breaking a prior swing point. This allows a user to determine the curren

This indicator is a sophisticated MetaTrader 5 tool that calculates and displays Average Daily Range (ADR) levels on your chart. It draws horizontal lines representing expected price movement ranges based on historical daily volatility, helping traders identify potential daily high and low targets. ADR (Average Daily Range) = The average difference between the daily high and low over a specified period (default: 14 days). Unlike ATR which includes gaps between days, ADR focuses purely on int
FREE

Introduction Harmonic Patterns are best used to predict potential turning point. Traditionally, Harmonic Pattern was identified manually connecting peaks and troughs points in the chart. Manual harmonic pattern detection is painfully tedious and not suitable for everyone. You are often exposed under subjective pattern identification with manual pattern detection. To avoid these limitations, Harmonic Pattern Plus was designed to automate your harmonic pattern detection process. The functionality

IMPORTANT — READ FIRST (MANDATORY) ️ IF YOU DO NOT SEE YOUR PAIR LISTED BELOW — DO NOT TRADE IT
Pairs not listed score low for this EA and will reduce performance. PLEASE READ AND FOLLOW THE GUIDE BELOW This EA is NOT plug-and-play and NOT designed to run 24/5 .
Incorrect session usage WILL degrade performance . NOT A 24/5 EA — SESSION-BASED ONLY TrendSeeker FX is a session-based, institutional-style Forex Expert Advisor . Running it all day or during low-liquidity periods will: Reduce
FREE
The EA uses a scalping strategy on a breakout, uses innovative advanced technologies using a Neural Network. To create the EA , we used the latest advanced algorithms to find the best moments to enter the market. The EA uses many smart filters to adapt to almost any economic situation. The EA sets a protective stop order, so the trader does not have to worry that the robot will allow significant drawdowns. The adviser is safe and does not require any settings from the user, just install it on th

Kanunay Expert Advisor
Overview Kanunay is a MetaTrader 5 Expert Advisor designed for automated forex trading. It combines the Kwiatkowski-Phillips-Schmidt-Shin (KPSS) test for stationarity with the Relative Strength Index (RSI) to generate trading signals. The EA is designed to open trades during specific hours and uses a set of conditions to determine entry points.
Key Features 1. KPSS-RSI Combination: Uses KPSS for trend identification and RSI for overbought/oversold conditions. 2. Time-Ba
FREE
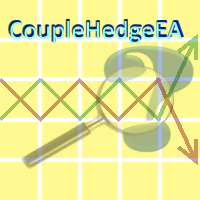
It's a two (2) pairs correlation system to use 3 currencies to make 2 pairs to open hedge orders on those.
The expert starts opening four orders for each couple (2 plus and 2 minus) and wait to move prices in one direction to make a grid of orders.
The expert can use a maximum of 5 currencies to make 10 pairs and make 30 couples.
It is important the order of currencies is from the strongest to the weakest.
Strongest... EUR/GBP/AUD/NZD/USD/CAD/CHF/JPY ...weakest.
Canto inputs minimum of thr
FREE
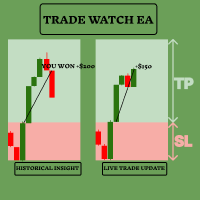
TradeWatch EAで取引戦略を強化しましょう TradeWatch EAは、リアルタイムの情報と取引コントロールを提供する強力なツールで、取引プロセスを簡素化し、リスク管理を改善します。 主な特徴: 取引の視覚化: グラフ上にストップロスとテイクプロフィットのレベルを直接表示します。 視覚的な表示により、迅速な意思決定とより良いリスク管理が可能です。 ポジションインデックス: ポジションインデックス番号を設定することで特定のポジションを監視できます(インデックスは0から始まります)。 複数の取引を同時に扱う際に非常に便利な機能です。 包括的な取引概要: すべての取引および履歴データを単一のグラフで表示します。 詳細な取引情報への簡単なアクセスにより、過去のパフォーマンスの分析と将来の戦略計画が容易になります。 リアルタイムの利益と損失の追跡: 取引の利益や損失に関する即時のフィードバックを提供します。 利益を最大化し、損失を最小化するためのタイムリーな意思決定をサポートします。 ユーザーフレンドリーなインターフェース: シンプルで直感的なデザインにより、すべての経験レベルのトレ
FREE

This universal Expert Advisor is equally good for both scalping and conservative multi-currency trading of simultaneous trading of several pairs. This Expert Advisor is based on its own Algorithm, which is an incredibly effective tool due to the simultaneous operation of a trading strategy based on our Centered Bands Indicator and our proprietary signal filter system together with the Martingale method, which together work out a very interesting hedging system. Traders are also given the

キャンドルボットのご紹介 - ローソク足パターンを認識しトレードするための究極の無料ツール!キャンドルボットを使用して、簡単に高値と低値の両方に認識できる牛さんと熊さんのエングルフィング、モーニングスター、イブニングスター、そしてハンマーシグナルを活かし、市場で優位性を得ましょう。特定の期間にわたる始値、高値、安値、終値から導き出されたローソク足パターンは、価格動向の視覚的な表現となり、トレーダーが市場センチメントを分析し、潜在的な逆転や継続を予測するのに役立ちます。 ローソク足パターンの理解: エングルフィングパターン: 二つのローソク足から成り立ち、二つ目のローソクが完全に最初のものを覆います。ベアッシュエングルフィングは下降トレンドの終わりにおいて上昇トレンドの反転の可能性を示し、ブルッシュエングルフィングは上昇トレンドの終わりにおいて下降トレンドの反転の可能性を示唆します。エングルフィングキャンドルの本体が大きいほど、そのシグナルは強力です。 ハンマーパターン: 一本のローソク足で、本体が上部近くに小さく、下部に長い尾を持つハンマーのような形です。ブルッシュハンマーは下降トレン
FREE
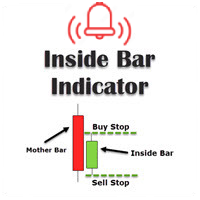
This inside bar indicator MT5 is suitable if you are doing inside bar trading. So what this MT5 inside bar indicator does is identifies inside bars for you as they form on your charts. Inside bar is a famous trading pattern in which the bar carry higher low and lower high compared with the previous bar, also known as mother bar. With, a lesser time frame like the 1 hour chart, daily inside bar chart will sometimes appears to be similar to a triangle pattern.
Inputs Settings for MA; AlertOn
FREE

EMLU Precision AI — Free Demonstration Version for MT5 Type: Expert Advisor (MT5) ️ Important Notice (Read Before Downloading) This Free version of EMLU Precision AI is designed strictly for demonstration, research, structural inspection, and interface familiarisation . It does not represent the behaviour, logic depth, live signals, or performance results of the full paid version. Performance, trade frequency, and result quality are intentionally reduced to prevent misuse of the free edition as
FREE

Revialon – The Art of Adaptive Trading Like a masterful composer shaping a symphony, Revialon lets you orchestrate the market’s rhythm with precision and control. Fueled by ATR-driven volatility analysis and the timing precision of the Stochastic Oscillator , it provides a dynamic framework where you set the rules, refine the execution, and optimize the outcome . Shape Your Trading Masterpiece: Fully Customizable Strategy – Every setting is in your hands, allowing you to build a trading sys
FREE

Strifor Pivot + ATR Target
Pivot Levels Indicator with ATR-Based Targets and Analytics Panel
for MetaTrader 5 Strifor Pivot + ATR Target is a tool for intraday and medium-term trading that combines classic pivot levels with dynamic ATR targets and an informational analytics panel. The indicator helps you assess the trading range in advance, identify likely price reaction zones, and estimate movement potential — eliminating manual calculations and subjective assumptions. Key Features Automatic c
FREE

BreakHarmony Multi-Timeframe Breakout Indicator for MT5
The BreakHarmony Multi-Timeframe Breakout Indicator for MT5 is a highly advanced tool providing information on breakout points across different timeframes, aiding traders in decision-making and understanding market movements. [ Features and Manual | MT4 version | All Products ] The indicator tracks breakout points on price charts across 6 timeframes. Breakout prices are indicated with the closing price of the correspondi
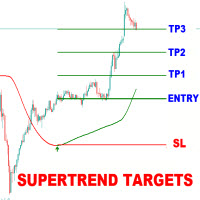
Supertrend Targets Signal is a powerful trend-following and breakout confirmation indicator designed to help traders identify high-probability entry points , visualize dynamic target zones , and receive clean, reliable signals across various market conditions. The core trend logic is built on a custom Supertrend that uses an ATR-based band structure with long smoothing chains—first through a WMA, then an EMA—allowing the trend line to respond to major shifts while ignoring noise. A key addition

インジケーターは任意のポイントから出来高を分析し、その出来高に対する市場のエグゾースト(疲労)レベルを計算します。 Meravith の主なライン: 強気出来高エグゾーストライン – 目標として機能します。 弱気出来高エグゾーストライン – 目標として機能します。 トレンドライン – 市場のトレンドを示します。市場が強気か弱気かに応じて色が変化し、トレンドサポートとして機能します。 使い方: 紫色の縦線をダブルクリックし、希望の位置に移動してください。 トレンドや調整など、あらゆるものを分析できます。インジケーターを市場の上部、下部、または重要と考える任意のポイントに移動します。良い方法は、市場がエグゾーストラインの間に位置するように Meravith を設定することです。こうすることで、追跡できる明確な目標を持つことができます。
初期のエグゾーストラインがブレイクされた場合、新しいエグゾーストラインが出現し、追加の取引可能なチャネルが形成されます。 エグゾーストに到達した後は、インジケーターの位置を変更するか、別の時間枠に切り替えて新しいエグゾーストレベルを特定できます。 トレンドラ

GBPUSD Trading Robot for H1 Chart Pound Swing は、GBPUSD 通貨ペアの H1 時間足取引に特化して設計された高精度のエキスパートアドバイザーであり、最もボラティリティが高くアクティブなロンドン市場に特化しています。
急速に変化する相場環境での取引に最適化された設計で、Pound Swing はロンドン時間に特有のハーモニックキャンドルパターンを認識する専用アルゴリズムを搭載しています。これらのパターンは、時間帯内で繰り返し出現する高確率なエントリーシグナルを狙うために調整されています。
Pound Swing のコアロジックは、セッション特有のボラティリティと日中のモメンタム変化への柔軟な対応力にあります。これにより、精密なタイミングでの強いトレンドの動きを捉えることが可能です。
このシステムは市場の動きを継続的に分析し、GBPUSD に特有のその時間帯の市場状況に基づいて取引を調整します。
セッション中のブレイクアウトやハーモニックリズムに基づくスイングエントリーなど、Pound Swing はテクニカルに基づいた、セッション最適化型

Market Heartbeat is in your hand! *** Contact me to send you " Trend Finder indicator " free and add you in "Market Heartbeats group" for sharing or seeing experiences with other users. Introduction The Market Heartbeat indicator with a special enhanced algorithm (volume, money flow, cycle of market and a secret value) is a very repetitive trend finder with a high success rate . Interestingly, this Winner indicator indicates that the trend has changed its direction or the end of a tre

This is a multi timeframe version of the Supply and Demand indicator . It allows you to analyze a chart using the law of supply and demand on three different timeframes at a time. You will see zones of sales and purchases and determine the most profitable points to open positions. The indicator is based on the principle of market fractality. Supply and demand zones show places where a strong buyer or seller has made the price reverse and change its direction. The indicator has several types of
FREE

The indicator displays volume clusters or volume profiles to choose from. For trading symbols which contain the tape of deals, the indicator can perform calculations based on the tape of deals.
Input variables
StepPoint - cluster step in points, if the value is zero, the step is assigned automatically. HistoryTicks - size of tick history (for VolumeType in the mode TimeAndSales). AssociatedTimeframe - binding the indicator to the specified timeframe of the chart, if the value is equal to Cu

Trading Exporter for AI Assistant Trading Exporter for AI Assistant は、MetaTrader 5 用のプロフェッショナルなインジケーターで、完全で構造化された取引データを JSON 形式でエクスポートするように設計されています。その目的は、ChatGPT、Gemini、Copilot、Claude、DeepSeek などの無料または有料のAIアシスタントが、その情報を分析し、パーソナライズされた推奨事項、戦略、および説明を提供できるようにすることです。 特別な推奨事項: DeepSeek このエクスポーターはあらゆるAIで機能しますが、いくつかの理由から DeepSeek の使用を特に推奨 します。 拡張されたコンテキスト能力 : インジケーターがエクスポートする大量のデータを処理するのに理想的です。 ネイティブな多言語サポート : 含まれている7つの言語と完全に互換性があります。 高度なテクニカル分析 : テクニカルパターンとインジケーターを解釈する優れた能力。 効率的な JSON 処理 : 複雑なデータ構造を扱うた
FREE

EMA Multi Timeframe (MTF) – MT5 Indicator Description: The EMA Multi Timeframe (MTF) indicator for MT5 allows you to display an Exponential Moving Average (EMA) from a higher (or lower) timeframe directly on your current chart. Example: You can see the Daily (D1) EMA 9 plotted directly on your H1 chart, or even on an M5 chart, helping you align your entries with higher timeframe trends without switching between charts. Key Features: Display EMA from selectable timeframes (M1, M5, M15, M30, H1
FREE

Signal provider based on RSI Divergences
from a higher timeframe.
First 3 buffers export a signal.
Timeframe for which divergences are detected is optional, see
'RSI divergences timeframe' parameter.
The indicator uses different algorithms for divergences detection:
'Fast' algorithm is the simplest solution that works the fastest.
'Strict' algorithm filters out more noise but works slower than the previous one.
'Full' algorithm uses recursive functions and provides with lots of divergences
FREE

This indicators automatically draws the support and resistances levels (key levels) for you once you've dropped it on a chart. It reduces the hustle of drawing and redrawing these levels every time you analyse prices on a chart. With it, all you have to do is drop it on a chart, adjust the settings to your liking and let the indicator do the rest.
But wait, it gets better; the indicator is absolutely free! For more information: https://youtu.be/rTxbPOBu3nY For more free stuff visit: https:
FREE
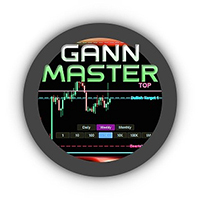
伝説のウィリアム・ギャン(William Gann)レベルを完全自動で表示するMT5用インジケーター。GANN Masterは日足・週足・月足のデータに基づき、価格が反転またはトレンド継続しやすい重要ゾーンを瞬時にプロットします。 主な機能 ワンクリック期間選択 :Daily/Weekly/Monthlyボタンをクリックするだけで、当日・当週・当月のゾーンを即時表示 自動&手動モード 自動モード :GANN Masterがスイング高値・安値を自動検出し、すべてのギャンレベルを計算 手動モード :チャート上のTopラインとBottomラインをドラッグして任意のスイングポイントを設定、レベルが即座に再計算 強気/弱気レベル :買い/売りそれぞれのレベルを表示。線が接近すると強固なサポート/レジスタンスゾーンを示唆 幅広い銘柄対応 :Forex、貴金属(例:ゴールド)、株価指数、暗号資産など高額商品にも対応。設定でアセットクラスを切り替えるだけでスケールと乗数が自動調整 ユーザーフレンドリーなインターフェース :鮮やかな配色、見やすいラベル、直感的なボタン操作でリアルタイムにレベルを調整 ト
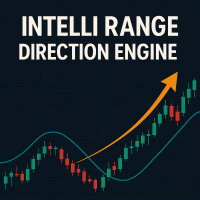
Intelli Range Direction Engine — Intelligent Range & Trend Strategy
Note: An extended version with all features and inputs as showed in the screenshot is available. Please test and optimize the settings according to your own trading preferences.
The default parameters are based on my personal Nasdaq setups and may not be optimal for every symbol.
I do not provide financial advice or profit guarantees – all results shown are for technical demonstration purposes only. Note: All screenshots sh
FREE

For feedback, free connect to signal, PARTNER PROGRAM and detailed information : Facebook Welcome to the "Breakeven Line" indicator, version 1.1, developed by Sergei Ivanov in 2025. Visualize breakeven price levels for your trades with precision and ease. Advisor Description The "Breakeven Line" is a MetaTrader (MQL5) indicator that displays breakeven price levels for open buy and sell positions on the current symbol, factoring in commissions and swaps for accurate risk management. Key
FREE
Important: The price will increase to 150$ after 8 more purchases Every buyer of this indicator also receives for free: The exclusive Signal Reacter EA, which automatically executes every Signal a step-by-step guide to help you install the Signal Capturer Note: To claim your free EA, just send me a quick message on MQL5.
I present to you the original, self-developed tool that grabs premium signals from top services like the Divergence Bomber, Algo Pumping and Grabber System.
An instructional

Overview: Golden Buzzer MT5 is a powerful two-in-one Expert Advisor designed exclusively for trading XAUUSD (Gold) on the MetaTrader 5 platform. It operates using two distinct strategies — Strategy 1 and Strategy 2 — both based on similar trading principles but with slightly different logic for trade execution. Users can choose to run either strategy independently or both simultaneously , offering flexibility and strategic diversity. Main Features: Specifically built for Gold (XAUUSD) trading D
FREE

SMC Venom Model BPR インジケーターは、スマート マネー (SMC) コンセプトで取引するトレーダー向けのプロフェッショナル ツールです。価格チャート上の 2 つの主要なパターンを自動的に識別します。 FVG (フェアバリューギャップ) は、3 本のローソク足の組み合わせで、最初のローソク足と 3 番目のローソク足の間にギャップがあります。ボリュームサポートのないレベル間のゾーンを形成し、価格修正につながることがよくあります。 BPR (バランス価格範囲) は、2 つの FVG パターンの組み合わせで、「ブリッジ」を形成します。これは、価格がボリュームアクティビティの少ない動きで動くときに、ブレイクアウトしてレベルに戻るゾーンで、ローソク足の間にギャップを作成します。
これらのパターンは、大規模な市場プレーヤーと一般参加者の相互作用が発生するチャート上のボリュームと価格動向の分析に基づいて、トレーダーが主要なサポート/レジスタンス レベル、ブレイクアウト ゾーン、エントリ ポイントを識別するのに役立ちます。 インジケーターは、長方形と矢印の形でパターンを視覚

FREE Prop Firm Navigator EA - Advanced Trend-Following & Protection Developed by the EA Trading Academy team using Expert Advisor Studio , this free trading robot combines powerful trend-following indicators with a robust set of account protection features to secure your trading capital. You can find a detailed documentation about the properties and inputs on our knowledge base . Key Strategy Features: Uses Bulls Power and Awesome Oscillator indicators for precise entry signals Sophisticat
FREE

The Stochastic RSI (StochRSI) is a technical indicator that combines the characteristics of the Relative Strength Index (RSI) with the Stochastic Oscillator, resulting in a more sensitive tool that generates a higher number of trading signals. Developed by Tushar Chande and Stanley Kroll, the indicator was designed to overcome a perceived limitation of the traditional RSI: the low frequency of overbought and oversold levels activation (commonly 80 and 20), especially in less volatile assets. Ho
FREE

Revolution Martingale is an indicator designed for trading binary options on the M5 timeframe. Features: M5 Timeframe: It is recommended to use the indicator on the M5 timeframe for optimal trading. Trade Entry: Trades should only be opened on the first candle after a signal appears. Signals: A blue diamond indicates a buying opportunity for upward movement, while a red diamond indicates a buying opportunity for downward movement. Configured for Effective Binary Options Trading: The indicator i
FREE

News Scalper EA is an Expert Advisor for trading EURUSD - GBPUSD - XAUUSD pairs, positioning your positions during the news. Developed by an experienced trader with over 17 years of trading experience. News Scalper EA uses a news calendar from MQL5 and trades according to them. With sophisticated strategy and risk management, the EA protects your positions from larger losses! News Scalper EA lets you close the SL after the set time (1 minute, planned) when the position is in minus, which proves
FREE

Transform Your Manual Trading with the Best Free Order Ticket for MT5! Tired of the default MetaTrader ticket—slow and short on information? Trader Panel Grid Alpha is a professional-grade order panel built to give discretionary traders speed, control, and clarity. This free tool isn’t just another ticket; it’s a command station that puts your most important actions and data right on the chart, letting you focus on what really matters: your analysis. FREE VERSION FEATURES Lightning-Fast Execut
FREE

フェニックス・ドローダウンメーター (MT5)
MetaTrader 5 向けリアルタイムドローダウン監視ツール。チャート上にライブ口座のドローダウン率を表示し、トレーダーのリスク管理と口座制限超過回避を支援します。
目的
ドローダウンは、プロップファーム口座や厳格なリスク管理ポートフォリオを運用するトレーダーにとって最も重要なリスク指標です。ドローダウン制限を超過すると、口座が無効化されるか、数週間の進捗が帳消しになる可能性があります。
フェニックス・ドローダウンメーターは、ブローカーサーバーの純資産と残高データに基づき、現在のドローダウンを常時可視化します。価格とポジションの変動に応じてメーターは自動更新されるため、トレーダーは制限超過前に早期対応し、エクスポージャーを低減できます。
インストール
MQL5マーケットからダウンロードし、任意のチャートに添付してください。メーターは即時表示され、設定は不要です。
動作環境
MetaTrader 5 ビルド3280以降。チャート上で実行するEA(エキスパートアドバイザー)です。ライブ残高データを使用し、現在の口座のドロー
FREE
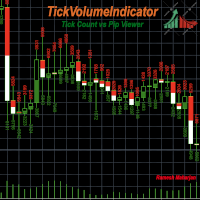
チャート上のトレンドを識別するための様々なインジケーターと手法があります。TickVolumeIndicatorもその一つです。ティックデータを用いて過去のトレンドを表示することで、将来のトレンドを特定し予測するのに役立ちます。
TickVolumeIndicatorは、ティックボリュームを用いてチャート上の表示可能なローソク足に色を描画するインジケーターです。ティックボリュームとは、ビッド値とアスク値です。ユーザーは、ローソク足の時間枠におけるビッド数とアスク数、またはピップの変化を選択できます。アスク数は、アスク値が前回のアスク値よりも大きい場合に加算され、ビッド数は、ビッド値が前回のビッド値よりも小さい場合に加算されます。これらは両方ともローソク足の高さに正規化されてチャートに表示されます。ピップの変化も同様に計算されます。
ユーザーには以下のオプションがあります。
1) アスク色:アスク値の色として、赤、緑、青、紫、黄、シアン、紫、茶、オレンジ、ピンク、白、なしから選択できます。デフォルトは緑です。
2) 入札色: 入札値の色として、赤、緑、青、紫、黄色、シアン、紫、
FREE
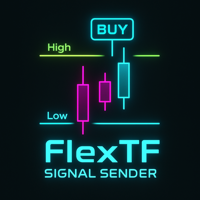
FlexTF Signal Sender — Multi-Timeframe High/Low Touch Confirmation Indicator Official Channel Updates, tools and documentation: Open official MQL5 channel Overview FlexTF Signal Sender is a multi-timeframe High/Low confirmation indicator designed for clean and structured signal generation. It reads High and Low from a higher timeframe (H1/H4/D1), monitors price interactions, and confirms BUY/SELL signals using candle-close logic on a lower timeframe (M5/M15/M30). The indicator includes adva
FREE
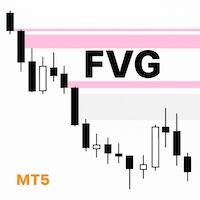
What Makes UTurn FVG indicator Unique I’m a trader, and I built a simple and clean FVG indicator that focuses on what traders actually need. Flexible color and transparency settings. The option to extend unmitigated and partially mitigated FVGs to the current price. Automatic removal of fully mitigated FVGs. Clear visual confirmation when an FVG has already been tested. A clean, professional look that helps traders make faster, more confident decisions. Overview UTurn FVG is a clean, efficient,
FREE

Candle Countdown Pro – Real-Time Timeframe & Spread Tracker Love it? Hate it? Let me know in a review! Feature requests and ideas for new tools are highly appreciated. :) Try "The AUDCAD Trader":
https://www.mql5.com/en/market/product/151841 Never miss a candle close again! Candle Countdown Pro is an essential trading tool that displays real-time countdowns for multiple timeframes,
live spread monitoring , and key trading information—all in one clean, customizable panel.
Key Features:
FREE
Special offer : ALL TOOLS , just $35 each! New tools will be $30 for the first week or the first 3 purchases ! Trading Tools Channel on MQL5 : Join my MQL5 channel to update the latest news from me Kalman Trend Levels は、先進的なカーマンフィルター技術を活用し、トレーダーに強力な分析信号を提供する高度なトレンド追従インジケーターです。正確さと適応性を追求したこのツールは、重要なサポートおよびレジスタンスゾーンを特定するだけでなく、市場のモメンタムやトレンド変化を包括的に分析する手法を提供します。 MT4バージョンはこちら: Kalman Trend Levels MT4 その他の製品はこちら: All Products See more detailed explanation of Kalman Filter logic in this

The Wave Scalper EA is fully automated scalping system that uses price action to identify good scalping trades and executes them with an invisible trailing stop loss. It also includes a money management feature which calculates lot size based on account size and risk with an option to set a maximum draw down at which the EA will stop trading. This is a long term strategy combined with money management which works well on most pairs, but predominantly GBPUSD, USDCAD, EURUSD, AUDUSD & USDJPY. Plea
FREE

このユーティリティは、経済ニュースをチャート上に直接表示します。今後のイベント、発表までの時間、重要性を表示し、通知を送信します。
対象:
経済ニュースをフォローしているトレーダー
ニュースに基づいて取引するトレーダー
タイムリーなアラートを受け取りたいトレーダー
チャート上でシンプルで直感的なカレンダーを必要とするユーザー
主な機能 ニュースパネル - 直近の経済イベントをチャート上に表示します
通貨フィルター - 取引銘柄の通貨のニュースのみを表示します
アラート - ニュースリリースの指定時間前に通知します
プッシュ通知 - MetaTraderモバイルデバイスに通知を送信します
サウンドアラート - カスタマイズ可能なサウンドアラート
カラーインジケーター - 重要度と緊急度を視覚的に表示します
設定 AlertMinutesBefore - イベントの何分前にアラートを送信するか
MinImportance - アラートの最小重要度
FilterByCurrency - 現在のシンボルの通貨でニュースをフィルタリングします
EnableSoun
FREE

Ultimate Candle Countdown – もう二度とローソク足のクローズを見逃さない! Ultimate Candle Countdown でトレード精度を次のレベルへ。あらゆる時間足と銘柄に対応した、シンプルで軽量かつ強力なローソク足カウントダウンタイマーです。
M1でスキャルピング、H1でスイングトレード、あるいは日足/週足のクローズを監視していても、このツールがあれば次のローソク足が始まるまでの残り時間を正確に把握できます。推測はもう不要 – 常に鋭く、常に一歩先へ。 主な機能 すべての時間足に対応 – 1分足から月足まで、信頼性と精度を両立。 視覚的なカウントダウン – hh:mm:ss 形式で残り時間を表示、毎秒スムーズに更新。 カラーアラート – 通常・警告・クリティカルの色をカスタマイズ可能。残り時間が少ないことを瞬時に認識。 オプションの進行率表示 – ローソク足の進行度を一目で確認。 プログレスバー – カウントダウンの下に表示されるシンプルなバー。 時間足ラベル – 監視しているチャートの時間足を常に明示。 スマート配置 – 最新のローソ
FREE
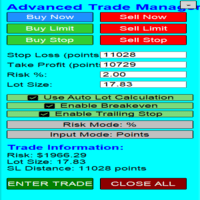
Overview Are you tired of complex manual calculations, emotional execution errors, and the constant fear of risking too much? The Advanced Trade Manager (ATM) is your all-in-one solution, a professional-grade Expert Advisor for MetaTrader 5 designed to give you institutional-level control over every aspect of your trade. From flawless risk calculation to intelligent, one-click execution, the ATM EA streamlines your entire trading process, allowing you to focus on your strategy, not the mechanics
FREE

RSI Momentum Shift Detector - Momentum Change Indicator Maximize your accuracy: Divergences are powerful, but they are even stronger when combined with professional volume analysis. If you like the logic behind this indicator, you will love the Volume Structure Nexus , which identifies where the big players are entering. For fast-paced traders, pair these divergences with Accuracy M1 Scalper to catch explosive moves in lower timeframes.
RSI Momentum Shift Detector is a technical indicator desi
FREE

ENGLISH DESCRIPTION (Standard MQL5 Optimized) Product Name: Quantum Howl Seraph [Subtitle: Donchian Breakout | MFI Volume Filter | Time-Decay Exit] Introduction Price is the vehicle, but Volume is the fuel. Most breakout strategies fail because they trade on "empty tanks"—price moves without volume support. Quantum Howl Seraph is an advanced algorithmic trading system designed to capture high-probability volatility explosions by combining Price Compression (Donchian) with Money Flow analysis (MF
FREE
RSI Bollinger DualStrike Signals offers a clear and structured approach to identifying areas that may be favorable for potential trend reversals. By combining the RSI with Bollinger Bands, the indicator highlights moments when price shows signs of pressure or loss of momentum. The BUY/SELL signals help traders make more organized and disciplined decisions. It is a useful tool for scalping, day trading, or swing trading not to predict the market, but to improve the reading and understanding of pr
FREE

The Candle Countdown Timer for MetaTrader 4 (also available for MT5) is a vital indicator designed to help you manage your trading time effectively. It keeps you updated about market open and close times by displaying the remaining time before the current candle closes and a new one forms. This powerful tool enables you to make well-informed trading decisions. Key Features: Asia Range: Comes with an option to extend the range. Broker Time, New York, London Time: Displays the current broker time
FREE
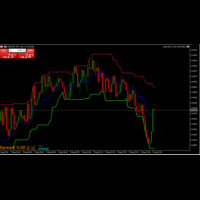
The Donchian Channel Indicator I created is a powerful tool for analyzing price trends and volatility. By plotting the highest high and lowest low over a specified period, it helps identify potential breakout opportunities and trend reversals. This indicator is valuable for traders seeking to understand market dynamics and make informed decisions based on price movements. Its simplicity and effectiveness make it an essential addition to any trading strategy.
FREE
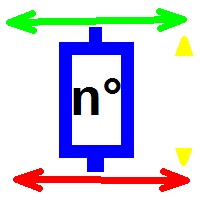
TradeSystem 取引する日にバーを選択します。このバーが閉じると、ロボットはろうそくの安値で2つの注文を送信し、もう1つはキャンセルされます StopLoss ストップは、買いの場合は安値より1ティック下、売りの場合は高値より1ティック上になります TakeProfit テイクはstopLossの範囲に必要な量を設定でき、戦略の最適化でコストをかけることができます 最適化 このロボットにはリスクリターンを取得するための入力があるため、メタトレードの戦略最適化で実行して、取引するシンボルの最適な入力を取得できます TradeSystem torihiki suru hi ni bā o sentaku shimasu. Kono bā ga tojiru to, robotto wa rōsoku no yasune de 2tsu no chūmon o sōshin shi, mō 1tsu wa kyanseru sa remasu StopLoss sutoppu wa,-gai no baai wa yasune yori 1 tikku-ka, uri no baai
FREE

The Expert Advisor is based on the signals of the Stochastic indicator in the overbought zone-we sell, in the oversold zone-we buy. Version for MT4 https://www.mql5.com/ru/market/product/62952 Monitoring the work of the adviser MT4 https://www.mql5.com/ru/signals/1178019 MT5 https://www.mql5.com/ru/signals/1178043 If the Expert Advisor is used in 5/24 mode on a VPS, I recommend using this Expert Advisor in a conservative mode, limiting the number of orders in the grid using the " Count_Order
FREE

Support Resistance Indicator The "Support Resistance" indicator is a versatile tool designed to help traders identify key support and resistance levels based on an underlying algorithm. These levels indicate price points where an asset historically experiences buying (support) or selling (resistance) pressure. The indicator allows traders to visualize these levels on their charts, making it easier to make informed decisions. All Products | Contact PARAMETERS: Timeframe :
Users can select the
FREE
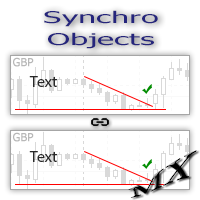
The SynchroObjects utility is designed to facilitate and speed up the work with graphic constructions on different charts of one symbol. The SynchroObjects utility clones the created objects to all charts on which the utility is running and which have the same symbol. And also synchronously changes their properties. The utility is easy to use and requires no configuration. Tip: If you view the history frequently - we also recommend you to also install the free Smart AutoScroll utility. It automa
FREE

Gold Spot Pending Buy Advanced
Gold Spot Pending Buy Advanced is a fully automated trading solution designed specifically for XAUUSD (Gold) . The system utilizes a trend-following strategy based on EMA crossovers combined with a pending order execution model to minimize slippage and confirm market momentum. Strategy Logic The EA monitors the 10-period and 60-period Exponential Moving Averages (EMA) to identify trend direction. Instead of entering immediately at market price, the EA places B
FREE
Stop guessing where the market will turn. Our advanced High/Low Indicator for MT5 is the ultimate tool for mastering price action and identifying key market structure. It automatically scans the chart to identify and clearly plot all critical swing highs and lows in real-time, helping you see the true story behind the candles. These crucial, non-repainting levels form the backbone of any successful trading strategy. Use them to instantly visualize the market's framework, allowing you to pinpoint
FREE

The Forex Breakout Scalping EA follows a scalping breakout strategy. It trades the breakouts from relative highs and lows. For the entry stop orders are used for the fastest possible execution. Profits can be secured by the adjustable trailing stop .This is also a high frequency breakout trading system. It produces high return if compounded properly with high speen internet and low commission. Since the strategy works with small average profits it is highly suggested to trade with a low spread a
FREE

Mahdad Candle Timer は軽量かつ高精度な MetaTrader 5 用インジケーターで、現在のローソク足がクローズするまでの残り時間を、最新のバーのすぐ横に表示します。スキャルピング、デイトレード、あるいはスイングトレードでローソク足の確定を待つトレーダーなど、正確なタイミングを重視する方に最適です。 主な機能 正確なカウントダウン – 残り時間を HH:MM:SS 形式で表示(ミリ秒もオプションで対応) ダイナミックな配置 – ズームやスケールに関係なく常に最新ローソク足に揃えて表示 スマートなカラー適応 – 背景色やローソク足の方向(上昇/下降)に応じて自動的に文字色を調整 カスタムアラート – ローソク足クローズの数秒前にサウンドまたはポップアップで通知 完全カスタマイズ可能 – フォント、サイズ、色、更新速度、アラーム設定を自由に調整可能 軽量で効率的 – CPU使用率は最小限、他のインジケーターやEAに干渉しない設計 ️ 入力パラメータ Show Milliseconds (true/false) Update Interval (ms) Bull
FREE
MetaTraderプラットフォームのためのアプリのストアであるMetaTraderアプリストアで自動売買ロボットを購入する方法をご覧ください。
MQL5.community支払いシステムでは、PayPalや銀行カードおよび人気の支払いシステムを通してトランザクションをすることができます。ご満足いただけるように購入前に自動売買ロボットをテストすることを強くお勧めします。
取引の機会を逃しています。
- 無料取引アプリ
- 8千を超えるシグナルをコピー
- 金融ニュースで金融マーケットを探索
新規登録
ログイン