Dail Session Open Lines

4.4

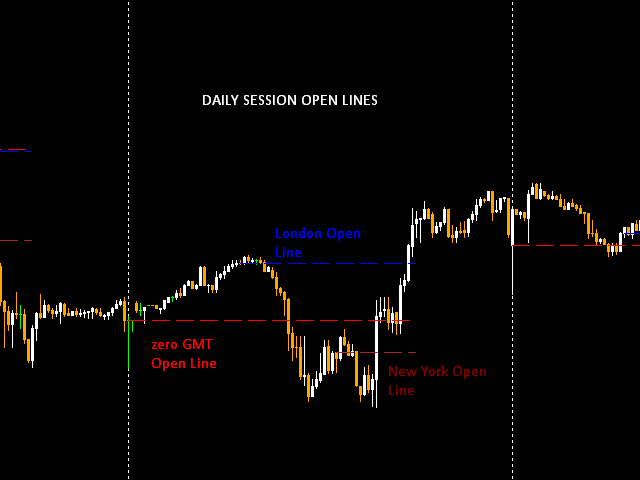
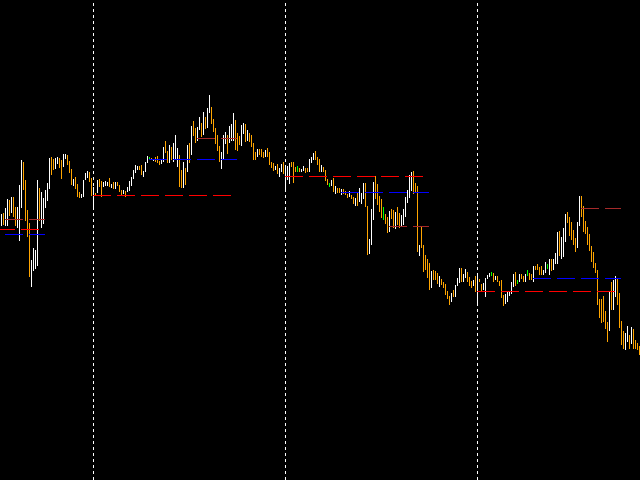
Daily session open lines shows the traders three important trading session opens. By default it is set up to show you:

  • Zero GMT Open Line
  • London Open Session Line
  • New York Open Session Line

The default times are set according to GMT+2 and as such you are able to change and customise according to your specific time zone.

The Indicator is usefull specially for the trader who trades the London and NewYork sessions.

レビュー 13
GermanPotato
724
GermanPotato 2025.06.10 19:43 
 

Very good... All indicators are usefull... Thanks...

Pablo88888
200
Pablo88888 2023.10.19 21:20 
 

Muy práctico, gracias

3551535
71
3551535 2023.06.13 09:21 
 

very useful

おすすめのプロダクト
FlatBreakout MT5 (Free Version) Flat Range Detector and Breakout Panel for MT5 — GBPUSD Only FlatBreakout MT5   is the free version of the professional FlatBreakoutPro MT5 indicator, specially designed for flat (range) detection and breakout signals on the   GBPUSD   pair only. Perfect for traders who want to experience the unique fractal logic of FlatBreakout MT5 and test breakout signals on a live market without limitations. Who Is This Product For? For traders who prefer to trade breakout of
FREE
Important Lines
Terence Gronowski
4.87 (23)
This indicator displays Pivot-Lines, preday high and low, preday close and the minimum and maximum of the previous hour. You just have to put this single indicator to the chart to have all these important lines, no need to setup many single indicators. Why certain lines are important Preday high and low : These are watched by traders who trade in a daily chart. Very often, if price climbs over or falls under a preday low/high there is an acceleration in buying/selling. It is a breakout out of a
FREE
The Zigzag Price Arrow indicator is an enhanced version of the classic Zigzag indicator, combining the traditional zigzag pattern with advanced visual features. It not only identifies major market turning points but also provides clear trading signals through: • Directional arrows: Displays colored arrows (green for buy, magenta for sell) indicating potential trend directions. • Price labels: Shows the exact price values at each pivot point directly on the chart. • Improved visual clarity: Make
FREE
Daily Support and Resistance Levels は、クラシックピボットポイント手法に基づき、日中取引用の重要な価格レベルを自動計算・表示するプロ仕様のインジケーターです。 主な機能: ピボットポイント(PP)の自動計算 3つのレジスタンスレベル(R1, R2, R3) 3つのサポートレベル(S1, S2, S3) 前日の高値/安値の表示 リアルタイム情報パネル 市場バイアス(強気/弱気)表示 近いレベルまでの距離表示 色と表示設定の完全カスタマイズ 毎日自動更新 全タイムフレーム対応 計算方法: 前日の高値、安値、終値に基づくクラシックピボットポイント。 トレード活用例: サポート/レジスタンス反発トレード ブレイクアウト戦略 レンジトレード 方向性バイアス判断 利確目標設定 使用方法: 任意のチャートに追加 レベルは自動計算 価格 > PP = 強気バイアス 価格 < PP = 弱気バイアス S1-S3 = サポートゾーン R1-R3 = レジスタンスゾーン 設定: ピボット/サポート/レジスタンス色 線幅/スタイル 価格ラベル表示ON/OFF 情報パネル表示
FREE
Free automatic Fibonacci is an indicator that automatically plots a Fibonacci retracement based on the number of bars you select on the BarsToScan setting in the indicator. The Fibonacci is automatically updated in real time as new highest and lowest values appears amongst the selected bars. You can select which level values to be displayed in the indicator settings. You can also select the color of the levels thus enabling the trader to be able to attach the indicator several times with differe
FREE
The Penta-O is a 6-point retracement harmonacci pattern which usually precedes big market movements. Penta-O patterns can expand and repaint quite a bit. To make things easier this indicator implements a twist: it waits for a donchian breakout in the right direction before signaling the trade. The end result is an otherwise repainting indicator with a very reliable trading signal. The donchian breakout period is entered as an input. [ Installation Guide | Update Guide | Troubleshooting | FAQ | A
FREE
概要 このインジケーターは、クラシックな ドンチャンチャネル を強化したバージョンで、実践的なトレード機能を追加しています。 標準の3本線(上限、下限、中央線)に加え、 ブレイクアウト を検出し、チャート上に矢印で視覚的に表示します。また、チャートを見やすくするために、 現在のトレンド方向と逆側のラインのみを表示 します。 インジケーターの機能: 視覚的シグナル :ブレイクアウト時にカラフルな矢印を表示 自動通知 :ポップアップ、プッシュ通知、Eメール RSIフィルター :市場の相対的な強弱に基づいてシグナルを検証 カスタマイズ可能 :色、ラインの太さ、矢印コード、RSI閾値など 動作原理 ドンチャンチャネルは次のように計算します: 上限線 :直近N本のクローズ済みローソク足の最高値 下限線 :直近N本のクローズ済みローソク足の最安値 中央線 :最高値と最安値の平均値 上方ブレイクアウト は終値が上限線を超えたときに発生し、 下方ブレイクアウト は終値が下限線を下回ったときに発生します。 インジケーターは以下を行います: 3本のドンチャンラインを描画 方向転換後の最初のブレイクアウト
FREE
MACD Enhanced
Nikita Berdnikov
5 (3)
Introducing the MACD  Enhanced – an advanced MACD (Moving Average Convergence Divergence) indicator that provides traders with extended capabilities for trend and momentum analysis in financial markets. The indicator uses the difference between the fast and slow exponential moving averages to determine momentum, direction, and strength of the trend, creating clear visual signals for potential entry and exit points. Attention! To achieve the best results, it is recommended to adapt the indicator
FREE
Follow The Line MT5
Oliver Gideon Amofa Appiah
4.6 (35)
This indicator obeys the popular maxim that: "THE TREND IS YOUR FRIEND" It paints a GREEN line for BUY and also paints a RED line for SELL. (you can change the colors). It gives alarms and alerts of all kinds. IT DOES NOT REPAINT and can be used for all currency pairs and timeframes. Yes, as easy and simple as that. Even a newbie can use it to make great and reliable trades. NB: For best results, get my other premium indicators for more powerful and reliable signals. Get them here: https://www.m
FREE
Easy Correlations Indicator The Easy Correlations Indicator is designed to help traders analyze the relationship between two correlated instruments. By monitoring the distance between their Relative Strength Index (RSI) values, the indicator highlights situations where one instrument has moved significantly further than the other. This creates potential trading opportunities: Sell the stronger instrument (overstretched RSI) Buy the weaker instrument (lagging RSI) Because the positions are opened
FREE
「Haven Key Levels PDH PDL」   インジケーターは、トレーダーがチャート上の主要なレベルを視覚化するのに役立ちます。次のレベルを自動的にマークします: DO (Daily Open)   — 日足の始値。 NYM (New York Midnight)   — ニューヨーク時間の深夜0時のレベル。 PDH (Previous Day High)   — 前日の高値。 PDL (Previous Day Low)   — 前日の安値。 WO (Weekly Open)   — 週足の始値。 MO (Monthly Open)   — 月足の始値。 PWH (Previous Week High)   — 前週の高値。 PWL (Previous Week Low)   — 前週の安値。 CMH (Current Month High)   — 当月の高値。 CML (Current Month Low)   — 当月の安値。 PMH (Previous Month High)   — 前月の高値。 PML (Previous Month Low)   — 前月の
FREE
Statistical Arbitrage Spread Generator for Cointegration [MT5] What is Pair Trading? Pair trading is a market-neutral strategy that looks to exploit the relative price movement between two correlated assets — instead of betting on the direction of the market. The idea? When two assets that usually move together diverge beyond a statistically significant threshold, one is likely mispriced. You sell the expensive one, buy the cheap one , and profit when they converge again. It’s a statistica
FREE
インジケーター   Haven FVG   は、市場を分析するためのツールで、チャート上で非効率性の領域(Fair Value Gaps、FVG)を特定することができ、トレーダーに価格分析と取引決定のための主要なレベルを提供します。 他の製品 ->  ココ 主な特徴: 個別のカラー設定: ブルFVGの色   (Bullish FVG Color)。 ベアFVGの色   (Bearish FVG Color)。 柔軟なFVGの視覚化: FVGを検索するための最大ローソク足数。 FVGゾーンの追加延長(特定のバー数)。 FVGの塗りつぶしを有効にするオプション。 中央線(Middle Line): 線の色とスタイルの選択(例:点線)。 線の太さの調整。 一般設定: FVGを現在のバーまで拡張。 塗りつぶしのある歴史的なFVGを除外し、最新のデータに焦点を当てる。 チャート上の非効率性の領域を分析し、根拠のある取引決定を行う簡単で効果的な方法。
FREE
RSI abcd
Francisco Gomes Da Silva
4 (2)
RSI ABCDパターンファインダー:テクニカル戦略 1. インジケーターの仕組み 古典的RSI と ABCD調和パターン の自動検出を組み合わせたものです。 主要コンポーネント 標準RSI (調整可能な期間) 高値・安値マーカー (矢印) ABCDパターン (緑/赤の線) 過買(70)・過売(30)フィルター 2. MT5設定 period = 14 ; // RSI期間 size = 4 ; // 最大パターンサイズ OverBought = 70 ; // 過買水準 OverSold = 30 ; // 過売水準 Filter = USE_FILTER_ YES ; // 確認フィルター 3. 取引戦略 3.1. 買いエントリー(強気ABCD) 条件: RSIが以下を形成: 谷( A )→ 山( B )→ より高い谷( C ) D が過売域(30)より上だが C より下 確認:A-B-C-Dを結ぶ緑色の線 目標: TP1: B-Cの61.8% TP2: B-Cの100% ストップロス: D より下 3.2. 売りエントリー(弱気ABCD) 条件: RSIが以下を形成: 山( A
FREE
ピボットポイントフィボRSJは、フィボナッチレートを使用してその日のサポートラインとレジスタンスラインを追跡するインジケーターです。 この壮大な指標は、フィボナッチレートを使用してピボットポイントを通じて最大7レベルのサポートとレジスタンスを作成します。 価格がこのサポートとレジスタンスの各レベルを尊重する方法は素晴らしいです。そこでは、オペレーションの可能な入口/出口ポイントを認識することができます。 特徴 最大7レベルのサポートと7レベルの抵抗 レベルの色を個別に設定します 入力 ピボットタイプ ピボットフィボRSJ1 =フィボ比1の計算 ピボットフィボRSJ2 =フィボ比2の計算 ピボットフィボRSJ3 =フィボ比3の計算 ピボットフィボクラシック=クラシックピボット計算 最小ピボットレベル ピボット3レベル ピボット4レベル ピボット5レベル ピボット6レベル ピボット7レベル それでも質問がある場合は、ダイレクトメッセージで私に連絡してください: https://www.mql5.com/ja/users/robsjunqueira/
FREE
Bounce Zone MT5
Nguyen Thanh Cong
4.56 (9)
Introduction The Bounce Zone indicator is a cutting-edge non-repainting technical tool built to identify key areas on the price chart where market sentiment is likely to cause a significant price reversal. Using advanced algorithms and historical price data analysis, this indicator pinpoints potential bounce zones. Combined with other entry signal, this indicator can help forex traders place the best trades possible Signal A possible buy signal is generated when price is in the green zone an
FREE
Magic 7 Indicator
Marek Pawel Szczesny
5 (1)
Overview Magic 7 Indicator is a comprehensive MetaTrader 5 (MQL5) indicator that identifies seven different trading scenarios based on candlestick patterns and technical analysis. The indicator combines traditional price action patterns with modern concepts like Fair Value Gaps (FVG) to provide trading signals with precise entry points and stop loss levels. Features 7 Trading Scenarios : Each scenario identifies specific market conditions and trading opportunities Visual Signals : Clear buy/sell
FREE
Girassol Sunflower MT5 Indicator
Saullo De Oliveira Pacheco
4.33 (6)
This is the famous Sunflower indicator for Metatrader5. This indicator marks possible tops and bottoms on price charts. The indicator identifies tops and bottoms in the asset's price history, keep in mind that the current sunflower of the last candle repaints, as it is not possible to identify a top until the market reverses and it is also not possible to identify a bottom without the market stop falling and start rising. If you are looking for a professional programmer for Metatrader5, please
FREE
This indicator is an automated version of the Fibonacci retracement (Fib) indicator. Deciding the best areas to use when drawing the fib can be tricky and this  indicator was made with that in mind. When you drop it on the chart it will automatically choose the best points to draw the fib with, but in case you aren't satisfied with those regions, you can adjust it as you wish.
FREE
Indicator and Expert Adviser  EA Available in the comments section of this product. Download with Indicator must have indicator installed for EA to work. Mt5 indicator alerts for bollinger band and envelope extremes occurring at the same time. Buy signal alerts occur when A bullish candle has formed below both the lower bollinger band and the lower envelope  Bar must open and close below both these indicators. Sell signal occur when A bear bar is formed above the upper bollinger band and upper
FREE
平均足(ヘイキンアシ)MT5インジケーター 平均足(ヘイキンアシ)MT5インジケーターは、標準的な価格データをより滑らかでトレンドに沿ったローソク足に変換し、市場トレンドや潜在的な反転ポイントをより簡単に識別できるようにする強力なツールです。 主な特徴: 明確なトレンド識別: 異なるローソク足の色で上昇トレンドと下降トレンドを視覚的に区別します。 ノイズの低減: 価格変動をフィルタリングし、 市場の主要な動きをより明確に表示します。 早期トレンド検出: 標準チャートでトレンドの変化が明らかになる前に、 潜在的なトレンド変化を予測します。 汎用性: 単独で使用することも、 他のテクニカル指標と組み合わせて総合的な分析を行うこともできます。 カスタマイズ可能な設定: インジケーターを特定の取引設定や戦略に合わせて調整できます。 メリット: トレンドを特定し、 潜在的なエントリーポイントと出口ポイントを識別する能力を向上させます。 市場ノイズの影響を減らし、 重要な価格変動に集中します。 市場ダイナミクスをより明確に理解することで、 より情報に基づいた取引決定を行うことができます。 検証済
FREE
Coral trend is   a trend-following indicator that is widely popular among FOREX traders . It is usually used as a confluence with other indicators. It uses combinations of moving averages with complex smoothing formulas! It has two configurable parameters: Coefficient   - smoothing ratio (*) Applied price Calculation: Coral = (-0.064) * B6 + 0.672 * B5 - 2.352 * B4 + 2.744 * B3
FREE
https://www.mql5.com/en/users/gedeegi/seller    The GEN indicator is a multifunctional technical analysis tool for the MetaTrader 5 (MT5) platform. It is designed to automatically identify and display key Support and Resistance (S&R) levels and detect False Breakout signals, providing clear and visual trading cues directly on your chart. Its primary goal is to help traders identify potential price reversal points and avoid market traps when the price fails to decisively break through key levels
FREE
Are you tired of drawing trendlines every time you're analyzing charts? Or perhaps you would like more consistency in your technical analysis. Then this is for you. This indicator will draw trend lines automatically when dropped on a chart. How it works Works similar to standard deviation channel found on mt4 and mt5. It has 2 parameters: 1. Starting Bar 2. Number of bars for calculation The   starting bar   is the bar which drawing of the trend lines will begin, while the   number of bars for c
FREE
VolumeBasedColorsBars — Free Powerful Volume Analysis for All Traders Unlock the hidden story behind every price bar! VolumeBasedColorsBars is a professional-grade, 100% FREE indicator that colorizes your chart candles based on real, adaptive volume analysis. Instantly spot surges in market activity, identify exhaustion, and catch the moves that matter. This indicator gives you:    • Dynamic color-coded bars for instant volume context    • Adaptive thresholds based on historical, session-awar
FREE
High Low Open Close
Alexandre Borela
4.98 (43)
このプロジェクトが好きなら、5つ星レビューを残してください。 このインジケータは、指定されたためのオープン、ハイ、ロー、クローズ価格を描画します 特定のタイムゾーンの期間と調整が可能です。 これらは、多くの機関や専門家によって見られた重要なレベルです トレーダーは、彼らがより多くのかもしれない場所を知るために有用であり、 アクティブ。 利用可能な期間は次のとおりです。 前の日。 前週。 前の月。 前の四半期。 前年。 または: 現在の日。 現在の週。 現在の月。 現在の四半期。 現年。
FREE
Donchian Channel is an indicator created by Richard Donchian. It is formed by taking the highest high and the lowest low of the last specified period in candles. The area between high and low is the channel for the chosen period. Its configuration is simple. It is possible to have the average between the upper and lower lines, plus you have alerts when price hits one side. If you have any questions or find any bugs, please contact me. Enjoy!
FREE
This indicator displays pivot points in the chart, including historical vales, and supports many calculation modes for Pivot Points and S/R levels. [ Installation Guide | Update Guide | Troubleshooting | FAQ | All Products ] It plots historical levels for backtesting purposes It allows you to select the reference timeframe It implements different Pivot Point calculation modes It implements different SR calculation modes It implements customizable colors and sizes Calculation Modes The indicato
FREE
The indicator identifies when a divergence occurs between price and an indicator or oscillator. It identifies both regular and hidden divergences. Combined with your own rules and techniques, this indicator will allow you to create (or enhance) your own powerful system. For higher probability setups I can recommend you to use my Supply Demand indicator and trade only if the divergence occurs inside a zone. Supply zone for bearish div and demand zone for bullish div. The optimal scenario is if it
FREE
This is a buyer and seller aggression indicator that analyzes the shape of each candle and project this data in a histogram form. There are 4 histograms in one. On the front we have two: Upper - Buyer force. Lower - Seller force. At the background we also have two histogram, both with same color. They measure the combined strenght of buyers and sellers. This histograms can be turned off in Input Parameters. It is also possible to have the real or tick volume to help on this force measurement. IN
FREE
このプロダクトを購入した人は以下も購入しています
このインジケーターを購入すると、プロ仕様のトレードマネージャーを無料で差し上げます。 まず第一に、このトレーディングシステムがノンリペイント、ノンリドロー、ノンラグのインジケーターであることを強調する価値がある。これにより、手動取引とロボット取引の両方に理想的なものになっています。 オンラインコース、マニュアル、プリセットのダウンロード。 「スマートトレンドトレーディングシステム MT5」は、新規および経験豊富なトレーダー向けにカスタマイズされた包括的なトレーディングソリューションです。10以上のプレミアムインジケーターを組み合わせ、7つ以上の堅実なトレーディング戦略を備えており、多様な市場状況に対応する多目的な選択肢となっています。 トレンドフォロー戦略:トレンドを効果的に乗り越えるための正確なエントリーとストップロス管理を提供します。 リバーサル戦略:潜在的なトレンドの反転を特定し、トレーダーがレンジ相場を活用できるようにします。 スキャルピング戦略:高速で正確なデイトレードおよび短期取引のために設計されています。 安定性:すべてのインジケーターはノンリペイント、ノンリドロー、ノ
FX Trend NG:次世代マルチマーケット・トレンドインテリジェンス 概要 FX Trend NG は、複数の時間足に対応したプロフェッショナル向けトレンド分析およびマーケット監視ツールです。 市場全体の構造を数秒で把握することができます。 複数のチャートを切り替える必要はありません。どの銘柄がトレンド中なのか、どこでモメンタムが弱まっているのか、そしてどの時間足で強い整合性があるのかを瞬時に確認できます。 ローンチ特別オファー – FX Trend NG を $30(6ヶ月) または $80 永久ライセンス でご利用いただけます。 すでに Stein Investments のユーザーですか? -> メッセージを送信 して、プライベートグループへアクセスしてください。 セットアップや詳細情報が必要ですか? -> Stein Investments 公式ページ をご覧ください。 1. FX Trend NG が他と異なる理由 3ステート・トレンドロジック ― Buy と Sell だけではない • 多くのインジケーターは Buy または Sell の2状態のみを表示します。
SuperScalp Pro — 高度なマルチフィルター対応スキャルピングインジケーターシステム SuperScalp Pro は、クラシックな Supertrend と複数のインテリジェントな確認フィルターを組み合わせた高度なスキャルピング用インジケーターシステムです。M1〜H4 のすべての時間足で効率的に機能し、特に XAUUSD、BTCUSD、および主要なFX通貨ペアに適しています。単体のシステムとして、また既存の取引戦略へ柔軟に統合して使用できます。 本インジケーターは 11 以上のフィルターを統合しており、短期・長期の EMA、トレンド判定に用いる 3 本の EMA、EMA スロープ(EMA slope)、RSI、ADX、出来高、VWAP、ボリンジャーバンドのブレイクアウト、MACD ダイバージェンスフィルターなどを含みます。スマートキャンドルフィルターはローソク足の終値を確認して弱いシグナルを排除し、3 本の EMA と MACD ダイバージェンスを組み合わせたトレンド認識メカニズムにより勝率の高いシグナルの選別を支援します。 SuperScalp Pro は ATR に基
このインジケーターを購入された方には、以下の特典を 無料 で提供しています: 各トレードを自動で管理し、ストップロスとテイクプロフィットを設定し、戦略ルールに基づいてポジションを決済する補助ツール 「Bomber Utility」 様々な銘柄に合わせたインジケーターの設定ファイル(セットファイル) 「最小リスク」、「バランスリスク」、「待機戦略」 の3つのモードで使用できる Bomber Utility 用の設定ファイル このトレーディング戦略をすぐに導入・設定・開始できる ステップバイステップのビデオマニュアル ご注意: 上記の特典を受け取るには、MQL5のプライベートメッセージシステムを通じて販売者にご連絡ください。 オリジナルのカスタムインジケーター 「Divergence Bomber(ダイバージェンス・ボンバー)」 をご紹介します。これは、MACDのダイバージェンス(乖離)戦略に基づいた 「オールインワン」型のトレーディングシステム です。 このテクニカルインジケーターの主な目的は、価格とMACDインジケーターの間に発生するダイバージェンスを検出 し、将来の価格の動きを示す
ARIPoint is a powerful trading companion designed to generate high-probability entry signals with dynamic TP/SL/DP levels based on volatility. Built-in performance tracking shows win/loss stats, PP1/PP2 hits, and success rates all updated live. Key Features: Buy/Sell signals with adaptive volatility bands Real-time TP/SL/DP levels based on ATR Built-in MA Filter with optional ATR/StdDev volatility Performance stats panel (Success, Profit/Loss, PP1/PP2) Alerts via popup, sound, push, or email Cu
Entry In The Zone and SMC Multi Timeframe is a real-time market analysis tool developed based on Smart Money Concepts (SMC). It is designed to analyze market structure, price direction, reversal points, and key zones across multiple timeframes in a systematic way. The system displays Points of Interest (POI) and real-time No Repaint signals, with instant alerts when price reaches key zones or when signals occur within those zones. It functions as both an Indicator and a Signal System (2-in-1), c
Super Signal – Skyblade Edition プロ仕様のノンリペイント / ノーラグ・トレンドシグナルシステム。卓越した勝率を実現 | MT4 / MT5 対応 1分足、5分足、15分足などの低い時間足で最も効果を発揮します。 主な特徴: Super Signal – Skyblade Edition は、トレンド取引に特化したスマートなシグナルシステムです。マルチレイヤーのフィルターロジックを用いて、明確な方向性と実際のモメンタムに支えられた強力なトレンドのみを検出します。 このシステムは 天井や底を予測するものではありません 。次の3つの条件がすべて満たされた場合にのみシグナルを発生させます: 明確なトレンド方向 モメンタムの増加 健全なボラティリティ構造 市場セッションに基づく流動性分析と組み合わせることで、シグナルの精度とタイミングがさらに向上します。 シグナルの特性: すべての矢印シグナルは 100% 非リペイント / 遅延なし 一度出現したシグナルは固定され、点滅・消失しません チャート上の矢印、情報パネル、ポップアップ通知、音声アラート、プッシュ通知
Game Changerは、あらゆる金融商品で使用できる革新的なトレンドインジケーターです。MetaTraderを強力なトレンドアナライザーへと変貌させます。あらゆる時間枠で動作し、トレンドの特定、反転の可能性のシグナル、トレーリングストップ機能、そして迅速な市場反応のためのリアルタイムアラートを提供します。経験豊富なプロでも、優位性を求める初心者でも、このツールは自信と規律、そして根本的なトレンドダイナミクスを明確に理解した上で取引を行うための力となります。このインジケーターはリドロー機能も備えています。 購入後すぐにご連絡いただければ、個人ボーナスを進呈いたします。Strong SupportとTrend Scannerインジケーターの無料コピーを入手できます。[email protected]までプライベートメッセージを送ってください。 私のEAや特別なセットはTelegramでは販売しておりません。MQL5でのみ販売しており、セットファイルは私のブログでのみ公開しています。詐欺師にはご注意ください。他の方からセットを購入しないでください。 設定 トレンド変化時のアラート
Power Candles – あらゆる市場に対応した強度ベースのエントリーシグナル Power Candles は、Stein Investments が長年培ってきた強度分析を価格チャート上に直接反映します。価格だけに反応するのではなく、各ローソク足は実際の市場の強さに基づいて色分けされ、モメンタムの蓄積、強度の加速、明確なトレンド転換を瞬時に把握できます。 すべての市場に共通する単一ロジック Power Candles は すべての取引シンボル で自動的に動作します。現在のシンボルが Forex か非 Forex 市場かを自動判別し、内部で適切な強度モデルを適用します。 Forex および Gold :FX Power のデルタ値を使用(絶対値レンジ最大 100) 指数、暗号資産、CFD :IX Power の強度値を使用(絶対値レンジ最大 50) 必要な強度計算は Power Candles に直接組み込まれています。ローソク足のカラーリングやシグナルロジックに、追加のインジケーターは不要です。 価格ノイズではなく「強度状態」 各ローソク足は、以下の 9 つの明確に定義された強
Azimuth Pro
Ottaviano De Cicco
5 (4)
発売プロモーション Azimuth Proは先着100名様限定で 299ドル でご提供します。最終価格は 499ドル となります。 リテールとインスティテューショナルのエントリーの違いはインジケーターではなく、ロケーションにあります。 多くのトレーダーは、モメンタムを追いかけたり、遅行シグナルに反応して、任意の価格レベルでエントリーします。機関投資家は、需給が実際にシフトする構造的なレベルに価格が到達するのを待ちます。 Azimuth Proはこれらのレベルを自動的にマッピングします:スイングアンカーVWAP、マルチタイムフレーム構造ライン、高確率ロケーションにのみ出現するABCパターン。 Azimuth Proは、構造分析とインテリジェントな自動化の両方を求めるプロフェッショナルトレーダー向けに構築されています。 Azimuthが外科的精度で市場構造をマッピングする一方、Azimuth Proはインテリジェンスレイヤーを追加します:トレーディングスタイルの自動検出、スマート設定された移動平均線、20年のデータでバックテストされた最適化パラメータ。その結果、お使いの銘柄と
トレンド スクリーナー インジケーターでトレンド取引の力を解き放ちます。ファジー ロジックと複数通貨システムを活用した究極のトレンド取引ソリューションです。 ファジー ロジックを活用した革新的なトレンド インジケーターである Trend Screener を使用して、トレンド取引を向上させます。 これは、13 を超えるプレミアム ツールと機能、および 3 つの取引戦略を組み合わせた強力なトレンド追跡インジケーターであり、Metatrader をトレンド アナライザーにする多用途の選択肢となります。 期間限定オファー : トレンド スクリーナー インジケーターは、わずか 100 ドルで生涯ご利用いただけます。 (元の価格 50$ ) (オファー延長) Trend Screener の 100% 非再描画精度の揺るぎない精度を体験して、取引の決定が過去の価格変動の影響を受けないようにしてください。 マルチタイムフレームおよびマルチ通貨機能の多用途性を解放し、比類のない自信を持って外国為替、商品、暗号通貨、インデックスの世界を取引できるようにします。 Trend Screener の包括的な
FX Power: 通貨の強弱を分析して、より賢い取引を実現 概要 FX Power は主要通貨と金の実際の強弱をあらゆる市場状況で理解するための必須ツールです。強い通貨を買い、弱い通貨を売ることで、 FX Power は取引の意思決定を簡素化し、高い確率の取引機会を見出します。トレンドを追従する場合でも、極端なデルタ値を使用して反転を予測する場合でも、このツールはあなたの取引スタイルに完全に適応します。ただ取引するだけではなく、 FX Power で賢く取引をしましょう。 1. なぜ FX Power がトレーダーにとって非常に有益なのか 通貨と金のリアルタイム強弱分析 • FX Power は主要通貨と金の相対的な強弱を計算し、マーケットダイナミクスに関する明確な洞察を提供します。 • どの資産がリードしているか、または後れを取っているかを監視して、取引するペアを賢く選びましょう。 マルチタイムフレームの包括的なビュー • 短期、中期、長期のタイムフレームで通貨と金の強弱を追跡し、マーケットトレンドに基づいて取引戦略を調整できます。 • スキャルピングからスイングトレード
これはMT5のインジケーターで、再描画なしで取引に参入するための正確なシグナルを提供します。 外国為替、暗号通貨、金属、株式、インデックスなど、あらゆる金融資産に適用できます。かなり正確な見積もりを提供し、取引を開始して終了するのに最適な時期を教えてくれます。1つのシグナルを処理しただけでインジケーターの元が取れた例の 動画 (6:22)をご覧ください。Entry PointsPro インジケーターの助けを借りたほとんどのトレーダーの最初の1週間の結果が改善しています。 Telegramグループ に登録してください。Entry Points Proインジケーターのメリットは次の通りです。 再描画のないエントリーシグナル 再描画されるインジケーターでは一度表示されたシグナルが削除されて大きな金銭的損失につながることがありますが、これと異なり、表示されて確認されたシグナルは消えることがありません。 エラーなしの取引開始 インジケーターアルゴリズムによって取引を開始する(資産を売買する)理想的な瞬間を見つけることができます。それを使用するすべてのトレーダーの成功率が向上します。 あら
Smart Stop Indicator – チャート上で実現するインテリジェントなストップロス精度 概要 Smart Stop Indicator は、ストップロスを勘や感情ではなく、明確で体系的に設定したいトレーダーのために設計されています。本ツールは、クラシックなプライスアクション(高値更新・安値切り下げ)と最新のブレイクアウト認識ロジックを組み合わせ、次に来るべき論理的なストップレベルを正確に特定します。トレンド相場、レンジ、急速なブレイクアウト局面のいずれであっても、最適な SL ゾーンとその状態(“new”、“broken”、“valid”)をチャート上に直接表示します。さらに今回、SL 距離の %ADR 表示も新たに追加されています。 主な特徴 マーケット構造に基づく自動ストップ配置 • 市場構造とリアルタイムの値動きに基づき、意味のあるストップロスレベルを自動検出します。 スマートなブレイクアウト感知 • 急激な方向転換やブレイクアウトにも柔軟に対応し、早すぎるストップ調整を避けます。 SL %ADR の表示 • ストップロスまでの距離を ADR(Averag
まず第一に、この取引インジケーターは再描画されず、再描画されず、遅延しないことを強調する価値があります。これにより、手動取引とロボット取引の両方に理想的なものになります。 ユーザーマニュアル:設定、入力、戦略。 アトミックアナリストは、価格の強さとモメンタムを利用して市場でより良いエッジを見つけるためのPA価格アクションインジケーターです。ノイズや誤ったシグナルを除去し、取引ポテンシャルを高めるための高度なフィルターを備えています。複雑なインジケーターの複数のレイヤーを使用して、アトミックアナリストはチャートをスキャンし、複雑な数学的計算をシンプルなシグナルと色に変換します。これにより、どのような初心者トレーダーでも理解して使用し、一貫した取引の決定を行うことができます。 「アトミックアナリスト」は、新規および経験豊富なトレーダー向けにカスタマイズされた包括的な取引ソリューションです。プレミアムインジケーターとトップノッチの機能を1つの取引戦略に組み合わせ、すべてのタイプのトレーダーにとって汎用性のある選択肢にします。 デイリートレーディングとスキャルピング戦略:高速で正確なデイ
Gold Entry Sniper – ゴールドスキャルピング&スイングトレード用プロフェッショナル多時間足ATRダッシュボード Gold Entry Sniper は、XAUUSDや他の銘柄向けに正確な 売買シグナル を提供する、MetaTrader 5用の高度なインジケーターです。 ATRトレーリングストップロジック と 多時間足分析ダッシュボード を搭載し、スキャルピングからスイングトレードまで対応します。 主な特徴と利点 多時間足シグナル分析 – M1、M5、M15 のトレンドを同時表示。 ATRベースのトレーリングストップ – ボラティリティに応じて動的に調整。 プロ仕様のチャートダッシュボード – シグナル状況、ATRレベル、回帰線、売買方向を表示。 明確な売買マーカー – 自動矢印とテキストラベル。 エグジットアラートとトレード管理 – 利益確定のための自動検出。 完全カスタマイズ可能 – パネル位置、色、フォント、ATR/回帰設定を調整可能。 ゴールド(XAUUSD)に最適化 – M1〜M15のスキャルピングに最適、FXや指数、暗号資産にも対応。 Gold Entry
毎日、多くのトレーダーが共通の課題に直面しています。価格が重要なレベルを突破したように見えてトレードに参入すると、市場が反転してストップロスが発動されるという状況です。これはダマシ(フォールスブレイクアウト)と呼ばれ、価格がサポートまたはレジスタンスレベルを一時的に超えた後、方向を反転させる動きです。これらの動きにより、実際の価格方向が明確になる前にストップロスが発動される可能性があります。 テクニカル分析では、この現象は一般的に「流動性スイープ」(liquidity sweep)または「ストップ狩り」(stop hunt)と呼ばれています。 Mirage Trading Systemは、ダマシパターンを検出するために設計されたインジケーターです。「Mirage」(蜃気楼)という名前は、市場で頻繁に発生する欺瞞的な価格変動という幻想を指しています。 ダマシは多くのトレーダーを不意打ちにする可能性がありますが、Mirage Trading Systemはこれらのパターンがいつ形成されるかを識別し、その後の価格変動の潜在的な方向を示すように設計されています。 ローンチ期間パッケージ ローン
Trend Ai indicatorは、トレンドの識別と実用的なエントリポイントと反転アラートを組み合わせることで、トレーダーの市場分析を強化する優れたツールです。 この指標は、ユーザーが自信と正確さで外国為替市場の複雑さをナビゲートすることを可能にします トレンドAiインジケーターは、主要なシグナル以外にも、プルバックやリトレースメント中に発生するセカンダリエントリポイントを識別し、トレーダーが確立されたトレンド内の価格修正を活用できるようにします。 重要な利点: *MT4およびMT5の仕事 *明確な買いまたは売りシグナル *再描画しません ·すべての資産で動作します 私はeaやセットをtelegram it詐欺で販売しないように注意してください。 すべての設定はここでブログで無料です。  重要! 指示とボーナスを得るために購入後すぐに私に連絡してください! 私の他のプロダクトと同様、実質操作の監視はここに見つけることができます: https://www.mql5.com/en/users/mechanic/seller&nbsp ; 設定および入力: すべての
FX Levels: あらゆる市場における非常に高精度なサポート&レジスタンス 概要 通貨ペア、株式指数、個別銘柄やコモディティなど、どのような市場でも信頼できるサポートとレジスタンスを特定したいですか? FX Levels は伝統的な “Lighthouse” メソッドと先進的な動的アプローチを融合し、ほぼ汎用的な精度を実現します。ブローカーの実務経験を活かし、自動化されたデイリー更新とリアルタイム更新を組み合わせることで、 FX Levels は反転ポイントを見つけ、利益目標を設定し、自信をもってトレードを管理するための手助けをします。今すぐ試してみて、サポート/レジスタンス分析の正確性がどれほどトレードを向上させるかを実感してください! 1. FX Levels がトレーダーにとって非常に有用な理由 非常に正確なサポート&レジスタンスゾーン • FX Levels は異なるブローカー環境でもほぼ同一のゾーンを生成するよう設計されており、データフィードの差異や時刻設定のずれによる不一致を解消します。 • つまり、どのブローカーを利用していても一貫したレベルが得られるため、戦
Pointer Trend Switch — precision trend reversal indicator Pointer Trend Switch is a high-precision arrow indicator designed to detect key moments of trend reversal based on asymmetric price behavior within a selected range of bars. It identifies localized price impulses by analyzing how far price deviates from the opening level, helping traders find accurate entry points before a trend visibly shifts. This indicator is ideal for scalping, intraday strategies, and swing trading, and performs equa
Crystal Heikin Ashi Signals - Professional Trend & Signal Detection Indicator Advanced Heikin Ashi Visualization with Intelligent Signal System for Manual & Automated Trading Final Price: $149 ---------> Price goes up $10 after every 10 sales . Limited slots available — act fast . Overview Crystal Heikin Ashi Signals is a professional-grade MetaTrader 5 indicator that combines pure Heikin Ashi candle visualization with an advanced momentum-shift detection system. Designed for both manual traders
優れたテクニカルインジケーター「Grabber」をご紹介します。これは、すぐに使える「オールインワン」トレーディング戦略として機能します。 ひとつのコードに、市場のテクニカル分析ツール、取引シグナル(矢印)、アラート機能、プッシュ通知が強力に統合されています。 このインジケーターを購入された方には、以下の特典を無料で提供します: Grabberユーティリティ:オープンポジションを自動で管理するツール ステップバイステップのビデオマニュアル:インジケーターのインストール、設定、取引方法を解説 カスタムセットファイル:インジケーターをすばやく自動設定し、最大限の成果を出すための設定ファイル 他の戦略はもう忘れてください!Grabberだけが、あなたを新たなトレードの高みへと導いてくれるのです。 Grabber戦略の主な特徴: 推奨タイムフレーム:M5〜H4 対応通貨ペア・資産:どれでも使用可能ですが、私が実際に検証した以下を推奨します(GBPUSD、GBPCAD、GBPCHF、AUDCAD、AUDUSD、AUDSGD、AUDCHF、NZDUSD、NZDCAD、EURCAD、EURUSD、E
ご紹介     Quantum Breakout PRO は 、ブレイクアウト ゾーンの取引方法を変革する画期的な MQL5 インジケーターです。 13年以上の取引経験を持つ経験豊富なトレーダーのチームによって開発されました。     クォンタム ブレイクアウト プロ   は、革新的でダイナミックなブレイクアウト ゾーン戦略により、あなたのトレーディングの旅を新たな高みに押し上げるように設計されています。 クォンタム ブレイクアウト インジケーターは、5 つの利益ターゲット ゾーンを備えたブレイクアウト ゾーン上のシグナル矢印と、ブレイクアウト ボックスに基づいたストップロスの提案を提供します。 初心者トレーダーにもプロのトレーダーにも適しています。 量子EAチャネル:       ここをクリック 重要!購入後、インストールマニュアルを受け取るためにプライベートメッセージを送ってください。 推奨事項: 時間枠: M15 通貨ペア: GBPJPY、EURJPY、USDJPY、NZDUSD、XAUUSD アカウントの種類: ECN、Raw、またはスプレッドが非常に低い R
このインジケーターは、市場で 関心が示されたゾーン をハイライトし、その後に 注文の蓄積ゾーン を表示します。 これは、大規模な**板情報(オーダーブック)**のように機能します。 これは、 巨大な資金 のためのインジケーターです。その性能は卓越しています。 市場にどんな関心が存在していても、 必ず目に見えるようになります 。 (これは 完全に再設計され、自動化されたバージョン です。もはや手動分析は必要ありません。) トランザクションスピード(取引速度) は新しい概念のインジケーターで、市場で大口注文が どこに・いつ 集中しているかを示し、それに基づいたチャンスを提供します。 トレンドの変化を 非常に早い段階 で察知することができます。 FXでは「出来高」と呼ばれているものは誤解されています。実際には、これは 時間あたりの価格変動量 です。したがって、正しい名称は トランザクションスピード です。 考え方・行動・分析の仕方すべてが問われます。 分析パラダイムの転換は非常に重要です。 このインジケーターは、FXにおける出来高の考え方を 根本から再定義 し、論理的な形で正確に活用する、
note: this indicator is for METATRADER4, if you want the version for METATRADER5 this is the link:  https://www.mql5.com/it/market/product/108106 TRENDMAESTRO ver 2.5 TRENDMAESTRO recognizes a new TREND from the start, he never makes mistakes. The certainty of identifying a new TREND is priceless. DESCRIPTION TRENDMAESTRO identifies a new TREND in the bud, this indicator examines the volatility, volumes and momentum to identify the moment in which there is an explosion of one or more of these da
トレンドラインプロ   市場の真の方向転換点を理解するのに役立ちます。この指標は、真のトレンド反転と主要プレーヤーが再び参入するポイントを示します。 分かりますか     BOSライン   複雑な設定や不要なノイズなしに、より長い時間足でのトレンドの変化と重要なレベルを把握できます。シグナルは再描画されず、バーが閉じた後もチャート上に残ります。 MT4バージョン   -   RFI LEVELS PRO インジケーター と組み合わせることで、その最大限の能力を発揮します インジケーターが示す内容: 本当の変化   トレンド(BOSライン) 一度シグナルが現れたら、それは有効です!これは、リペイント機能を持つインジケーターとの重要な違いです。リペイント機能を持つインジケーターは、シグナルを発した後、それを変更し、資金の損失につながる可能性があります。これにより、より高い確率と精度で市場に参入できます。また、矢印が現れた後、目標値(利益確定)に達するか、反転シグナルが現れるまで、ローソク足の色を変更する機能もあります。 繰り返しエントリ   主要プレーヤーの補充 エントリーポイントを探す
Dark Support Resistance  is an Indicator for intraday trading. This Indicator is programmed to identify  Support and Resistance Lines , providing a high level of accuracy and reliability. Key benefits Easily visible lines Only the most important levels will be displayed Automated adjustment for each timeframe and instrument Easy to use even for beginners Never repaints, never backpaints, Not Lag 100% compatible with Expert Advisor development All types of alerts available: Pop-up, Email, Push
Quantum Entry は、トレーダーの間で最も人気があり広く知られている戦略の一つである「ブレイクアウト戦略」を基に構築された、強力なプライスアクション取引システムです!このインジケーターは、主要なサポート(支持線)とレジスタンス(抵抗線)ゾーンのブレイクアウトに基づいて、明確な買いと売りのシグナルを生成します。一般的なブレイクアウトインジケーターとは異なり、高度な計算を用いてブレイクアウトを正確に確認します。ブレイクアウトが発生すると、即座にアラートを受け取ることができます。 ラグなく、再描画なし :すべてのシグナルはリアルタイムで提供され、ラグがなく、過去のシグナルが再描画されることもありません! 推奨事項 Quantum Entryは、あらゆる通貨ペア・銘柄、あらゆる時間軸で動作します。私たちは個人的にこのインジケーターを   XAUUSD(金)   の   M1、M5、M15   時間軸で使用しています! あなたのトレーディングスキルを向上させるチャンスを逃さないでください。今すぐ Quantum Entry を手に入れ、自信と精度を持った取引を始めましょう! MT4 v
Stratos Pali Indicator is a revolutionary tool designed to enhance your trading strategy by accurately identifying market trends. This sophisticated indicator uses a unique algorithm to generate a complete histogram, which records when the trend is Long or Short. When a trend reversal occurs, an arrow appears, indicating the new direction of the trend. Important Information Revealed Leave a review and contact me via mql5 message to receive My Top 5 set files for Stratos Pali at no cost ! Down
Quantum TrendPulse を ご紹介します。これは、   SuperTrend   、   RSI   、および Stochastic のパワーを 1 つの包括的なインジケーターに組み合わせて、取引の可能性を最大限に引き出す究極の取引ツールです。精度と効率を求めるトレーダー向けに設計されたこのインジケーターは、市場のトレンド、勢いの変化、最適なエントリー ポイントとエグジット ポイントを自信を持って特定するのに役立ちます。 主な特徴: SuperTrend 統合: 現在の市場動向に簡単に追従し、収益性の波に乗ることができます。 RSI精度: 買われすぎと売られすぎのレベルを検出し、市場の反転のタイミングに最適で、SuperTrendのフィルターとして使用されます。 確率的精度: 確率的振動を活用して、変動の激しい市場で隠れたチャンスを見つけます。SuperTrend のフィルターとして使用されます。 マルチタイムフレーム分析:   M5 から H1 または H4 まで、さまざまなタイムフレームで市場を常に把握します。 カスタマイズ可能なアラート: カスタム取引条件が満たされ
作者のその他のプロダクト
This is a simple order block locator. Searched for the existence of order blocks only at extremums. If you want multi criteria order block location check my other indicator which is more powerful here  These order blocks are ICT order blocks without any buttering. The indicator can be a useful tool for detecting reversals, continuations. You can also use the indicator as confluence with your other tools
FREE
Day Trader WorkTime
Aurthur Musendame
4.8 (15)
The worktime indicator helps you identify the most important times to day to trade the currency pairs. It was created based on the ICT day trading free tutorials that are freely vailable on his youtube channel.  You can use this indicator together with my other indicators that i have shared freely with you like the true day, custom periods, daily month, weekly open lines - they together complement each other very well. Nuggets from this indicator: 1. Draws the asian session box showinng you the
FREE
!!!!!!!! Sniper Nuggets !!!!!!!! Sniper Nuggets is an all-in-one indicator for many things ICT style.  It includes the following functionalities: Custom periods : which allow you to set custom daily period start and end times according to your taste. ADR Markers: which plots the average daily range. Worktime: which plots the various boxes on the chart for Asia range (including its high, low and midpoints, standard deviation predictions ), London open, New York open, CME open and London close.
FREE
The Higher timeframe candle tracker is used to get a glimpse of what the selected higher time frame candle is like. It plot the candle after the current price. It can come in handy for day traders and short term traders that often worry about how the current higher timeframe candle may look like. You can select the higher time frame or lower time frame from the options provided: By default the color for bears is red and for bulls is green. You are able to change the width of the candle, its wick
FREE
The Central Bank Dealers Range (CBDR) is a key ICT concept, used to project potential highs and lows for the day based on market conditions during a specific time window. The CBDR is utilized to forecast price movements in both bullish and bearish market conditions. By identifying this range, traders can better anticipate the price levels that may form as the day progresses. CBDR and Standard Deviation A key feature of the CBDR is its application of standard deviation , a statistical measure u
FREE
The Average Daily Range (ADR) is a powerful tool for traders, especially those focused on intraday and scalping strategies. It provides valuable insights into the expected price movement for the day and how price action is behaving relative to historical trends. The ADR indicator shows the following key information: Today's ADR : The typical range of price movement for the current trading day, based on historical data. 3x Today's ADR : Three times the current ADR, showing potential price moveme
FREE
Super Fractals
Aurthur Musendame
5 (5)
Think of the Super Fractal Indicator as the Bill WIlliams Indicator on Steroids. Indicator Abilities: 1. Adjust Candle around Fractal High or Low. 2. Adjust Lookback period and only plot for a specific number of history candles avoiding cluttering your trading desk. 3. The Indicator uses buffers so you call and use it from any EA. Note : The higher the candles around Fractal, the stronger the Turning point anfd viceversa is true.
FREE
One Moving Average
Aurthur Musendame
4.75 (4)
This indicator was created based on posts from forex factory thread titled There is no Magic Moving Average - You need only one - by @andose2 a.k.a Andrei Florin. If you want to know about how to use this trading strategy please go and read  https://www.forexfactory.com/thread/691864-there-is-no-magic-moving-average-you. Note: Below are extracts some of the posts . Estabilish a trend, based on Market Cycles, then go   only long in the Markup Phase   and   only short in the Decline phase ,   st
FREE
True Day
Aurthur Musendame
5 (1)
True Days is a tool designed specifically for the trader who wants to catch intraday volatility in price charts.  True day makes it easier for the trader to avoid trading in the dead zone - a period in time where markets are considered dead or non volatile. The trader can concentrate on finding opportunities only during periods of profound market movements. By default the indicator gives you a true day starting at 02:00 to 19:00 hours GMT+2. You can adjust according to your Time Zone. By deafult
FREE
The Monthly Weekly Open Line is an indicator that plots: The current month open line that will extend till the last week on the month. Weekly lines that span the look back days period that you have set . Each line will extend from the respective weekly Monday zero GMT till friday of the respective week. Monthly and Weekly open lines can be used to build very powerfull anc consistent trading strategies. They act as natural S/R price barriers.
FREE
High of the Day and Low of the day Time and Price Fractal Studies is an indicator that will help you identify certain patterns that tend to repeat themseleves at certail times of the day or at certain prices.  It is used to study Daily Highs ad Lows in relation to time and price.  You will get to answer certail questions like: At what time of day does this market usually turn around. At what price does the market turn. Is it at round numbers etc
FREE
Time and Price Fractal Studies is an indicator that will help you identify certain patterns that tend to repeat themseleves at certail times of the day or at certain prices.  It is used to study Fractal Highs ad Lows in relation to time and price.  You will get to answer certail questions like: At what time of day does this market usually turn around. At what price does the market turn. Is it at round numbers etc.
FREE
The daily custom period seperator indicator allows you to draw period seperators for your lower time frame charts H1 and below.  The period seperator gives you options to set different colors for: Weekend - saturday/sunday Monday and Friday  Midweek - Tuesday to Thursday. By default the indicator plots the period seperator line at 00:00 hours for the last 10 days. Use Cases: The indicator can be used as a colourful alternative period seperator to the default MT5 period seperator. For those tha
FREE
Template name allows you to write custom text that will show up on your charts. It allows you to position the text anywhere including selecting any color that you prefer. You can position the text at any of the 4 corners of your chart screen. This custom text can aid as a watermark for your screen shots. This text can act as a unique and true signature for your charts.
FREE
The order block locator is powered by three main search algorithms thar can be used to find order blocks. Simple Fractal Search Algorithm Naive Fractal Movers Algorithm Candle Transition Algorithm You can even combine the power of your 2 favourite algorithms and get the best of both worlds: Mixed Algorithm (Naive Fractal + Candle transition) Mixed Algorithm (Simple Fractal + Candle Transition Simple Fractal Search Algorithm The algorithm finds the fractals based on your setting paramers for c
The Higher Timeframe Multiple Candle Tracker is designed to provide a snapshot of what the selected higher timeframe candles look like. It plots the N most recent candles after the current price. This tool is especially useful for traders who want to understand how the current higher timeframe candle may develop. You can choose the higher or lower timeframe from the available options. By default, bearish candles are displayed in red and bullish candles in green. The indicator also allows customi
フィルタ:
GermanPotato
724
GermanPotato 2025.06.10 19:43 
 

Very good... All indicators are usefull... Thanks...

Pablo88888
200
Pablo88888 2023.10.19 21:20 
 

Muy práctico, gracias

3551535
71
3551535 2023.06.13 09:21 
 

very useful

Gerhard Oehler
222
Gerhard Oehler 2023.04.26 16:38 
 

leider nicht das was ich suche, möchet 22.00 europ Time also in den USA börsenende eine Querlinie haben .. kann das nicht einstellen - schade

lacsoncuong
14
lacsoncuong 2023.02.17 03:26 
 

rất tốt

are1971
747
are1971 2022.11.20 18:33 
 

Great indicator thank you for sharing free but You cant stack more than one indicator on a chart (using multiple indicator) or add more time lines and text on the lines please such as asian open/close euro open/close NY open/close (NY has two openings 08:20 am futures and 09:30 stocks and two close 13:30 pm(gold) and 16:00-16:15(stocks and futures))

M1_MeT4019
26
M1_MeT4019 2022.09.16 23:11 
 

ユーザーは評価に対して何もコメントを残しませんでした

HOGJoerch63
559
HOGJoerch63 2022.09.06 15:18 
 

very usefull tool. Thank you

Sebastian Schmidt
1359
Sebastian Schmidt 2022.08.01 18:20 
 

Good job, thanks for providing so many high quality indicators for free!!! A look is really worth it, very likely one or the other will accidentally find exactly what he was looking for a long time.

Mary Gomes
359
Mary Gomes 2022.06.29 06:00 
 

Amazing tool Been looking for one. Could you please add 1 more Option for Opening Line ? i want another line Open at New York local Time 9:30. I mean Your indicator Open 3 Lines Already and i Need 1 More lines can you make it 4 ? Like 4 Opening Price Lines That is all i am asking

Aurthur Musendame
92582
開発者からの返信 Aurthur Musendame 2022.06.29 10:57
What option for the opening line are you looking for
Marx-David
197
Marx-David 2022.06.10 14:28 
 

Very helpful. Thanks.

HikeX1985
55
HikeX1985 2022.06.02 09:00 
 

Thank You for this indicator!!! If can you add parametrs of style lines defoult dash to solid and if can continiue lines to next day, It would be great.

Aurthur Musendame
92582
開発者からの返信 Aurthur Musendame 2022.06.24 22:21
Thank you. Noted will do so
gdcuartasz
24
gdcuartasz 2022.04.27 12:21 
 

Thank you for the indicator. I'm using it every day!

Update 27/05/2022

I don't use indicators and I don't consider this an indicatore either. I have to say that it's the most useful and precise tool for my trading. This is the only thing I have in the charts apart from the market itself. Thank you again

Aurthur Musendame
92582
開発者からの返信 Aurthur Musendame 2022.06.24 22:22
Thank you
レビューに返信