适用于MetaTrader 5的EA交易和指标 - 46

Probability emerges to record higher prices when MACD breaks out oscillator historical resistance level. It's strongly encouraged to confirm price breakout with oscillator breakout since they have comparable effects to price breaking support and resistance levels; surely, short trades will have the same perception. As advantage, many times oscillator breakout precedes price breakout as early alert to upcoming event as illustrated by 2nd & 3rd screenshot. Furthermore, divergence is confirmed
FREE
The Round Level Indicator automatically draws psychologically significant price levels directly on your chart.
These round numbers often act as key support and resistance zones across all markets and timeframes.
Round Levels are used in my automated EA: Opal This indicator works best when combined with other tools and strategies, e.g.: Price Action Strategies
Round levels often align with key support/resistance. Use it with candlestick patterns (like pin bars or engulfing bars) to confirm high
FREE

The Rapid Reaper EA is a fully automated hybrid averaging EA that trades in sequences of lot increase and multiplication on both sides of the book. The system trades using market orders with take profits set across trade groups. This EA will work on any pair but works best on GBPUSD and USDCAD on the M5 timeframe. A VPS is advisable when trading with this EA. Check the comments for back test results and optimized settings. Please note: I have made the decision to give this EA away and many more
FREE
TripleWave Signal Indicator - 多时间周期趋势确认系统 是一个专业级交易系统。它能 同时分析 M15、H1、H4 三个关键时间周期 , 独家提供 经过三重确认的 最可靠 BUY/SELL 信号 。助您 永远不会错过 真正的高概率交易机会! 【推荐设置】 黄金 (XAUUSD) :当前默认设置即可直接应用。 【核心优势】 您将即刻获得: 强大的 多时间周期趋势分析引擎 。 图表上 清晰直观的 BUY/SELL/EXIT 视觉箭头 。 实时状态仪表板 ,市场概况一目了然。 弹出式和移动推送通知 ,交易信号绝不遗漏。 完全可定制 的参数(如 EMA 周期、颜色等)。 一次购买,享受终身免费更新服务 。 立即下载 TripleWave Signal Indicator , 停止追逐 那些烦人的错误信号! 开始 以更智能、更自信的方式进行交易,把握每一次盈利机会。
FREE

该指标基于“The Secret Mindset”YouTube 频道在视频中提出的策略 “经过 1 个月的价格行为交易,我发现了一种可靠的剥头皮策略” 视频中完整详细地解释了信号过滤的策略和条件。 * YouTube 频道创建者与此指标开发无关 信号应与其他指标相结合,并根据每个交易者的判断进行过滤
指标
在前一根柱线的高/低范围内的柱线,可以称为内柱线。 指标可以选择绘制这些条形图 两个连续的 inside bar 将创建一个通道,通常也用作支撑或阻力位
信号
指标可以在两种不同的模式下显示信号箭头: FAST: 信号 将重新绘制直到 bar 收盘,因此交易者应仅在信号 bar 已经关闭后,在下一个 bar 开盘时进场。 这允许在确认之前期待可能的下一个信号• 慢: 信号 不会重新绘制。 箭头 只有在信号栏已经关闭并确认通道中断后才会出现 条件: 购买: 当价格向上突破通道的上层时 卖出: 当价格向下突破通道的较低水平时 可选地,指示器将显示通道的所有信号或仅显示第一个出现的信号。
建议级别
止损:最后一个低点 当 买入 /最后一个高点当 卖出 止盈:1:1 到 1:
FREE

Auto BreakEven Pro is a lightweight, no-nonsense Expert Advisor designed to automatically move your Stop Loss to breakeven once your trade reaches a predefined profit level. This EA is ideal for traders who want to protect profits without constantly monitoring the charts.
Key Features: Automatically sets Stop Loss to break-even after a custom number of pips in profit. Optional break-even offset to lock in small gains (e.g., +0.5 pips). Compatible with any manual or automated strategy – simpl
FREE

Please check the " What's new " tab regularly for a complete and up-to-date list of all improvements + parameters. FREE indicator for my trading utility Take a Break . This indicator allows you to manage multiple other EAs with just one Take a Break EA instance. Simply specify the corresponding Chart Group in the indicator(s) and Take a Break EA settings and you are good to go.
Setup examples (Indicator + EA)
As a prerequisite, add the URL https://trading.custom-solutions.it to the list of al
FREE
解锁精准交易:ATR 动态枢轴系统 立即下载这款 免费 的 ATR Pivot Signals 指标,立即在市场噪音中占据优势。对于那些要求基于 真实市场摆动反转 而非猜测来确定高信心入场点的交易者来说,这是终极工具。 ATR Pivot Signals 系统是一款创新的技术指标,它利用 平均真实波动范围 (ATR) 动态过滤波动性,确保仅在价格出现统计学上显著的移动时才触发信号。它通过动态设置 反转阈值 来消除假突破,使其在所有市场条件下都有效——无论是平静的盘整还是爆炸性的趋势。 ATR 动态枢轴指标的关键特点: 动态、过滤噪音的反转: 使用可自定义的 ATR 因子 来调整反转阈值,使其适应当前市场波动性,忽略次要回调。 高信心信号: 直接在主图表上提供明确的 买入 (绿色)和 卖出 (红色)箭头,标记确认主要摆动枢轴的确切价格柱。 不重绘技术: 信号在K线收盘时确认并锁定。该指标采用防闪烁逻辑设计,确保对每个历史和实时信号的信任。 趋势识别: 清晰地跟踪市场状态(上涨/下跌趋势),为您提供简洁的视觉框架来确定方向偏差。 简单且高效: 易于安装,仅有两个关键输入参数可根据您的交易风
FREE

The expert "QuantumPip" is a fully automated expert which can trade several symbols from one chart. The expert also uses prices of Gold, Oil, "Schmuksie" (my adaptation of the "Dixie" indicator), DAX or FTSE to calculate inputs for the symbols. The expert uses 2 types of recurrent neural model - 1 network (decisions "buy" or "sell") and 2 networks (decisions "buy" or "uncertainty" and "sell" or "uncertainty"). QuantumPip can, therefore, trade 16 strategies as one, because it is 2 models per each
点击此处查看我所有免费产品
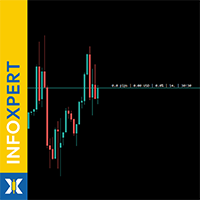
InfoXpert 是 款免费的智能工具,适用于 MetaTrader 5 ,可将所有关键交易数据直接显示在图表上 - 实时、清晰且精确。 你可以立即看到你的盈亏(以货币和百分比显示)、点差以及当前蜡烛的剩余时间 - 非常适合在活跃交易中快速决策。 所有元素都 完全可自定义 - 你可以决定显示哪些数据、使用哪些颜色,以及信息出现在图表的什么位置:上方、下方或紧贴价格旁边。 这样一来, InfoXpert 会适应你的风格,而不是让你去适应它。 凭借其 现代且极简的设计 , InfoXpert 成为你的轻量化交易信息面板 - 精确、高效,并且完全免费。 这是为重视清晰度、控制力和完美时机的交易者打造的必备工具。 InfoXpert 将功能性与风格相结合 - 为希望看到自己成功每个细节的交易者而设计。
规格 在图表上直接展示 关键交易数据 实时显示盈亏(货币与百分比)
显示点差
显示当前蜡烛剩余时间并带有倒计时
完全可自定义布局 - 选择你想显示的内容
灵活放置:顶部、底部、左侧、右侧或紧邻价格
可调节颜色、字体大小和样式 - 保证最佳可读性
即时实时
FREE

Scalping Trade Panel – Fast and Precise Trading Control for MT5
Scalping Trade Panel is a professional trading panel designed for MetaTrader 5, offering traders lightning-fast access to market and pending orders directly from the chart. Optimized for scalping strategies, it combines precision, speed, and simplicity in one compact interface.
Key Features:
Market Orders: Execute BUY and SELL orders instantly with a single click.
Stop Losses : You can add a stop loss for any market or pending
FREE
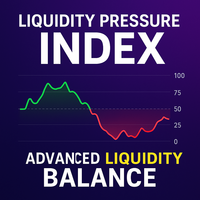
Liquidity Pressure Index (LPI) is an advanced technical indicator designed to uncover the hidden battle between buyers and sellers in the market. Unlike conventional oscillators that only rely on price movements, LPI integrates market depth (order book data), ATR-based volatility compression, and adaptive smoothing to give traders a deeper view of true liquidity dynamics.
By combining price action with volume absorption and order flow pressure, the LPI helps traders anticipate shifts in market
FREE

Relative Volume or RVOL is an indicator that averages the volume of X amount of days, making it easy to compare sessions volumes.
The histogram only has 3 colors:
Green - Above average volume
Yellow - Average volume
Red - Below average volume
The default setting is 20 days, which corresponds more or less to a month of trading.
In this version is possible to choose between tick and real volumes (if you are using a broker which offers future contracts)
With the data obtained from this in
FREE

EA可以通过搜索并平掉盈利仓位来平掉无利可图的仓位 。
该助手 在所有位置中 寻找 终端中 最 无利可图的位置 。 进一步地,通过搜索剩余的盈利头寸,他计算出当一个或多个头寸的 利润 大于另一个头寸的损失时可以弥补损失的一系列头寸。 如果找到一组此类头寸,顾问就会将其平仓。 一系列位置可以由任何位置组成。 它们的最大数量可以在顾问设置中调整。 您还可以指定搜索的最小损失和平仓的额外利润。 MT4版本
详细描述 如何购买
如何安装
如何获取日志文件 如何测试和优化 Expforex 的所有产品 您可以在策略测试器中测试 Expert Advisor,并在可视化模式下使用我们的 EAPADPRO 工具栏进行交易! 近减加加在图表上的工作原理 认为 您以 1.600 的价格开设买入 #1 仓位; 价格跌至 1.550 ,目前亏损 -50点; 盈亏平衡点(平均价格)= 1.600 ; 如果我们打开 SELL #2、Sell #3 和 Sell #4; EA 交易开始执行主算法。 那么总利润将为+5$; 智能交易系统 (EA) 激活算法,并且必须平仓
FREE

AlphaPrice MT5 is a trading Expert Advisor (EA) designed for the Forex market and other financial markets via the MetaTrader 5 platform. It is based on a price momentum trading strategy, allowing it to effectively capture strong price movements while minimizing risks during stagnant periods. The EA uses minimal settings, making it easy to set up quickly, and completely avoids risky methods such as martingale and grid strategies. Key Features: Momentum Trading – The EA analyzes market mom
FREE

AstroCycles: Advanced Financial Astronomy Indicator Overview AstroCycles is a sophisticated technical analysis tool developed for the MetaTrader 5 (MQL5) platform. It bridges the gap between orbital mechanics and financial market analysis by calculating precise astronomical cycles and visualizing them directly on your trading chart. Unlike standard indicators that rely on past price data, AstroMaster utilizes high-precision astronomical algorithms (Keplerian Elements and Brown’s Lunar Theory)
FREE

Market Hours Pro shows Tokyo, London, and New York trading sessions directly on your MT5 chart, including scheduled overlap periods. It’s designed to give you a clear view of global market timing so you can plan trades, spot high-activity periods, and align strategies with standard Forex hours. How It Works Displays scheduled session times visually on your chart. Highlights session overlaps for London/New York and Tokyo/London. Automatically adjusts times for your timezone or broker time. Shows
FREE

Are you tired of the slow, clunky, and uninformative default order panel in MetaTrader 5? Discretionary trading demands speed, precision, and above all, clear information. Clicking through multiple menus, dragging stops one by one, and lacking a consolidated view of your risk are barriers that cost you time and, most importantly, money. Professional trading requires professional tools. Trader Panel Alpha X Pro is the definitive solution. It's not just another "order ticket"; it's a complete trad
FREE

Gold AI Machine – Advanced Automated Trading System Gold AI Machine is a professional, fully automated trading robot developed exclusively for XAUUSD (Gold) .
The system is optimized for the M5 timeframe and is designed to capture high-quality short-term market opportunities using advanced artificial intelligence–driven logic and disciplined trade management. Key Features Optimized exclusively for XAUUSD (Gold) Recommended timeframe: M5 Recommended minimum capital: 200 units For 3-digit Gold
FREE
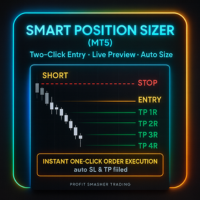
Smart Position Sizer (MT5) Two clicks to map risk, auto-size, and execute with SL/TP prefilled—fast, visual, broker-aware.
Built to work beautifully across Forex, Futures, Indices, Metals, and CFD symbols . Why traders love it (by market) Forex Spread-aware sizing (optional): include current spread in risk so your lot size targets net risk. Pip & 5-digit precision: correct pip math on majors/minors; handles mini/micro volume steps automatically. Side-price logic: uses bid/ask correctly for SL/T

The Smart FVG Statistics Indicator is a powerful MetaTrader 5 tool designed to automatically identify, track, and analyze Fair Value Gaps (FVGs) on your charts. Love it? Hate it? Let me know in a review! Feature requests and ideas for new tools are highly appreciated. :)
Try "The AUDCAD Trader":
https://www.mql5.com/en/market/product/151841
Key Features Advanced Fair Value Gap Detection Automatic Identification : Automatically scans for both bullish and bearish FVGs across specified histo
FREE

TRADE BOT X A trading bot for XAUUSD,GBPUSD,US-30 index. Risk levels can be adjusted using the coefficients, but also adjust the maximum drawdown as you increase the coefficients Advisable to use account sizes of USD 500 and above. Account types: Hedging accounts, Standard accounts are preferred i.e. no commissions, Use well regulated brokers eg ICMarkets. all this provides room for the strategy to work smoothly for stabilized results and removing the possibility of the model crashing. ADJUST
FREE
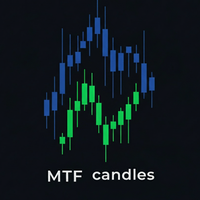
The MTF (Multi-Timeframe) Candles indicator is a powerful tool that allows you to display candles from a higher timeframe (e.g., H1, H4, D1) directly on a lower timeframe chart (e.g., M5, M15, M30). The Problem It Solves: Instead of constantly switching back and forth between charts to analyze the main trend and detailed price action, this indicator merges both perspectives into one. You can instantly see the "big picture" while staying focused on trading signals on your current timeframe. Core
FREE

MACD Support–Resistance Candle Analyzer — Professional This indicator enhances the classic MACD by combining momentum analysis with dynamic Support & Resistance detection , giving traders a clearer view of breakout strength and market structure. It transforms price action into color-coded MACD candles , highlights SnR break levels , and provides clean visual confirmation of trend continuation or reversal. Ideal for scalpers, intraday traders, and swing traders who rely on fast, structured trend
FREE

Volume at Price (VAP) VAP is a right-anchored Volume Profile Heatmap for MetaTrader 5 designed for clean, fast, and stable execution on any chart. It shows where trading activity clustered, not just when—so you can read balance/imbalance, spot value migration, and plan trades with precise references: VAH, VAL, and POC . What VAP shows Heatmap Profile (tick-volume):
A compact, right-anchored histogram that scales with the chart. Value Area (~70%) in Gold Non-Value in White Soft shadow gradient
Simple indicator to show Breakeven line for all orders on attached chart pair. This indicator also comes with additional information such as Total Lot Size, Floating Drawdown in account's currency and Number of open positions and Difference from current price in Points. Do you use DCA (dollar cost average) or Hedging approach on your trading? Then this indicator you MUST have. Really useful, when you have multiple orders (hedging), this can help you quickly identify breakeven point without calc
FREE
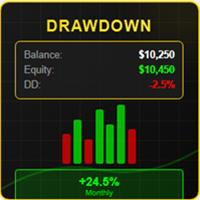
# 回撤指标 V4.0 - 掌控交易的必备工具
## 通过完整的实时绩效概览改变您的交易
在要求严苛的外汇和差价合约交易世界中,**了解您的实时绩效**不是奢侈品,而是**绝对必需**的。**回撤指标 V4.0** 不仅仅是一个简单的指标:它是您的**专业仪表板**,为您提供清晰、精确和即时的交易账户状态视图。
---
## 为什么这个指标将永远改变您的交易
### 90% 交易者面临的问题
您是否曾经遇到过以下情况之一?
**您不确切知道自己的状况** - 您的 MT5 平台显示数字,但您必须心算您的真实表现。
**您发现回撤为时已晚** - 当您意识到已经损失了 15% 的资金时,已经太晚了,无法有效应对。
**您缺乏历史可见性** - 无法快速知道本周、本月或今年是否盈利。
**您浪费时间分析交易** - 您必须打开多个窗口、进行计算,并失去对市场的关注。
**您没有概览** - 有多少持仓?我的全局盈亏是多少?我今天的表现如何?
### 解决方案:一体化专业仪表板
**回撤指标 V4.0** 通过提供一个**完整的控制面板*

MULTI INDICATOR SCANNER - PROFESSIONAL EDITION
PRODUCT DESCRIPTION
Multi Indicator Scanner is the most comprehensive technical analysis scanner on the market. It analyzes 10 different indicators simultaneously and provides you with clear BUY-SELL-NEUTRAL signals. No more checking dozens of indicators one by one!
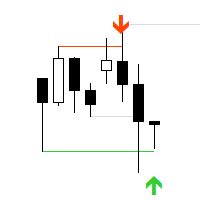
"AV Stop Hunter MT5" is an indicator for MetaTrader 5, which draws entry arrows for long and short after so-called Stop Hunt candles and has several notifications about them. Since this is a smart money concept , the periods H1 and H4 are the best. Increasing volume improves the signal, lines and arrows are then thicker. The MQL5 variant has colored stop-hunting candles. NEW: Signal Buffer: 1, 0 or -1
Definition :
Stop hunting, also known as stop running, is the practice of institutional trad

super trend version is to help you to have real time view of market move it will help you to get a live view of current market buy signal line and arrow to help you understand batter the direction sell signal line and arrow to help you understand batter the direction trade what you see not what you think this is an simple and best trading tool for our traders of any market crypto gold
FREE

Rambo Bitcoin Bot – M15 Timeframe, optimized for Exness and compatible with other brokers that offer competitive spreads and stable trading conditions.
This algorithm operates on BTC/USD in the M15 timeframe, focusing on structured and selective entries rather than high-frequency or aggressive compounding. It maintains controlled exposure and aims for steady long-term growth. The equity curve shows a stable upward trajectory with an approximate slope between 28 and 35, indicating progressive

This is an advanced multi-timeframe version of the popular Hull Moving Average (HMA) Features Two lines of the Hull indicator of different timeframes on the same chart. The HMA line of the higher timeframe defines the trend, and the HMA line of the current timeframe defines the short-term price movements. A graphical panel with HMA indicator data from all timeframes at the same time . If the HMA switched its direction on any timeframe, the panel displays a question or exclamation mark with a tex

AEGIS Account and Drawdown Protector
AEGIS is an EA for MT5 that protects your trading account from large losses. It monitors equity in real time and closes all positions instantly when user-defined limits are reached. Limits can be set as percentage or fixed currency.
AEGIS also includes daily drawdown and daily loss protection with automatic reset at a chosen timezone . This is especially useful for prop firm traders where the daily cycle follows broker server time.
Additional protection

Greetings to all Forex trading enthusiasts! Today I want to share the story of how our unique trading advisor was created, which combined two time-tested strategies – Sniper and Spider. This project was the result of many years of experience and close cooperation with a talented programmer. The idea was born from the desire to create something truly effective and universal. We took our favorite strategies as a basis and decided to combine them in one trading advisor. The task was not an easy on

Osmosis is an advanced data driven automated trading robot which uses dynamic price differential algorithm and market volume to trade retracement on Gold (XAUUSD) . The price differential algorithm identifies various possible prices of execution, simultaneously pends and modifies orders until it gets the best possible price of execution. This makes the EA to use a flexible and dynamic execution conditions which depends on price action unlike other regular trading robots that use fix entry condi

50% Off Today Only! Price Goes Back Up at 11 PM (EST)
Marketkeys Trade Manager EA for MT5: Your Pathway to Forex Trading Mastery
What Traders Are Saying: "Much better than lots of other trade managers I've tested..." – R Vdr "Saves me time from manually calculating lots sizes and risks...amazing support." – Richard Obi Efficiency and precision are paramount in Forex trading. Marketkeys Trade Manager EA for MT5 offers just that - a seamless interface combined with robust risk management tools.

Main: Not martingale, not a grid, working on all symbols; a good rational algorithm; Work of two indicators: Parabolic Sar and Moving Average (you can set a separate Timeframe for each indicator); There is a good money management system (there are several type for trailing stop loss); EA can work on closed candles, and on current candles; Quickly optimized (the work is maximally accelerated). Very well optimized for EURUSD . Current sets after optimization are in comments. Version MT4: https://

Ping:您可靠交易的必备工具 您的互联网服务提供商和VPS都承诺连接稳定,但您真的能相信他们吗?在这个分秒必争的世界里,缓慢或不稳定的连接可能导致错失利润或遭受损失。 Ping 允许您: 做出明智的决定 :直观地比较不同VPS服务器和经纪商的速度,为您的策略选择最快、最可靠的连接。 排除风险 :特别适用于剥头皮交易者和高频交易者,因为订单执行速度直接影响结果。 识别问题 :快速发现您的互联网或VPS何时出现故障,并在影响您的交易之前做出反应。 无妥协地工作 :我们的脚本可在任何图表和时间框架上运行,且不与智能交易系统冲突。它旨在尽可能方便和不引人注目。 Ping脚本是专为MetaTrader 5终端设计的个人连接速度和可靠性监控器。它会立即显示您与经纪商服务器的当前ping值,让您始终根据精确的数据做出决策。 简单而有效。 安装只需几秒钟:只需将脚本拖放到任何图表上即可。不再需要复杂的设置。 不要让不稳定的连接影响您的交易。购买Ping,完全掌控您的速度。 截图和视频描述 1. 三张截图 — 一个证明:速度就是一切 这三张截图清晰地展示了为什么我们的Ping脚本是专业交易者的必备工具

Golden Star MT5 是由一群专业交易者开发的MT5平台专业趋势指标。 其工作算法基于原作者的方法,它允许以高概率找到潜在的趋势反转点,并在趋势形成之初接收信号进入市场。 该指标适用于外汇上的黄金、加密货币和货币对。 警报系统(警报、电子邮件和移动通知)将帮助您同时监控多个交易工具。 您只需要在图表上安装指标,当指标信号出现时,就会触发警报。 使用我们的警报系统,您绝不会错过开仓信号! 使用 Golden Star 指标进行交易非常简单:如果指标线为绿色,则我们建立买入头寸。 如果指标线为红色,则开一个卖出头寸。
通过购买该指标,您将获得: 优秀的指标信号。 免费产品支持。 定期更新。 以各种方式接收信号的能力:警报、电话、邮件。 可用于任何金融工具(外汇、差价合约、期权)和期间。 指标参数 Period indicator - 指标计算周期。 Alerts on? - 启用/禁用通知。如果为真 - 启用,假 - 禁用。 Display messageas - 启用/禁用警报。如果为真 - 启用,假 - 禁用。 Send emai l - 启用/禁用发送电子邮件。

Light Venus - Adaptive Grid Profit Maximizer *Users are encouraged to share their set files that have performed well in the comments section. Why Choose Light Venus? Master the Grid Strategy : Harness the power of grid trading, where orders are strategically placed at calculated intervals. This method allows you to profit from market fluctuations without being glued to your screen. Profit with Precision : Define your profit goals, and let Light Venus handle the rest. Its intelligent system clo
FREE

Gold TL MTF - this is a fine stock technical indicator. The indicator algorithm analyzes the movement of the asset price and reflects trend lines along the fractals of a specific timeframe (TF).
Benefits of the indicator: The indicator produces signals with high accuracy. The confirmed signal of the indicator does not disappear and is not redrawn. You can trade on the MetaTrader 5 trading platform of any broker. You can trade any assets (currencies, metals, cryptocurrencies, stocks, indices e
FREE

一目均衡表策略EA MT5 是一款专为MetaTrader 5设计的先进工具,通过利用一目均衡表指标的强大功能,自动化基于六种不同策略的交易进场和出场,简化交易活动。该EA支持在关键区域内的反向交易设置,提供灵活的交易管理方式。经过广泛回测,它提供精确的进场方法、灵活的出场规则和高级风险管理,占用最少的系统资源以实现高效的交易执行。 该系统包括用于控制交易时段的日期/时间过滤器,并支持历史数据测试以验证性能。实时仪表板显示开放交易、账户净值和系统指标,而直观的输入菜单使配置变得简单。所有设置均提供详细文档。 有关详细文档: 常规设置/输入指南 | 指标设置/输入指南 | 回测和设置文件 您可以在这里下载MT4版本: 一目均衡表策略EA MT4 主要功能: 一目均衡表交易系统,参数(转换线、基准线、先跨度)完全可定制 支持多个时间框架,交易灵活 多种风险管理选项:止损、止盈、跟踪止损 高级仓位规模管理和回撤保护 时间/日期过滤器,控制交易时段 实时监控仪表板 弹出窗口、电子邮件和推送通知 与MQL5 VPS兼容,支持24/7运行 一目均衡表策略: 基准线交叉策略 :当价格上穿基准线,转换

Gold Breakout PRO-P - 黄金和外汇精准突破交易 以无与伦比的精准性和安全性掌握市场 Gold Breakout PRO-P 是一个尖端的专家顾问(EA),专为在 XAUUSD(黄金)市场上称霸而设计,同时在 EURUSD 等外汇货币对上表现出色。专为自营交易公司交易者、零售投资者和算法交易爱好者设计,这款 EA 利用复杂的突破策略,结合拒绝确认、流动性扫单检测和动态风险管理。在回测中证明了 91% 的胜率和高达 66 次连续胜利, Gold Breakout PRO-P 将机构级性能与用户友好型定制相结合,成为利用黄金价格动能驱动的终极工具。 设置文件: t.me/+kZTatI6tFXhlZGU0
促销价: 仅 $99.00,仅限下 10 次销售,下次价格 $259.00 — 抓紧时间! Gold Breakout PRO-P 的工作原理 Gold Breakout PRO-P 利用高概率突破策略,结合先进的确认技术: 构建突破框: 在用户定义的时间窗口内分析价格行为,设置高点和低点突破水平。 放置挂单: 在突破框结束时(例如,格林尼治Stuart 06:05)

Meet ACE VEX! --- Your Spike-Sniffing Market Detective! ️️ Alrighty then! Step right up, ladies and gentlemen, and meet the WILD, most efficient trading animal the market has ever seen! This is -- ACE VEX! -- This beauty is just like me: NO boring, average Expert Advisor here. ACE VEX doesn't trust regular candles; he's a volatility-sniffing, grid-throwing detective who treats every bar like a suspect and only trades the ones that SERIOUSLY MISBEHAVE! --- Picture this: Instead of just ha

Full implementation of Directional Movement System for trading, originally developed by Welles Wilder, with modifications to improve profitability, to reduce the number of unfavorable signals, and with Stop Loss lines.
No re-paint
Features
Buy/sell signals displayed on the chart Stop levels visually indicated on the chart Profit-taking points presented in the indicator window Exit points for unfavorable positions presented in the indicator window Signal confirmation through high/low swing cros

Wyckoff fans, enjoy!
Ideally to be used with the Weis Waves indicator, but it can be easily used alone, the Waves Sizer puts the range (in resulting Price movement) done by the Price on its market swings. You can control how accurate or loose will be the swings. This tool is very helpful for visually know how much the Price has traveled in your Timeframe. This way you can confront this level of effort with the resulting Volume, etc... Weis Waves indicator:
https://www.mql5.com/en/market/produc
FREE

Gold Trump EA – The Ultimate Grid Trading Powerhouse Dominate the Markets with a Smart, Adaptive, and Highly Customizable EA! Join Our Telegram Group! First, enter the group Join Here
Then, access the main section Go Here In this channel, you can chat with other traders and download the full PDF guide with all the details about this EA. Join now and stay updated Hey everyone! I'm working on a new version of Cristoforo Gold , and it’s almost ready for release! For the first 10 customers ,
The RFOC Candle Timer 2x was created for the trader to locate himself in time, having access to the pending time for the formation of a new candle. Additionally, it is possible to include in the chart a second timer that shows the pending time for the formation of a new candle in a time period different from the current one. The user will have the option to select up to 4 different positions for the timer display ("No candle", lower left corner, lower right corner or upper right corner). In ad
FREE

Unlock Enhanced Stability and Superior Returns with Our Latest Expert Advisor
Hello! We're a dedicated team of experienced traders and developers with over a decade of combined expertise in the forex markets. Building on our success and continuous market analysis, we've significantly enhanced our trading algorithm to deliver even more stable and profitable performance. Introducing Nexus MultiCurrency EA v3.0—our most advanced iteration designed to maximize your trading potential while maintainin

Gold Rush EA Lite — Advanced XAUUSD Trading System for MT5 This is the Lite version of Gold Rush EA.
It has limited features compared to the full version:
– Runs only on XAUUSD M15
– Maximum lot size capped at 0.10 Key Features Specialized for Gold (XAUUSD) — Optimized to exploit gold’s volatility and liquidity. Multi-Timeframe Confirmation — Signal timeframe (default H1) with execution on lower timeframe (default M15). ARM → TRIGGER → EXECUTE Workflow ARM : Detect overbought/oversold extreme
FREE
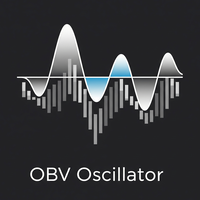
Overview The OBV Oscillator is a custom technical indicator for MetaTrader 5, designed to provide a clearer visualization of On Balance Volume (OBV) by transforming it into an oscillator. This indicator aims to assist traders in identifying trend confirmations, potential reversals, and momentum shifts by analyzing the relationship between price and volume. It features a customizable Moving Average (MA) for smoothing the OBV, a signal line for generating crossover signals, and an alert system to
FREE

This indicator scans for you up to 15 trading instruments and up to 21 time frames for occurrences of the high probability reversal patterns: Double Tops/Bottoms with fake breakouts . What this indicator detects: This indicator detects a special form of Double Tops and Bottoms, so called Double Tops/Bottoms with fake breakouts . For double tops with fake breakouts the highest price of the right shoulder must be higher than the left shoulder. For double bottoms with fake breakouts the lowest pric
Free Until 1st Jan 2026
VWAR 2.2 (Volume Weighted Average Roadmap) is an advanced institutional-grade MT5 indicator that brings you the most powerful multi-timeframe VWAP (Volume Weighted Average Price) analysis—plus filtered trade signals using robust trend and momentum confirmations. Key Features: Multi-Timeframe VWAP Lines:
Plots Daily, Weekly, and Monthly VWAP levels for instant market structure insight. Dynamic Buy/Sell Signals: Big, bold colored arrows indicate confirmed buy or sell opp
FREE

MSX Unified Hybrid EA — Lite Version MSX Unified Hybrid EA (Lite) is a free demonstration Expert Advisor designed to showcase the core internal hybrid trend engine used in the MSX trading systems. This Lite version focuses on entry and exit behavior only , allowing users to observe how the strategy reacts to real market conditions without advanced money management or capital protection features. ️ Core Strategy Logic The Expert Advisor operates using an internally coded hybrid trend engine ,
FREE

This indicator is a professional tool designed to plot the Daily Open Line and instantly shade the bullish and bearish price zones around it. Instead of leaving traders guessing, it delivers a clear visual map of market sentiment from the very first of the day. Its goal: to help you instantly identify whether the market is trading above or below the daily open — a key reference point for intraday strategies.
The indicator automatically draws a horizontal line at the daily open price and shades
FREE

Presentation
Another indicator that makes scalping on tick charts easier, it displays an Heiken Ashi graph in Ticks.
It allows to detect entry points and trend reversals. Recommended number of ticks in a candle : 5, 13 or 21.
Parameters Ticks in candle: Number of ticks in a candle (default 5), Displays Trend arrows : displays a trend arrow based on EMA8 and EMA20 crossing, Displays MM50, Displays MM100, Max Candle (CPU): number of candles max to manage, low value will save ressources of your
FREE

动态 CMF 计算: 自定义 蔡金资金流 (Chaikin Money Flow, CMF) 的周期,以微调您的分析并最大化信号精度。 直观的颜色编码警报: 通过清晰的视觉提示,即时解读市场状况: 绿色警报: 表示处于 超买 区域 – 预示着潜在的卖出机会。 红色警报: 表示处于 超卖 区域 – 暗示着潜在的买入机会。 灰色警报: 代表 中性 区域 – 信号是等待确认的趋势或反转。 自动背离检测: 轻松揭示隐藏的市场转折点。我们的系统 自动发现 价格和动量之间的 背离 ,帮助您预测重要的反转。 整合真实成交量: 通过切换到 真实成交量选项 来增强信号准确性,确保您的交易决策基于最可靠的市场数据。 --------------------------------------
FREE

Moving Average RAINBOW Forex traders use moving averages for different reasons. Some use them as their primary analytical tool, while others simply use them as a confidence builder to back up their investment decisions. In this section, we'll present a few different types of strategies - incorporating them into your trading style is up to you! A technique used in technical analysis to identify changing trends. It is created by placing a large number of moving averages onto the same chart. When a
FREE

Safe Trader Advanced —— 高级尖峰捕捉EA,具备独特风险管理,确保稳定安全交易 Safe Trader 结合了尖峰检测算法与资本管理框架,在波动市场中实现精准与保护。 它专为捕捉和交易市场尖峰而设计,具备高精度与一致性。不同于依赖不稳定信号或过度优化设置的常见机器人,Safe Trader 拥有独特的风险管理核心,确保每一笔交易都在受控且预先设定的风险参数下执行。 牢不可破的风险管理: Safe Trader 内置资本保护系统,不仅能自动控制风险敞口,还能防止因手动配置错误而突破安全限度。 最小化输入: 唯一可调参数是每笔交易的风险百分比,其余所有关键数值由EA保持在最佳和安全区间。 推荐风险百分比设置: 低风险: 0.3 标准风险: 0.6 高风险: 0.9 集成安全机制: 如果用户设置的风险超过推荐阈值,EA 将自动避免入场,确保账户免受过度风险影响,保持长期稳定。 无需外部依赖: 完全自主运行,无需外部API或第三方服务器,稳定、快速且可靠。 广泛实盘测试: 在2025年连续超过8个月的实盘和前向测试中表现优异,在受控风险下实现持续盈利。 用户友好体验: 适
This indicator is the mql version of the Linear Regression Candles indicator. There are many linear regression indicators out there, most of them draw lines or channels, but this one actually draws a chart.This script includes features such as linear regression for open, high, low, and close prices, signal smoothing with simple or exponential moving averages. Find out more here: https://www.mql5.com/en/users/rashedsamir/seller I welcome your suggestion for improving the indicator
To incre
FREE

Infinite Storm EA is a safe and fully automated expert advisor that analyzes market trend and price movements and thanks to that is able achieve high rate of winning trades. Every order has StopLoss (either real or virtual) and EA has implemented advanced filtering functions together with spread and slippage protections. This EA does NOT use any of the dangerous strategies like Martingale, Grid or Arbitrage. This EA is fully customizable by user. This EA is not limited by trading pair or time
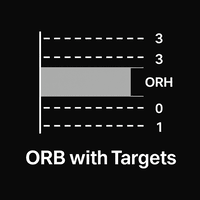
Opening Range Breakout Pro Professional ORB Session Indicator for MT5 Opening Range Breakout Pro is a highly visual, fully customizable Opening Range Breakout (ORB) indicator for MetaTrader 5, designed for intraday, session-based, and prop-firm traders . The indicator automatically plots the Opening Range High and Low , along with multiple target levels above and below the range , allowing traders to clearly visualize breakout zones, retests, and profit objectives directly on the chart. This too

Bitcoin Rocket Pro AI Robot EA is a highly advanced automated trading system for MetaTrader 5, specifically developed for intraday trading on the BTCUSD pair. It integrates a powerful combination of Elliott Wave theory, harmonic pattern detection, artificial intelligence, and machine learning algorithms to deliver accurate trade signals and intelligent position management. At the core of Bitcoin Rocket Pro AI is its multi-layered analysis system. The EA uses Elliott Wave principles to map the na
RSI + Grid Distance Strategy with 200 EMA Filter Overview The RSI + Grid Distance Strategy integrates momentum and mean-reversion principles within a structured grid trading framework. By combining the Relative Strength Index (RSI) with dynamic grid levels and a 200-period Exponential Moving Average (EMA) filter, the system seeks to optimize trade timing, trend alignment, and overall position efficiency. Core Logic 1. RSI Signal Generation
The algorithm utilizes a 17-period RSI , identifying b
“Step Channel Momentum Trend” 指标 (MT5 Indicator) Step Channel Momentum Trend 是一款强大的基于动量的指标,旨在为交易者提供适应性的优势,通过将市场结构与动态波动性分析相结合。这个工具帮助你清晰地区分趋势与区间,而不依赖于容易出现滞后的平滑技术,采用独特的阶梯中线和ATR过滤通道。 主要功能 结构性阶梯中线 系统的核心是一条仅基于确认的价格枢轴的“阶梯”中线。 仅在确认新的高点或低点时重新计算,因此避免了不必要的滞后,能够即时反应市场结构的变化。 这种逐步方式创建了清晰的区域变化,并使您保持在价格现实中,而不是被指标噪声干扰。 中线指出近期多头和空头之间的平衡,作为方向、突破或回调的可靠参考点。 动态波动性区间 上下通道边界使用平均真实波动范围 (ATR) 设置,灵活适应当前的波动性。 边界在活跃市场中扩展,在平静时期收缩,确保仅重要的价格扩展被标记为高动量事件。 价格在通道内 = 低动量(区间)。价格在通道外 = 突破趋势,立即在您的图表上可见。 动量驱动的蜡烛颜色 蜡烛的颜色不仅是装饰 — 它们是实时动量
FREE

Echelon EA – Chart Your Unique Trading Constellation Like the celestial guides that lead explorers through the vast universe, Echelon EA empowers you to create and optimize your very own trading strategies. This versatile system combines advanced grid and martingale techniques with cutting‐edge indicators, offering you an endless palette for designing a strategy that is truly your own. Craft Your Personal Strategy: Infinite Possibilities – Customize every parameter to build a trading system t
FREE

Multitimeframe Viewer HiddenEdge – HTF Realtime MiniChart A clear view of higher-timeframe structure — directly inside your main chart.
No need to switch timeframes anymore. HiddenEdge Multitimeframe Viewer shows the last candles of any higher timeframe in a compact, real-time panel — so you can see the bigger picture while staying focused on execution. Key Features Realtime update: the current higher-timeframe candle is drawn live, updating every second. Select how many candles to display:
FREE

We often need to know the sudden change in trend that happens on the graph and this can be confirmed through indicators.
This indicator shows the moments of trend reversal and how in which trend the price is shifting.
Custom background, no need to configure the colors in the chart, just drag the indicator!
Indication with arrows.
- Blue arrow: Upward trend.
- Pink Arrow: Downward Trend.
NOTE: Free indicator, support may take a while to respond.
FREE

ADR, AWR & AMR Indicator: Comprehensive Trading Guide Try "Average Daily Range Scalper":
https://www.mql5.com/en/market/product/154469 Core Concepts ADR (Average Daily Range) Definition : The average distance between daily high and low prices over a specified lookback period (typically 14-20 days) Purpose : Measures daily volatility expectations, identifies range-bound versus trending days, sets realistic intraday profit targets Key Insight : Markets tend to respect their average volatility - d
FREE

Stochastic RSI makes a stochastic calculation on the RSI indicator. The Relative Strength Index (RSI) is a well known momentum oscillator that measures the speed and change of price movements, developed by J. Welles Wilder.
Features Find overbought and oversold situations. Sound alert when overbought/oversold level is reached. Get email and/or push notification alerts when a signal is detected. The indicator is non-repainting. Returns buffer values for %K and %D to be used as part of an EA. (se
FREE
您知道为什么MetaTrader市场是出售交易策略和技术指标的最佳场所吗?不需要广告或软件保护,没有支付的麻烦。一切都在MetaTrader市场提供。
您错过了交易机会:
- 免费交易应用程序
- 8,000+信号可供复制
- 探索金融市场的经济新闻
注册
登录