MetaTrader 5용 Expert Advisor 및 지표 - 46

The Pulse 은 축적 기간을 실시간으로 보여주는 지표입니다.
간단히 말해서,축적은"스마트 머니"가 시장에서 강력한 움직임을 시작하기 전에 조용히 자산을 수집 할 때입니다.
차트에서는 가격이 한 범위에"붙어"있는 것처럼 보입니다. 이것은 축적 단계입니다—누군가가 큰 움직임을 준비하고 있습니다.
그리고 이러한 순간을 알아 차리는 법을 배우면—시장이"동결"하는 것처럼 보이지만 동시에 긴장이 느껴질 때-적절한 시간에 적절한 장소에있을 수 있습니다.
축적 기간을 결정하는 것은 적절한 순간을 기다릴 수 있다는 것을 의미합니다.
The Pulse 표시기는 축적 기간을 나타내며 축적 가격은 원하는대로 움직일 수 있지만 대부분의 경우 움직임은 측면입니다 The Pulse Blog. The blog: Why every trader should have The Pulse indicator as an additional tool for trading. Version mt4
축적 기간은
The EA opens and closes new orders on time. It can be used to implement trading scenarios of any complexity by creating a list of tasks. There are two options for completing the task The task is executed on the specified date and time - it is executed once and is removed from the list. The task is executed with repetition on the specified day of the week and time - the task with repetitions is not removed from the list. Panel settings Symbol - select the symbol for the trade function. Time -
Trade donchian breakouts with complete freedom. This EA can trade any breakout period, any timeframe, with pending or market orders- as desired- and implements many other useful features for the exigent trader, like customizable trading sessions and week days, a martingale mode and inverse martingale mode. [ Installation Guide | Update Guide | Troubleshooting | FAQ | All Products ] Easy to use and supervise Customizable trading direction Customizable donchian breakout period It can trade using
FREE

EA는 수익성 있는 포지션을 검색하고 마감함으로써 수익성 없는 포지션을 마감할 수 있습니다 .
이 조수는 모든 직위 중에서 터미널에서 가장 수익성이 낮은 직위를 찾습니다 . 또한, 나머지 수익성 있는 포지션을 검색하여 하나 이상의 포지션의 이익이 다른 포지션의 손실보다 클 때 손실을 보상할 수 있는 일련의 포지션을 계산합니다. 그러한 포지션 세트가 발견되면 고문은 해당 포지션을 닫습니다. 일련의 위치는 절대적으로 모든 위치로 구성될 수 있습니다. 최대 수는 조언자 설정에서 조정 가능합니다. 검색 시 최소 손실 금액과 마감 시 추가 이익을 지정할 수도 있습니다. MT4 버전
전체 설명 구입 방법
설치하는 방법
로그 파일을 얻는 방법 테스트 및 최적화 방법 Expforex의 모든 제품 전략 테스터에서 Expert Advisor를 테스트하고 시각적 모드에서 EAPADPRO 도구 모음을 사용하여 거래할 수 있습니다! 차트에서 Cl
FREE

One of the best tools for analyzing volume,
Weis Wave was idelized by David Weis, to facilitate the reading of directional flow. For the VSA method disciples it is an evolution of the practices created by Richard Wycoff, facilitating a predictive reading of the market, always seeking an accumulation and distribution of the negotiated contracts.
Cumulative wave volume Range of wave ( removed) Average Wave volume Ref "Tim Ord lectures" ( removed)
FREE

This expert advisor opens trades based on a combination of signals from the Envelopes, DeMarker, MACD, and RSI indicators. It also includes a time filter, restricting trades to between 1:00 AM and 11:00 PM broker time. A trade will be closed if an opposite entry signal is generated, the 32-period ATR crosses above 0.0015, a fixed Stop Loss of 2000 pips is hit, or a fixed Take Profit of 8000 pips is hit. The input parameters include a fixed stop loss of 2000 pips, a fixed take profit of 8000 pip

Moving Averages Bot with ATR – A Comprehensive Trading Tool .
Very RARE POWERFUL AND UNIQUE moving averages BOT that incorporates ATR with Stop Loss, Take Profit Multiplier. Multiple Time Frames and a lot more.
This Bot is an impressive automated trading system that combines the simplicity of moving averages with the dynamic adaptability of the Average True Range (ATR).
Designed to enhance trading strategies by offering a balanced mix of trend-following techniques and risk manag

The Gold Scalper EA is a precision-engineered expert advisor designed to dominate the XAUUSD (Gold) market through smart support and resistance-based scalping. Built with a clean, simplistic and minimalistic trading logic without any overcomplicated jargon that most EAs try to advertise, this Gold scalping robot executes high-probability breakout trades with surgical accuracy using simple basic support and resistance trading while keeping drawdowns minimal and protecting your capital at all time

It predicts the most likely short-term price movement based on advanced mathematical calculations.
Features Estimation of immediate price movement; Calculation of the real market trend; Calculation of the most important support and resistance levels; Algorithms optimized for making complex mathematical calculations with a minimal drain of system resources; Self-adjusting for better performance, so it’s able to work properly at any symbol (no matter how exotic it is) and any timeframe; Compatibl
FREE

MT5 Smart Dashboard is the ultimate tool for manual traders who want speed and automatic risk management. It transforms your chart into a professional trading station with a clean dark theme. Key Features: Fast Execution Panel: Open Buy and Sell trades instantly. Place Pending Orders (Limit & Stop) with one click. Adjust Lot Size and Price easily via buttons (+/-). ️ Automatic Risk Management: Auto Break-Even (BE): Moves your Stop Loss to the entry price automatically
FREE

The Horse Signal 1.26 – Price Action AI Indicator for Gold & Forex Overview: Start your 2026 trading year with "The Horse Signal," the latest precision tool from the WinWiFi Robot Series. Designed specifically for traders who demand high-accuracy entries, this indicator utilizes advanced Price Action analysis combined with an AI scanning algorithm to identify high-probability reversal and trend continuation points in real-time. Key Features: Dynamic Price Action Scan: Automatically analyzes can
FREE

Close Manager MT5로 거래 종료 프로세스를 최적화하세요. 이 강력한 전문가 어드바이저(EA)는 MetaTrader 5에서 수동 또는 다른 EA에 의해 열린 거래의 출구를 자동화하도록 설계되었으며, 트레이더에게 출구 전략에 대한 정밀한 제어를 제공합니다. MQL5, Forex Factory, Reddit의 r/Forex에서 다양한 맞춤형 종료 기준으로 높은 평가를 받고 있으며, 이 EA는 외환, 지수, 암호화폐와 같은 변동성이 큰 시장에서 스캘퍼, 데이 트레이더, 스윙 트레이더들 사이에서 인기가 많습니다. 사용자들은 수동 거래 관리 시간이 30-50% 감소하고 리스크 관리가 개선되었다고 보고하며, 많은 이들이 엄격한 출구 규칙을 준수함으로써 수익성이 향상되었다고 언급합니다. Close Manager MT5는 지속적인 모니터링 없이 리스크 관리와 출구 효율성을 최적화하려는 트레이더에게 이상적이며, 초보자와 숙련된 트레이더 모두 다양한 거래 전략을 지원합니다. Close Ma
FREE
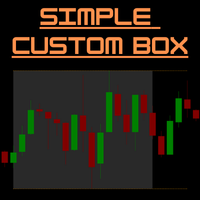
SimpleCustomBox – MT5 세션 박스 및 고가/저가 라인 표시기 개요:
SimpleCustomBox는 MetaTrader 5용으로 설계된 강력하고 사용하기 쉬운 트레이딩 인디케이터입니다.
차트에서 특정 거래 세션을 시각적으로 강조 표시할 수 있으며, 사용자가 원하는 시간대를 설정하고 해당 세션의 고가와 저가를 즉시 확인할 수 있습니다.
명확한 시각적 경계선을 통해 더 스마트한 거래 결정을 내릴 수 있습니다.
데이 트레이더, 스캘퍼 및 단기 가격 패턴을 중시하는 모든 트레이더에게 적합합니다. 주요 기능: 사용자 지정 세션 시간: 차트에서 임의의 시간대(예: 02:00 – 06:00)를 색상 직사각형으로 강조 표시. 동적 세션 박스: 매일 자동으로 업데이트되며, 과거 여러 거래일을 표시하여 히스토리 분석 가능. 고가/저가 라인: 세션 범위의 상단과 하단 라인을 그리며, 사용자 지정 시간(예: 14:00)까지 연장 가능. 시각적 사용자화: 박스 색상, 라인 색상, 두께, 스

Expert Advisor designed for trading Engulfing Candle Patterns within a manually input price range the D point of harmonic patterns , gartley , bat cypher butterfly ect.
How Does It Work
Step 1 Identify a price range around the end point D of your harmonic pattern. Input two prices into the EA settings Inp9 Upper Level- type the highest price where an engulfing candle pattern can occur. Inp9 Lower Level - type the lowest price where an engulfing candle pattern can occur. Step 2 inp11_blockID
FREE

B.W.S Ai 기반 플러그 앤 플레이: 1개의 30 Logic으로 MT5 Boom 및 Crash EA의 힘 발휘 업데이트된 버전의 경우 참고: 1. 구매를 완료하신 후 링크에 가입하세요: https://t.me/ +_dW7fNhLMMs5YzE8 2. 결제 증빙을 제시하고 제한 없이 무제한 버전을 받으세요. 소개:
금융 거래의 세계는 끊임없이 진화하고 있으며 고급 기술의 출현으로 거래자는 이제 전략을 자동화하고 거래 경험을 향상시킬 수 있는 강력한 도구에 액세스할 수 있습니다. 상당한 인기를 얻은 도구 중 하나는 Deriv Boom 및 Crash EA용 B.W.S Ai 기반 플러그 앤 플레이 시스템입니다. 이 혁신적인 솔루션은 인공 지능과 포괄적인 거래 논리 세트를 결합하여 변동이 심한 호황 및 폭락 시장에서 거래자에게 비교할 수 없는 이점을 제공합니다. 이 기사에서는 B.W.S Ai 기반 플러그 앤 플레이 시스템의 기능, 이점 및 기능을 살펴봅니다. MT5 호황 및 폭락 시장
FREE
Introducing the BB Trader EA, an advanced trading tool harnessing insights from the Bollinger Band indicator. This expert advisor strategically makes use of the upper and lower bollinger bands. Key Features: Flexible trade options: Set the maximum number of trades for single or multiple entries. Optional ATR-adjusted system: Manage multiple trades while dynamically making adjustments for volatility. Versatile grid lot sizing: Choose between static or automatically increasing (non-martingale) op
FREE

This indicator creates a Renko-based custom symbol in MetaTrader 5. Renko charts are built using price movement only, not time, making them useful for analyzing trends and filtering noise. Features Customizable brick size in points. Option to calculate brick size using ATR (adaptive). Ability to show or hide wicks. Creates and updates a custom Renko chart symbol. Automatically opens the chart window (optional). Maintains a limited bar history for performance. Inputs BrickSizePoints – brick size
FREE

Description: Protect your live or evaluation accounts by not letting it hit the maximum daily draw down! This utility is best for prop firms such as FTMO and MFF(MyForexFunds) and etc. Guide: Apply to EURUSD 1m Chart.
Default Settings: Maximum Draw Down Balance: 4% Account Balance. Maximum Draw Down Equity: 4% Account Balance Target Profit Balance: 1% Account Balance. Target Profit Equity: 1% Account Balance. Time To Reset: 16:57 to 16:58 GMT
Behavior: Setting starting_balance to 0 will auto
FREE

We often need to know the sudden change in trend that happens on the graph and this can be confirmed through indicators.
This indicator shows the moments of trend reversal and how in which trend the price is shifting.
Custom background, no need to configure the colors in the chart, just drag the indicator!
Indication with arrows.
- Blue arrow: Upward trend.
- Pink Arrow: Downward Trend.
NOTE: Free indicator, support may take a while to respond.
FREE

Highly configurable Moving average indicator.
Features: Highly customizable alert functions (at levels, crosses, direction changes via email, push, sound, popup) Multi timeframe ability Color customization (at levels, crosses, direction changes) Linear interpolation option Works on strategy tester in multi timeframe mode (at weekend without ticks also) Parameters:
MA Timeframe: You can set the lower/higher timeframes for Ma. MA Bar Shift: Y ou can set the offset of the line drawing. MA Period,
FREE
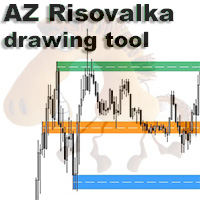
AZ Risovalka levels drawing tool An indicator for simplifying the drawing of levels. Select the indicator mode for the body, shadow, or the whole candle in the settings. Click the 'Draw' button on the drawing panel to create a level, then click on the body or shadow of the candle and select the level color in the color menu that appears. The 'Delete' button to delete level you select, 'Color' to select the color of an already created level. You can set your own colors in the indicator menu (6 co
FREE
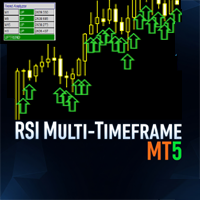
The MultiFrameRSIIndicator is a powerful MetaTrader 5 (MT5) indicator that leverages the Relative Strength Index (RSI) to analyze trends across multiple timeframes. This indicator synchronizes RSI-based trend signals from up to nine timeframes (M1, M5, M15, M30, H1, H4, D1, W1, MN1) and presents them with clear visual feedback, including a colored RSI line, signal arrows, and a customizable dashboard. Ideal for traders seeking momentum-based trend confirmation. Features Multi-Timeframe Analysis
FREE

Simple Vwap with the daily, weekly and monthly
VWAP is the abbreviation for volume-weighted average price , which is a technical analysis tool that shows the ratio of an asset's price to its total trade volume. It provides traders and investors with a measure of the average price at which a stock is traded over a given period of time.
How it's used Identify entry and exit points: Traders can use VWAP to determine when to buy or sell an asset. Understand price trends : Traders can use V
FREE
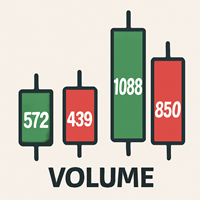
Volume Data on Candles Indicator for MetaTrader 5 Maximize your trading insights with the Volume Data on Candles indicator for MetaTrader 5. This powerful tool provides real-time volume data directly on each candle, allowing you to identify significant shifts in market activity. When the volume of a candle exceeds the average of the last 50 candles, it will be clearly highlighted , ensuring you don't miss out on potential high-volume movements. Key Features: Real-Time Volume Data : Displays volu
FREE

Мой самый популярный и востребованный продукт здесь https://www.mql5.com/ru/market/product/41605?source=Site+Market+Product+From+Author#
Индикатор стрелочник идеален для торговли в боковике, очень точно показывает моменты перекупленности и перепроданности инструмента, с дополнительными фильтрами также можно использовать для торговли по тренду. На экран выводятся стрелки сигнализирующие о развороте тренда, направление стрелки показывает дальнейшее направление торговли, также имеется звуковое о
FREE
Free Until 1st Jan 2026
VWAR 2.2 (Volume Weighted Average Roadmap) is an advanced institutional-grade MT5 indicator that brings you the most powerful multi-timeframe VWAP (Volume Weighted Average Price) analysis—plus filtered trade signals using robust trend and momentum confirmations. Key Features: Multi-Timeframe VWAP Lines:
Plots Daily, Weekly, and Monthly VWAP levels for instant market structure insight. Dynamic Buy/Sell Signals: Big, bold colored arrows indicate confirmed buy or sell opp
FREE
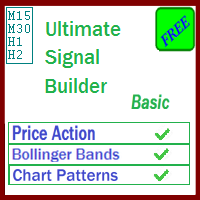
The Ultimate Signal Builder Basic combines the features of other 3 expert advisors, providing all their trading signals in one single place: 1. the Price Action Builder Basic ; 2. the Bollinger Bands Builder Basic ; 3. the Chart Patterns Builder Basic .
The Ultimate Signal Builder Basic expert advisor shares the same characteristics as the 3 underlying experts: usage of stop loss orders, maximum 1 managed open trade, automatic trade closure and configurable validation mechanism. While being ess
FREE
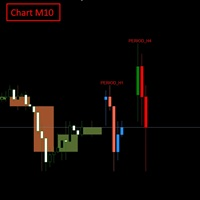
FULL PRODUCT DESCRIPTION Multi-Timeframe Candle Overlay Pro lets you view higher-timeframe candles directly on your current chart with absolute accuracy. When trading lower timeframes like M1–M15, understanding what the H1–H4 candles are forming is a major advantage: you avoid counter-trend entries, read market context faster, and trade with more confidence.
The indicator supports up to 2 higher timeframes, drawing full OHLC candles with precise positioning—no misalignment, no distortion. C
FREE

If you love this indicator, please leave a positive rating and comment, it will be a source of motivation to help me create more products <3 What is Schaff Trend Cycle indicator? The Schaff Trend Cycle (STC) is a technical analysis indicator used in trading and investing to identify trends and generate trading signals. The STC is designed to identify trends and trend reversals by measuring the strength of the trend and the speed of price changes. The STC indicator helps to identify trends in a
FREE

HEDGING ACCOUNTS ONLY!!! DO NOT USE DEFAULT SETTINGS!! Multifarious is a multiple strategy trading robot. With 9 indicators, 82 possible trading strategies your possibilities are endless. You can use the following indicators individually or use them together to. Bollinger Bands Moving averages Stochastics RSI Momentum indicator Fibonacci Levels MACD indicator ADX Indicator Fractals Indicator The EA also has a highly configurable money management section to ensure low risk trading. Extra Featu
FREE

FiboEvo FX: Hybrid Fibo & Adaptive Grid Strategy USE ON HEDGE ACCOUNTS ONLY Short Description "Graybox" Expert Advisor specialized in Forex . It combines technical Fibonacci entries, Flow Filters (VWAP/ADX), and an ATR Adaptive Grid system for position recovery. Overview FiboEvo FX was designed for dynamic Forex market conditions. It trades breakouts and Fibonacci retracements in favor of the trend. Its key differentiator is the Auto-Adaptive (ATR) system: instead of using fixed distances for th
FREE

THIS EA FOR GOLD ONLY . Before testing, download the settings that I uploaded in the comments This bot is designed to manage pending orders in the Forex market efficiently and safely. It automatically places and monitors buy and sell orders while maintaining multiple safety checks. The bot continuously monitors account status to ensure the protection of balance and margin, operating within defined trading hours to avoid unsuitable market conditions. Equipped with multiple risk management featur
FREE

HiLo Ladder 는 전통적인 HiLo 지표 를 현대적으로 재해석한 버전입니다. HiLo 지표는 오랜 시간 동안 트레이더들이 시장의 추세 방향과 잠재적인 반전 지점을 파악하는 데 널리 사용되어 왔습니다. 단기 트레이딩뿐만 아니라 장기적인 매매 전략에서도 중요한 참고 도구로 자리 잡고 있습니다. 기존 HiLo와 달리, HiLo Ladder 는 차트에 계단 모양의 형태로 표시됩니다. 흔히 **“계단선”**이라고 불리는 이 방식은 단순히 선을 연결하는 것이 아니라 각 추세 구간을 블록처럼 나누어 보여줍니다. 이로 인해 가격 움직임이 훨씬 더 선명하게 드러나며, 시각적인 이해가 쉽고 직관적입니다. 주요 장점: 녹색은 상승 구간, 빨강은 하락 구간을 의미하여 시장 흐름을 즉각적으로 파악할 수 있습니다. 계단형 표시로 인해 불필요한 노이즈가 줄어들어 분석이 더욱 명확해집니다. 직관적인 분석이 가능하며, 초보자도 쉽게 활용할 수 있습니다. 추세 전환 시점을 빠르게 감지할 수 있어 변동
FREE

Signal222 Apex Command – Ultimate Multi-Currency Dashboard & Auto-Trader Short Description A high-performance command center for MetaTrader 5 that scans 8 assets simultaneously, providing real-time risk/gain calculations, one-click manual execution, and optional fully automated trading. Description Signal222 Apex Command is more than just an indicator; it is a professional-grade trade management utility designed for traders who handle multiple currency pairs. In the fast-moving 2026 markets, spe
FREE
EuroSurge MT5 v3.42 (재출시 – 10부 마다 가격이 상승합니다. (4부 남음)) AI 유행어도 없고, 잘못된 백테스트도 없습니다 – 오직 투명성만 제공합니다. XAUUSD – 골드 전용: 실시간 시그널 커뮤니티 주도 실시간 시그널: Wise Millennial Trader ForexTrust FX (커뮤니티 시그널이므로, 설정에 대한 제어권은 저에게 없습니다. 결과는 달라질 수 있습니다.)
EuroSurge 시그널을 추가하고 싶다면 저에게 연락 주세요. 여기에서 참여하세요 – EuroSurge 커뮤니티 그룹 중요: 설치 가이드 – 설정 방법 EuroSurge 3.42 는 고급 자동화 트레이딩 시스템이며 제 실제 거래 포트폴리오의 핵심 구성 요소입니다. 이 EA는 IC Markets 에 최적화되어 있으며, 최고의 성능을 위해 해당 브로커를 추천합니다. 다른 브로커(특히 Prop Trading)를 사용 중이라면, IC Markets 계좌를 시그널 소스로 활용해 원하는
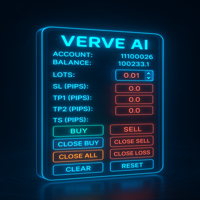
FXTrade Panel – 스마트하고 빠른 MT5 거래 관리자
FXTrade Panel은 원클릭 거래 실행 및 관리를 통해 거래 효율성을 높이도록 설계된 MetaTrader 5용 고급이면서도 사용하기 쉬운 거래 도구입니다.
주요 기능: • 계좌 개요: 계좌 번호, 레버리지, 잔고 및 현재 스프레드를 표시합니다. • 로트 크기 제어: 직관적인 +/− 버튼으로 로트 크기를 조절할 수 있습니다. • 리스크 관리: 핍 단위로 Stop Loss(SL), Take Profit(TP1, TP2) 및 Trailing Stop(TS)을 설정합니다. • 원클릭 거래: BUY 및 SELL 주문을 즉시 실행합니다.
포지션 관리: • Close Buy — 모든 활성 매수 포지션을 닫습니다. • Close Sell — 모든 활성 매도 포지션을 닫습니다. • Close All — 모든 포지션을 청산합니다. • Close Profit — 이익이 발생한 거래만 닫습니다. •
FREE

The expert "QuantumPip" is a fully automated expert which can trade several symbols from one chart. The expert also uses prices of Gold, Oil, "Schmuksie" (my adaptation of the "Dixie" indicator), DAX or FTSE to calculate inputs for the symbols. The expert uses 2 types of recurrent neural model - 1 network (decisions "buy" or "sell") and 2 networks (decisions "buy" or "uncertainty" and "sell" or "uncertainty"). QuantumPip can, therefore, trade 16 strategies as one, because it is 2 models per each

Adaptive Trend Master(ATM)– Kısa Kullanım Özeti
SET DOSYASI ICIN ILETISIME GECIN Adaptive Trend Master , özellikle BTC/USD ve XAU (Altın) gibi volatil piyasalarda kullanılmak üzere tasarlanmış, trend odaklı ve risk kontrollü bir otomatik işlem (Expert Advisor) sistemidir. Piyasa koşullarına göre kendini uyarlayabilen, çoklu indikatör onaylı bir algoritma ile çalışır. Ne yapar? Trend yönünü tespit eder Güçlü sinyal oluşmadan işleme girmez Her işlemde riski otomatik hesaplar Stop Loss ve Take
FREE
RSI Bollinger DualStrike Signals offers a clear and structured approach to identifying areas that may be favorable for potential trend reversals. By combining the RSI with Bollinger Bands, the indicator highlights moments when price shows signs of pressure or loss of momentum. The BUY/SELL signals help traders make more organized and disciplined decisions. It is a useful tool for scalping, day trading, or swing trading not to predict the market, but to improve the reading and understanding of pr
FREE
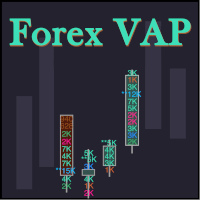
What do you see inside a candle? How to interpret the fight between bulls and bears? The candlestick chart brings a lot of information, but the volume is lacking in the candlestick body. This is where the Forex Volume At Price Expert Advisor comes in. This advisor searches for a set of recent trades, calculates the buy and sell attack volumes and prints on the candles, the volume value in each price range. You can also define up to ten colors to filter volumes and make it easier to
FREE

The provided code is an example of an Expert Advisor (EA) written in MQL5, a programming language used for creating algorithmic trading systems in MetaTrader 5. Here is a breakdown of the code:
The code begins with various input parameters and settings defined using the input keyword. These parameters allow customization of the EA's behavior, such as entry lots, stop loss, take profit, and indicator parameters.
Several constant values and variables are declared, including session time setting
FREE

The Investment Castle Chances indicator will show signals on the chart for entering a buy or sell trade. There are 2 types of signals for each direction as follows: Buy / Sell (Orange colored candlesticks) Strong Buy (Green colored candlesticks) / Strong Sell (Red colored candlesticks) You may place a buy trade once you see the Buy arrow or vise versa, or you might prefer to wait for a further confirmation “Strong Buy” / “Strong Sell”. This indicator works best with the high time frames H1,
FREE

Utazima 001 Indicator AI Professional Market Structure & Opening Range System STOP GUESSING. START TRADING WITH STRUCTURE. Utazima 001 Indicator AI is a next-generation Market Structure & Opening Range Intelligence System , built for traders who want clarity, precision, and consistency . This is not a repainting signal tool.
This is institutional-grade logic , simplified and automated for retail traders. Designed by Utazima MentorCreate , this indicator reveals the most important price zo
FREE

Previous Candle Levels MT5 shows the previous candle levels, it shows the previous candle Open High Low Close levels (OHLC Levels) in different time frame. It's designed to help the trader to analyse the market and pay attention to the previous candle levels in different time frame. We all know that the OHLC Levels in Monthly, Weekly and Daily are really strong and must of the time, the price strongly reacts at those levels. In the technical analysis, the user can use them as a support and res
FREE
This EA trades using the RSI Indicator. It offers many trading scenarios and flexible position management settings, plus many useful features like customizable trading sessions, a martingale and inverse martingale mode. [ Installation Guide | Update Guide | Troubleshooting | FAQ | All Products ] Easy to use and supervise It implements three different entry strategies Customizable break-even, SL, TP and trailing-stop Works for ECN/Non-ECN brokers Works for 2-3-4-5 digit symbols Trading can be NF
FREE

Session Box Indicator for MetaTrader 5
Description: The SessionBox indicator is designed to visually represent the trading sessions on a chart, specifically the Asian, European, and American sessions. This indicator draws customizable rectangles around each session, allowing traders to easily identify different trading periods. It also includes labels to denote each session, enhancing clarity.
Users only need to input the session start and end hours in their server time. Please note, the Asia
FREE

Volumized Breaker Blocks MTF Supreme Volumized Breaker Blocks MTF Supreme is a powerful and user-friendly multi-timeframe (MTF) indicator that automatically detects and visualizes Order Blocks (OB) and Breaker Blocks (BB) on your chart. This advanced tool is designed for both beginners and professional traders who want a clean, fast, and insightful way to identify key market levels with volume context. Key Features Multi-Timeframe Support : Instantly plot OB/BB zones from up to three customizab
FREE
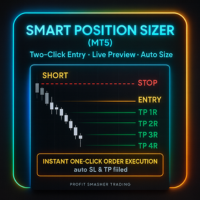
Smart Position Sizer (MT5) Two clicks to map risk, auto-size, and execute with SL/TP prefilled—fast, visual, broker-aware.
Built to work beautifully across Forex, Futures, Indices, Metals, and CFD symbols . Why traders love it (by market) Forex Spread-aware sizing (optional): include current spread in risk so your lot size targets net risk. Pip & 5-digit precision: correct pip math on majors/minors; handles mini/micro volume steps automatically. Side-price logic: uses bid/ask correctly for SL/T

The indicator is an analytical tool incorporating 37 different variations of moving averages developed by authors such as Patrick Mulloy, Mark Jurik, Chris Satchwell, Alan Hull, and others. It provides the capability for historical virtual testing. The indicator can be used on various instruments, including gold, cryptocurrencies, stock indices, currency pairs, and other assets. An integrated visual backtester allows users to simulate virtual trading positions, track results, and visually assess
FREE

시가 범위 EA 는 잘 알려진 시장 원리를 기반으로 합니다. 지수는 개장 직후 강한 모멘텀을 보이는 경우가 많으며, 이러한 초기 움직임은 이후 장세의 흐름을 좌우할 수 있습니다. 이 EA는 시가 범위를 파악하고 자동으로 돌파 주문을 내어 이러한 모멘텀을 포착합니다. 이후 장 마감 시까지 거래를 관리하여 당일의 방향성 변동을 최대한 활용합니다. 이 제품은 완전히 무료입니다. 초기 설정 파일은 댓글에서 확인하실 수 있습니다. 전략을 더욱 확장하거나 맞춤화하고 싶다면 유료 제품을 구매한 경우 DM을 통해 소스 코드를 요청할 수 있습니다. 다른 EA도 탐색할 수 있습니다. 거래 사양
지원 기기 : US30, USTEC 및 DE40에서 가장 잘 작동합니다. EA 설정: 기본 설정은 US30 및 USTEC에 최적화되어 있습니다. VPS: 중단 없는 성능을 위해 권장됩니다. 주요 특징 사용자 지정 기간: 원하는 시작 및 종료 시간을 선택하여 영업 범위를 정의합니다
FREE

The Dual MACD & Stochastic Expert Advisor (EA) is a fully automated trading system that utilizes two MACD (Moving Average Convergence Divergence) indicators along with the Stochastic Oscillator to identify high-probability trading opportunities. By combining trend confirmation from MACD with momentum analysis from Stochastic, this EA provides precise entry and exit points for optimized trading performance.
Key Features: • Dual MACD Strategy – Uses two MACD indicators with different setting
FREE
제품명: 퀀텀 그리드 매트릭스
간략한 설명:
동적 그리드 시스템을 사용하여 시장을 지능적으로 관리하는 정교한 전문가 자문(EA)입니다. 퀀텀 그리드 매트릭스는 계산된 주문 그리드를 구축하여 시장 변동을 헤쳐나가고, 자연스러운 가격 변동을 통해 수익을 확보하도록 설계되었습니다.
전체 설명: 지능형 그리드 트레이딩으로 시장의 리듬을 마스터하세요. 감정에 휘둘리지 않고 체계적으로 운영되는 전략적 도구를 찾고 계신가요? 퀀텀 그리드 매트릭스는 시장 변동성을 기회로 전환합니다. 전문적인 그리드 트레이딩 전략을 자동화하여 체계적인 포지션을 구축하고 시장의 자연스러운 흐름에서 수익을 확보하도록 설계되었습니다.
핵심 전략: 지능형 그리드 관리
퀀텀 그리드 매트릭스는 명확하고 계산된 원칙에 따라 운영됩니다.
초기 진입: EA는 그리드의 시작점을 설정합니다.
동적 그리드 생성: 가격 변동에 따라 EA는 미리 정의된 간격(그리드 거리)으로 일련의 미결제 주문을 자동으로 생성하여 구조화된
FREE

Mouse You can draw fibonaccis moving the mouse over the zigzag indicator Pin them You can click on fibonacci with this option and it will no longer be deleted unless you click on it again :) Precision The tuned fibonacci gets the precise point in lower timeframes Enjoy it You can ask me for add more features, so please comment and leave your ranting for me to be happy, thank you :)
FREE

Fibo Trend Smart MAXIMUS Ritz Fibo Trend Smart MAXIMUS 1 is an advanced trading indicator that integrates various technical analysis tools into one comprehensive display. This indicator is designed to help traders identify trading opportunities with high accuracy, utilizing a combination of Fibonacci, ZigZag, and price action confirmation. Key Features Smart Fibonacci Retracement 11 Customizable Fibonacci Levels (0%, 23.6%, 38.2%, 50%, 61.8%, 100%, 123.6%, 138.2%, 150%, 161.8%, 200%) Different
FREE

강력한 NRTR (Nick Rypock Trailing Reverse) 인디케이터를 소개합니다 - 트렌드 반전을 확인하고 효과적인 트레일링 스탑 레벨을 설정하고자 하는 트레이더에게 꼭 필요한 기술 도구입니다. Nick Rypock에 의해 개발된 이 인디케이터는 변화하는 시장 조건에 적응하는 독특한 알고리즘을 채용하여 모든 트레이더의 아이템에 빠지지 않는 가치 있는 기능을 제공합니다.
다음은 트레이더가 이 인디케이터를 사용하는 두 가지 인기있는 방법입니다:
1. 트렌드 반전: NRTR 인디케이터는 트렌드가 반전될 가능성이 있는 경우 명확한 신호를 생성합니다. 인디케이터 라인이 가격 차트를 가로지르면 트렌드 방향이 바뀔 수 있다는 가능성을 나타냅니다.
2. 트레일링 스탑: NRTR은 트렌드 시장에서 수익을 보호하기 위한 신뢰성 있는 트레일링 스탑 도구로도 사용됩니다. 가격이 원하는 방향으로 움직일 때 NRTR 라인이 동적으로 가격 아래 또는 위로 따라가면서 적응 가능한 스탑-로스
FREE

One Mint EMA Higher Trend Scalper is a fast and flexible MT5 trading bot designed for quick entries while following the stronger higher-timeframe trend. It uses a clean EMA crossover on the main chart and confirms direction with a higher-frame trend filter to avoid counter-trend trades and improve consistency. Key Inputs Lot Size Take Profit Stop Loss Trailing Stop Max Trade Limit Close Opposite Trade Option Core Features EMA-based entry strategy for simple and fast scalping Higher Time Frame Tr
FREE

Supply and demand in trading describes how buyer (demand) and seller (supply) actions set asset prices, with high demand/low supply raising prices (premium) and low demand/high supply lowering them (discount); traders identify these imbalances as "zones" on charts (e.g., Rally-Base-Rally for demand, Drop-Base-Drop for supply) to find potential entry/exit points, aiming to buy at discount demand zones and sell at premium supply zones, using volume and price action to confirm institutional acti
FREE

Volume at Price (VAP) VAP is a right-anchored Volume Profile Heatmap for MetaTrader 5 designed for clean, fast, and stable execution on any chart. It shows where trading activity clustered, not just when—so you can read balance/imbalance, spot value migration, and plan trades with precise references: VAH, VAL, and POC . What VAP shows Heatmap Profile (tick-volume):
A compact, right-anchored histogram that scales with the chart. Value Area (~70%) in Gold Non-Value in White Soft shadow gradient

Norion Smart Levels is a professional support and resistance indicator developed to help traders identify the most relevant price levels where the market historically reacts. The indicator analyzes price structure and market behavior to automatically plot key support and resistance levels, eliminating subjectivity and reducing chart noise. The result is a clean, objective, and easy-to-read visualization that adapts to different market conditions. Key Features: Automatic detection of support and
FREE

This auxiliary indicator displays time left before closing on the current timeframe with continuous update . It also shows the last trade price and variation from a previous day close in percentage and points. This indicator is pretty handy for daytraders and scalpers who want to precisely monitor closing and opening of candles.
Indicator parameters Show in shifted end - Default: False. Display time and values on screen. If True, Displays only time to close aside last candle. Distance from the
FREE
AutoGrid Assistant - 자동 그리드 주문 배치 도구 그리드 트레이딩 전략을 사용하는 트레이더를 위한 무료 도우미! 기능 설명: AutoGrid Assistant는 한 번의 실행으로 대기 주문 그리드(Buy Stop/Sell Stop 또는 Buy Limit/Sell Limit)를 자동으로 배치합니다. 수동 클릭이 필요 없습니다! 주요 기능: 원클릭 자동 그리드 배치 스톱 및 리밋 주문 지원 유연한 그리드 설정(초기 거리, 주문 간 간격) 각 주문에 대한 개별 테이크 프로핏 및 스톱 로스 방향 선택: 양방향, 매수만 또는 매도만 스마트 브로커 검증(최소 거리, 로트 크기, 마진 확인) 즉시 실행 최적 사용: 그리드 트레이딩 전략 헤징 전략 평균화 전략 빠른 수동 그리드 설정 설정: Number of orders per direction: 각 방향의 주문 수(1-100) Lot Size: 각 주문의 거래량 First order distance: 첫 번째 주문의 거리(포인트)
FREE

Simple Trade Utility Join the Group Chat - Community Group Need an indicator? Check out ZeroLag T3 Signal Suite The Simple Trade Utility is designed to make trading straightforward and efficient , without unnecessary complexity. This tool provides a clean, easy-to-use panel that simplifies the process of placing and managing trades. It focuses on essential functions traders use every day —nothing more, nothing less. Despite its simplicity, it offers powerful features such as: Trailing stop Part
FREE

The Trend Line Reverse Expert Advisor is a highly innovative and powerful tool that enables traders to effortlessly identify and trade trends in the financial markets. With this advanced tool, you can easily draw trend lines on your MT5 chart, and the EA will automatically buy or sell when the price reaches the trend line. This EA is user-friendly and requires minimal setup. You can simply attach it to your chart and start drawing up to three trend lines where you anticipate the price to reverse
FREE
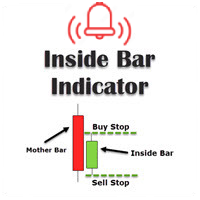
This inside bar indicator MT5 is suitable if you are doing inside bar trading. So what this MT5 inside bar indicator does is identifies inside bars for you as they form on your charts. Inside bar is a famous trading pattern in which the bar carry higher low and lower high compared with the previous bar, also known as mother bar. With, a lesser time frame like the 1 hour chart, daily inside bar chart will sometimes appears to be similar to a triangle pattern.
Inputs Settings for MA; AlertOn
FREE
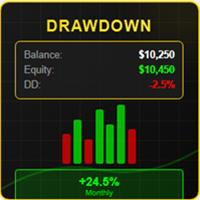
# DRAWDOWN INDICATOR V4.0 - The Essential Tool to Master Your Trading
## Transform Your Trading with a Complete Real-Time Performance Overview
In the demanding world of Forex and CFD trading, **knowing your real-time performance** isn't a luxury—it's an **absolute necessity**. The **Drawdown Indicator V4.0** is much more than a simple indicator: it's your **professional dashboard** that gives you a clear, precise, and instant view of your trading account status.
---
## Why This Indicator

MULTI INDICATOR SCANNER - PROFESSIONAL EDITION
PRODUCT DESCRIPTION
Multi Indicator Scanner is the most comprehensive technical analysis scanner on the market. It analyzes 10 different indicators simultaneously and provides you with clear BUY-SELL-NEUTRAL signals. No more checking dozens of indicators one by one!
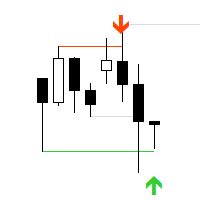
"AV Stop Hunter MT5" is an indicator for MetaTrader 5, which draws entry arrows for long and short after so-called Stop Hunt candles and has several notifications about them. Since this is a smart money concept , the periods H1 and H4 are the best. Increasing volume improves the signal, lines and arrows are then thicker. The MQL5 variant has colored stop-hunting candles. NEW: Signal Buffer: 1, 0 or -1
Definition :
Stop hunting, also known as stop running, is the practice of institutional trad

- What does this do?
This indicator draws the standard EMAs used in Steve Mauro's BTMM (Beat the Market Maker) method:
• The 5 EMA (Mustard)
• The 13 EMA (Ketchup)
• The 50 EMA (Water)
• The 200 EMA (Mayo)
• The 800 EMA (Blueberry)
- What improvement does this indicator offer?
The original version provided by Steve Mauro was for MetaTrader4. This is for MetaTrader5.
The original version provided by Steve Mauro misplaced the EMA-crossover arrows. This indicator handle
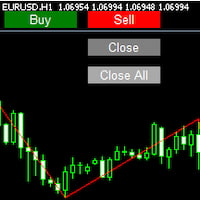
Imagine flying a real aircraft without ever stepping into a flight simulator. That's what trading is like. You have to simulate your strategy before you can take it to a live market. It is good if you can simulate things speedily before even stepping into any live market, or before coming up with an automated system. People don't have all day to stare at a higher timeframe chart until the entry signal finally arrives. That's why I built this so that you can simulate your strategy with speed. Th
FREE
FREE
MetaTrader 마켓은 MetaTrader 플랫폼용 애플리케이션을 구입할 수 있는 편리하고 안전한 환경을 제공합니다. Strategy Tester의 테스트를 위해 터미널에서 Expert Advisor 및 인디케이터의 무료 데모 버전을 다운로드하십시오.
MQL5.community 결제 시스템을 이용해 성능을 모니터링하고 원하는 제품에 대해 결제할 수 있도록 다양한 모드로 애플리케이션을 테스트할 수 있습니다.
트레이딩 기회를 놓치고 있어요:
- 무료 트레이딩 앱
- 복사용 8,000 이상의 시그널
- 금융 시장 개척을 위한 경제 뉴스
등록
로그인
계정이 없으시면, 가입하십시오
MQL5.com 웹사이트에 로그인을 하기 위해 쿠키를 허용하십시오.
브라우저에서 필요한 설정을 활성화하시지 않으면, 로그인할 수 없습니다.