Regardez les tutoriels vidéo de Market sur YouTube
Comment acheter un robot de trading ou un indicateur
Exécutez votre EA sur
hébergement virtuel
hébergement virtuel
Test un indicateur/robot de trading avant d'acheter
Vous voulez gagner de l'argent sur Market ?
Comment présenter un produit pour qu'il se vende bien
Expert Advisors et indicateurs pour MetaTrader 5 - 46
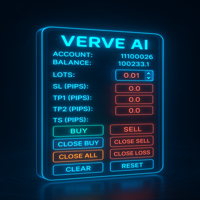
FXTrade Panel – Gestionnaire de Trade MT5 Intelligent et Rapide
FXTrade Panel est un outil de trading avancé mais facile à utiliser pour MetaTrader 5, conçu pour améliorer votre efficacité de trading grâce à l’exécution et à la gestion des ordres en un seul clic.
Fonctionnalités clés : • Aperçu du compte : affiche le numéro de compte, l’effet de levier, le solde et le spread actuel. • Contrôle de la taille des lots : taille de lot ajustable avec des boutons intuitifs +/−. • Gestion des ri
FREE

The Spots Indicator can be used for Entering and Exiting your trades based on the common candlestick patterns such as: engulfing, hanging man, doji etc. It is designed to publish desktop and mobile notification every time a signal is triggered. However, it is worth noting that this indicator is recommended to be used with other indicator for confirming the entries. It is best to use it with the Investment Castle Trend Lines indicator and the Supply and Demand indicator .
FREE

Hunt markets with Hunttern ZigZag . Easy to use with one parameter
You can use it for the following: -Classic patterns -Heads and shoulders -Harmonic patterns -Elliott Wave -Support and resistance -Supply and Demand
Single parameter: -Period (1-120)
Features: -Candle time -Single parameter -Light mode template
This is version 1 of Hunttern ZigZag. We are very happy to receive feedback from you.
FREE

Adaptive Hull MA Pro – Trend & Momentum Filter
We value your feedback and believe that your experience with the Hull Moving Average (HMA) is essential to us and other traders. Help us continue to improve and refine our product by sharing your thoughts and insights through a review!
The Hull Moving Average (HMA) Indicator – Your Key to Smoother Trends and Profitable Trades! Are you tired of lagging and choppy moving averages that hinder your ability to spot profitable trading opportunities? Loo
FREE

With this easy to set up indicator you can display and set alerts for the following candlestick formations: Bull Breakout, Bear Breakout, Hammer, Pin, Bullish Engulfing, Bearish Engulfing. Input parameters: ShortArrowColor: The color of the Arrows, displaying a Bearish candle formation LongArrowColor: The color of the Arrows displaying a Bullish candle formation BullishEngulfing: Disabled/Enabled/EnabledwithAlert BearishEngulfing: Disabled/Enabled/EnabledwithAlert Pin: Disabled/Enabled/Enabledw
FREE

"Pattern 123" is an indicator-a trading system built on a popular pattern, pattern 123.
This is the moment when we expect a reversal on the older trend and enter the continuation of the small trend, its 3rd impulse.
The indicator displays signals and markings on an open chart. You can enable/disable graphical constructions in the settings.
The indicator has a built-in notification system (email, mobile terminal, standard terminal alert).
"Pattern 123" has a table that displays signals from se

Trade with clarity, not noise.
Tired of false signals? Focus on stable, rule-based entries
Key Features: High-performance signals, confirmed at bar close Works across all symbols & timeframes Suitable for trend-following, pullbacks, or swing setups No repainting, recalculation, or backpainting
Try the DEMO version: • Works on EURUSD M15, M30 (demo, no suffix/prefix brokers) • Test it FREE and see consistent results
Full Version: TREND REVERTING PRO full version here (Upda
FREE

SMART RECOVERY EA – FREE Edition (MT5) SMART RECOVERY EA is a FREE Expert Advisor for MetaTrader 5 , developed by Automation FX , created for educational and testing purposes .
This EA helps traders understand recovery-based trading logic with both manual control and basic automated support . Key Features (FREE Version) Manual Buy / Sell / Close All buttons Clean information panel with live trade data Basic recovery and trade monitoring logic Simple stochastic-based auto mode Suitable for lea
FREE

Améliorez vos capacités de détection de tendances avec l'indicateur Consecutive Candle Indicator MT5, un outil dynamique conçu pour identifier les séquences de bougies haussières ou baissières, offrant des alertes opportunes pour confirmer les tendances et les éventuelles inversions sur les marchés forex, actions, cryptomonnaies et matières premières. Célébré dans les communautés de trading comme Forex Factory et Reddit’s r/Forex, ainsi que salué dans les discussions sur Investopedia et TradingV
FREE

The key to success is always good optimisation.
The system has a number of variables and in this case its simplicity is the key to its success. The system looks for the different "Gaps" as market entry failures and then debugs them through a stochastic analysis, i.e. the analysis of two moving averages to see if the price is overvalued or undervalued, and once this is done, the expert advisor will decide whether to perform an action or refrain from performing it. It is a very simple but powerf
FREE

GridMA Scalper EA is a semi-aggressive grid-based trading robot that combines Moving Average (MA) crossover logic with time-filtered grid entries. It is designed to capture both trending and pullback opportunities with built-in risk control mechanisms. Strategy Overview: Uses MA crossover (SMA 21) as signal Automatically opens grid entries when price moves against initial entry Supports both BUY and SELL directions Grid lot size increases using a multiplier Built-in trailing stop, breakeve
FREE

Indicador com regra de coloração para estratégias que utilizam Inside Bar! Quando rompe a barra inside, se for para cima, compra e posiciona o stop loss na mínima da barra inside. Se romper para baixo, vende e posiciona o stop loss na máxima da barra inside. Pode ser aliada a tendências de outros tempos gráficos e outros filtros.
Grupo de sinais gratuito no telegram: https://t.me/InsideBarRST
FREE

Build your EA with Build EA Simple, with it you can build your strategy with the available indicators and tools.
Build EA Simple does not have any defined strategy, but with it you can use combinations of indicators and use them as signals or filters and build your strategy!
Build EA Simple is a simplified version of Build EA that doesn't have as many tools. Discover Build EA Pro https://www.mql5.com/pt/market/product/88859?source=Unknown%3Ahttps%3A%2F%2Fwww.mql5.com%2Fpt%2Fmarket%2Fmy
Indi
FREE

This indicator was developed to support multiple timeframe analysis. In the indicator settings, the user can set the color, width, and style of the horizontal lines for each timeframe. This way, when the horizontal lines are inserted into the chart, they will be plotted with the timeframe settings.
MTF Lines also allows visibility control of another objets like rectangles, trend lines and texts.
This is a product developed by Renato Fiche Junior and available to all MetaTrader 4 and 5 users!
FREE

The "Close All Order Tools" tool is designed to solve common problems faced by Forex traders when managing profitable orders—especially in highly volatile market conditions or when dealing with multiple open trades simultaneously. Problems This Tool Solves: Unable to close orders in time : “Just when it was rising nicely, the price suddenly dropped—I couldn’t close it in time, and the profit vanished.” Closing orders one-by-one is time-consuming : “With multiple orders open, closing each one ind
FREE

Eagle Spikes Detector v1.50 - Professional Trading Signal System Ultimate Precision Trading with Advanced SuperTrend Filtering Technology join my telegram channel to trade with me: https://t.me/ +9HHY4pBOlBBlMzc8
The Eagle Spikes Detector is a sophisticated, professional-grade trading indicator designed for serious traders who demand precision, reliability, and visual excellence. Combining advanced multi-timeframe analysis with cutting-edge SuperTrend filtering, this indicator identifi
FREE
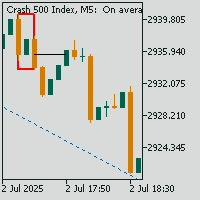
Crash Spike Mitigation Zone Pro
A professional spike pattern indicator built for synthetic traders who scalp and swing Crash 500/300/1000 with precision.
This indicator: Detects powerful 3-candle spike formations (Spike → Pullback → Spike) Automatically draws a clean box around the pattern Marks the entry price from the middle candle Extends a horizontal mitigation line to guide perfect sniper entries Automatically deletes & redraws the line once price touches it (mitigation)
FREE

- Displays horizontal lines for Previous Day High (PDH) and Previous Day Low (PDL) on the chart. - Customizable line colors via input parameters. - Sends sound alerts, pop-up notifications, and mobile push notifications upon the initial crossover of PDH or PDL. - Alerts are triggered only once per crossover event; they re-trigger only if the price moves away and re-crosses after a specified minimum interval. - Automatically updates the PDH/PDL levels at the start of each new day. - All indicator
FREE

Correlation Matrix Pro - Analyse Multi-Devises Comprenez les relations entre les paires de devises en temps réel ! Un puissant outil d'analyse qui vous aide à visualiser les relations statistiques entre jusqu'à 6 paires de devises simultanément. Parfait pour la gestion de portefeuille, la diversification des risques et les stratégies de couverture. FONCTIONNALITÉS PRINCIPALES - Corrélation de Pearson en temps réel avec rendements logarithmiques - Surveillance de jusqu'à 6 paires de devises simu
FREE

Bouton « Fermer toutes les transactions » (MT5)
Utilitaire de fermeture de position en un clic pour MetaTrader 5. Affiche un bouton rouge sur votre graphique qui ferme toutes les positions ouvertes lorsque vous cliquez dessus, avec gestion automatique des rejets et des recotations.
Objectif
La fermeture individuelle de plusieurs positions dans des conditions volatiles ou en cas de problèmes avec la plateforme fait perdre du temps et augmente le risque de slippage. Le bouton « Fermer tou
FREE

Envelopes RSI Zone Scalper MT5 EA Unleash your trading edge with the Envelopes RSI Zone Scalper MT5 EA , an Expert Advisor for MetaTrader 5, engineered to thrive in any market—forex, commodities, stocks, or indices. This dynamic EA combines the precision of Envelopes and RSI indicators with a zone-based scalping strategy, offering traders a versatile tool to capitalize on price movements across diverse instruments. Whether you’re scalping quick profits or navigating trending markets, this EA del
FREE
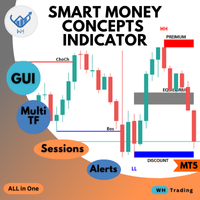
Welcome to the ultimate Smart Money Concepts indicator ,, this indicator is All-in-One package the only thing you need to empower
all the Smart Money Concepts in one place with interactive advanced gui panel with all the features and customization you need. MT4 Version : WH SMC Indicator MT4 *This Price For Limited Number of Copies.
Features: Main Section: User-Friendly Panel (GUI): Designed for traders of all experience levels, the indicator integrates seamlessly into your MT5 platform
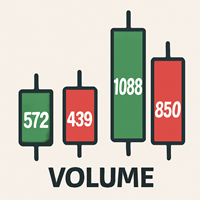
Volume Data on Candles Indicator for MetaTrader 5 Maximize your trading insights with the Volume Data on Candles indicator for MetaTrader 5. This powerful tool provides real-time volume data directly on each candle, allowing you to identify significant shifts in market activity. When the volume of a candle exceeds the average of the last 50 candles, it will be clearly highlighted , ensuring you don't miss out on potential high-volume movements. Key Features: Real-Time Volume Data : Displays volu
FREE
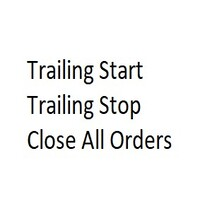
Cet utilitaire EA clôture tout ordre d'achat ou de vente lorsqu'il atteint la valeur de profit souhaitée ou lorsque le stop gain est activé. Ferme les commandes ouvertes manuellement ou par d'autres robots. Très efficace pour protéger ou garantir des gains lors de mouvements rapides de prix. Il fonctionne sur n'importe quelle période et n'importe quel actif disponible sur MT5.
Trailing Start : Exemple, si le prix évolue de 70 pips en faveur, il active le stop gain. Traling Stop : ou Traling
FREE

Adaptive Moving Average (AMA) is a trend indicator using moving average and market noise filter. Indicator feature are blue and red points, showing the power of trend. Recommendations for trading: Auxiliary Indicator Detecting trend Detecting power of trend Detecting potential reversal points Main indicator Shows entry points for swing trading Serves as dynamic support and resistance Recommendations for use: Any instrument Any timeframe Input parameters: Period - AMA period Fast Period - fast MA
FREE
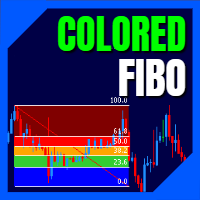
LT Colored Fibo is a simple indicator that paints the price zones between Fibonacci Retracement levels. Its configuration is extremely simple. It is possible to change the colors of each level of the retracement, choose between background or front of the chart and also work only with the current asset or all open. If you found a bug or have any suggestion for improvement, please contact me. Enjoy!
This is a free indicator, but it took hours to develop. If you want to pay me a coffee, I apprecia
FREE

Velas Multi Time Frame
Las velas multi time frame, también conocidas como "MTF candles" en inglés, son un indicador técnico que permite visualizar velas japonesas de un marco temporal diferente al marco temporal principal en el que estás operando. Este enfoque ofrece una perspectiva más amplia del comportamiento del precio, lo que resulta especialmente útil para los traders que emplean estrategias de acción del precio. A continuación, se detallan los conceptos clave relacionados con este indic
FREE

AP Fibonacci Retracement PRO (MT5) Overview AP Fibonacci Retracement PRO is a trend-continuation pullback EA. It waits for a confirmed swing, calculates the Fibonacci retracement zone, and looks for entries in the direction of the original move.
No grid, no martingale. Strategy logic Detects the last valid swing high/low using Fractals on the selected signal timeframe. Calculates the retracement zone between 38.2% and 61.8% (configurable). On a closed bar, if price is inside the zone (with opti
FREE

Index Stalker EA (v1.x Series) Prop Firm Ready
Stay on the Rules
1% Risk Margin.
3% Daily Drawdown.
$10000 account.
Please Don't Hesitate to Contact me for any info you need. 1. High-Impact Product Description In the volatile currents of the NASDAQ 100, the greatest opportunities are found not through brute force, but through precision and patience. Introducing Index Stalker EA , the sophisticated trading tool engineered to silently track and execute high-probability setups with surgical accu
FREE

Pip Value Calculator - Instant Risk Assessment on Your Chart This powerful and lightweight utility instantly calculates the precise monetary value for any pip movement, displaying it directly on your chart so you can assess risk and potential profit at a glance. At its core, the indicator's sophisticated calculation engine runs silently with every price tick, ensuring the information you see is always up-to-date. It automatically detects the instrument you are trading—whether it's a Forex pair,
FREE

EA de tendance entièrement automatisée avec stratégie active et système de moyenne avancé. Les ordres sont ouverts selon un filtre de tendance utilisant des oscillateurs pour une plus grande sécurité du signal. A une configuration simple et claire. L'EA est adapté pour une utilisation sur tous les instruments et délais Avantages : Système automatisé avec la possibilité d'ajouter des commandes manuelles Algorithme de récupération de chevauchement réglable Possibilité de commercer dans une ou les

Le Nadaraya-Watson Envelope est un indicateur basé sur une régression non paramétrique qui aide les traders à identifier les tendances, les niveaux de support et de résistance à l’aide de bandes lissées et adaptatives. Contrairement aux moyennes mobiles traditionnelles ou aux enveloppes basées sur l’écart-type, cet indicateur utilise la régression à noyau de Nadaraya-Watson , qui s’adapte dynamiquement aux mouvements des prix, réduisant le décalage tout en restant réactif.
Caractéristiqu
FREE

ICT Silver Bullet
If you are searching for a reliable indicator to trade the ICT Silver Bullet concept, or ICT concepts, Smart Money Concepts, or SMC, this indicator will respond to your need! Before version 2.2, this indicator was focused only on ICT Silver Bullet, but moving forward, we will include the different elements for smart money concept trading. This indicator will help you identify the following: FVG - fair value gaps Market structure: BOS and CHOCH. It is based on swing high and l
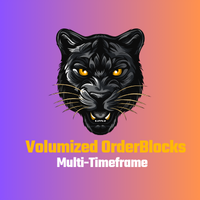
Volumized OrderBlocks MTF - Multi-Timeframe Volumetric Order Block Indicator
OVERVIEW
Volumized OrderBlocks MTF is an advanced Multi-Timeframe Order Block indicator that automatically detects, displays, and merges Order Blocks from up to 3 different timeframes on a single chart. Built with institutional Smart Money Concepts (SMC) method
FREE
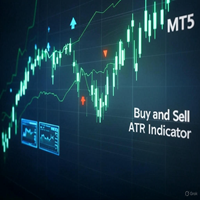
Buy and Sell ATR Indicator The Buy and Sell ATR Indicator is a powerful trend-following tool for MT5, combining ATR-based trend detection with RSI confirmation. It plots a dynamic trend line and generates clear buy (blue arrows) and sell (red arrows) signals when price action confirms a trend over a user-defined number of candles. A unique flat market filter, based on average ATR, prevents signals in low-volatility conditions. Customize ATR periods, RSI levels, signal thresholds, and arrow styl
FREE

The indicator shows the time until the candle closes, as well as the server time on the current chart.
Very easy to use, with only four settings.:
Lable Location-the location of the timer on the graph;
Display server time-to show the server time or not;
Sound alert when the candle is closed-to use a sound signal when closing the candle or not;
Color-the color of the timer digits.
Other useful free and paid products can be viewed here: https://www.mql5.com/ru/users/raprofit/seller
FREE

El AO Hybrid MA Master es un sistema de análisis de momentum avanzado para MQL5 que integra el Awesome Oscillator (AO) de Bill Williams con un modelo de confirmación basado en medias móviles duales . 1. Núcleo del Indicador (Core) Utiliza el algoritmo estándar del AO para medir la fuerza del mercado mediante la diferencia entre una SMA de 5 periodos y una SMA de 34 periodos del precio medio ( $High+Low/2$ ). El histograma está codificado cromáticamente para identificar la aceleración o desaceler
FREE

YOU CAN NOW DOWNLOAD FREE VERSIONS OF OUR PAID INDICATORS . IT'S OUR WAY OF GIVING BACK TO THE COMMUNITY ! >>> GO HERE TO DOWNLOAD
The Volatility Ratio was developed by Jack D. Schwager to identify trading range and signal potential breakouts. The volatility ratio is defined as the current day's true range divided by the true range over a certain number of days N (i.e. N periods). The following formula is used to calculate the volatility ratio: Volatility Ratio (VR) = Today's True Range
FREE

Highly configurable Moving average indicator.
Features: Highly customizable alert functions (at levels, crosses, direction changes via email, push, sound, popup) Multi timeframe ability Color customization (at levels, crosses, direction changes) Linear interpolation option Works on strategy tester in multi timeframe mode (at weekend without ticks also) Parameters:
MA Timeframe: You can set the lower/higher timeframes for Ma. MA Bar Shift: Y ou can set the offset of the line drawing. MA Period,
FREE

DawnDuskDynamics EA DawnDuskDynamics is a sophisticated trading algorithm that leverages the well-known Morning Star and Evening Star candlestick patterns to identify potential market reversals. This Expert Advisor is designed for traders looking to automate their trading strategies on major currency pairs, ensuring a systematic approach to forex trading. Key Features: Trading Strategy : Utilizes the Morning Star and Evening Star patterns to determine entry points, enhancing the probability of
FREE

Lot Size Calculator - Smart Risk Management Tool
The Lot Size Calculator is a simple but powerful MetaTrader indicator that helps traders manage risk with precision. Instead of guessing your position size, this tool instantly calculates the exact lot size you need based on your account equity, chosen risk percentage, and reward ratio (1:1, 1:2, etc.).
Features:
Input your account equity and risk % per trade Supports both long (buy) and short (sell) trades Automatically adjusts for diffe
FREE

BigBull EA (BigB) — XAUUSD Trend-Following Expert Advisor for MetaTrader 5 BigBull EA is a precision-engineered trend-following system built for traders who demand high-confidence entries, disciplined risk control, and adaptive market behavior. Designed primarily for XAUUSD/Gold , BigB dynamically adjusts to different market environments and can be deployed across Forex and other instruments with its flexible system profile. What BigBull EA Does BigBull EA identifies emerging trends, validates
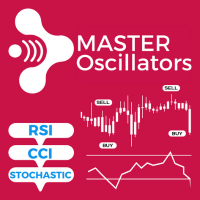
Découvrez Master Oscillators, un bot qui rend le trading simple et flexible ! Choisissez parmi les signaux RSI, CCI ou Stochastic et construisez votre propre stratégie. Ce bot vous offre de nombreux outils, comme le filtre MA, des tailles de lots dynamiques, une calculatrice du critère de Kelly, des niveaux SL et TP dynamiques, et bien plus encore. Quel que soit votre style de trading, Master Oscillators est là pour vous. Il vous fournit des informations importantes, des statistiques, et plus en

Several assets in several markets have the behavior of using specific numbers as Force Numbers, where support, resistance and price thrust is created. Let this indicator draw those levels of support and resistance for you. You can also stack it to show different level of Prices! This technique is being used by Tape Readers and Order Flow traders all over the world for a long time. Give it a try. Challenge yourself to study new ways of Price Action!
SETTINGS
What Price reference to use in the c
FREE
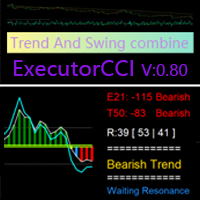
Based on the CCI Trend-Following Principle, Improved to Identify Trend Reversals
This indicator is designed to confirm trends after identifying them using the ( Executor Trend Indicator ) indicator, making it a tool for both trend confirmation and reversal detection. Features Green and Red Histogram: Represents the development of bullish (green) or bearish (red) trends in the current timeframe. Blue Line and Green Histogram (Bullish Confirmation): When the blue line rises above +10
FREE

GridMaster ULTRA v6.2 - Intelligence Artificielle Adaptative L'EA de Grille le Plus Avancé du Marché MT5 GridMaster ULTRA révolutionne le trading de grille avec une Intelligence Artificielle adaptative qui s'ajuste automatiquement aux conditions de marché en temps réel. DESCRIPTION COURTE Expert Advisor de grille intelligent avec IA adaptative, analyse multi-dimensionnelle du marché, gestion de risque dynamique et optimisation automatique des paramètres. Système de protection avancé et
FREE

Harmonic Pattern Suite Pro Introduction Harmonic Pattern Suite Pro is an indicator designed to identify and display harmonic structures on the chart based on X-A-B-C-D sequences. Its purpose is to present pattern formations that meet geometric and proportional criteria, providing a clear visual representation directly on the chart. The indicator automates the detection process, removing the need for manual measurement of ratios and allowing the user to review the structural configuration withou
FREE

Based on the Extreme Trend Indicator on Trading View converted for MT5. Usage of the Indicator is free, but if you want the source code, you can purchase the source code by messaging me.
Extreme Trend is an indicator that identifies when a new trend is forming and creates a trading signal. This indicator can be used for many markets, forex, gold etc. If you have any inquiries or want to create an EA using this indicator, you can message me.
FREE
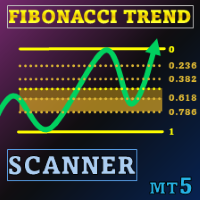
Offre spéciale : ALL TOOLS , seulement 35 $ chacun ! New tools will be $30 for the first week or the first 3 purchases ! Trading Tools Channel on MQL5 : Join my MQL5 channel to update the latest news from me Dans un environnement de trading volatile, un outil d’analyse puissant et intuitif peut vous aider à saisir rapidement les opportunités. Fibonacci Trend Scanner intègre non seulement les fonctionnalités traditionnelles de l’indicateur Fibonacci et SuperTrend, mais étend égaleme
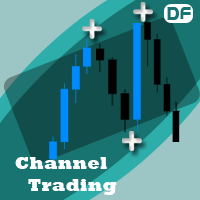
This Expert Advisor follows your channel lines that you draw. and when the price reaches these support and resistance trend lines, EA send open or close order automatically. You must draw two trend line with same color for EA to work, not equidistant channel line. and this color must be specified in ChannelColor parameter Strategies:
Inside Channel Strategy: If the price reaches bottom trend line, the EA will place a buy order. and when the price reaches the top trend point, EA send close order
FREE

L'indicateur Accurate Gold est un outil convivial, à la fois intuitif et simple à utiliser, quel que soit le niveau d'expérience des traders. Il est conçu pour les traders à la recherche de signaux précis sur le laps de temps M5 sur le marché de l'or. Cet indicateur utilise des algorithmes mathématiques avancés pour analyser les mouvements de prix et la dynamique du volume, générant ainsi des signaux d'achat et de vente précis. Les caractéristiques distinctives de cet indicateur, notamment s

Adiciona marca d'água com nome do ativo em negociação. Pode ser ajustado definindo tamanho da fonte e coloração do texto. Testado com vários ativos do mercado B3 e Forex Adione ao gráfico e configure de acordo com a necessidade. Caso tenha problemas sinta-se a-vontade para nos avisar e providenciaremos a correção logo que possível. ______________________________
FREE

If you love this indicator, please leave a positive rating and comment, it will be a source of motivation to help me create more products <3 How to use QQE? Determine trend when RSI MA above 50 indicate a bullish market, while RSI MA below 50 indicate a bearish market and can server as a trend filter. Identify short-term up/down momentum, when the RSI MA crosses up Smoothed signals bullish momentum, and when the RSI MA crosses down Smoothed signals bearish momentum. It is also possible to
FREE
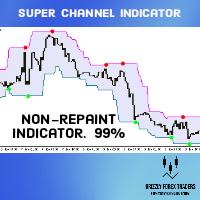
Super Signals Channel Indicator Its channel is a non-repaint indicator that reacts more with recent price movements. For this reason, the Super Signals Channel Indicator is a better match for short-term or day trading strategy. The Super Signals Channel only plots swing trading opportunities. So most of its trade signals appear during consolidation or sidelined periods of the market. Super Signals Channel Indicator for MT5 Explanation The green band below the price shows the dynamic support lev
Trade donchian breakouts with complete freedom. This EA can trade any breakout period, any timeframe, with pending or market orders- as desired- and implements many other useful features for the exigent trader, like customizable trading sessions and week days, a martingale mode and inverse martingale mode. [ Installation Guide | Update Guide | Troubleshooting | FAQ | All Products ] Easy to use and supervise Customizable trading direction Customizable donchian breakout period It can trade using
FREE

Linear Regression Channel (MTF) Indicator The Linear Regression Channel MTF is an advanced technical indicator that uses statistical analysis to plot a linear regression channel on the price chart, with the capability to display data from a different time frame (Multi Time Frame) for enhanced trend accuracy and analysis. Key Features of the Indicator: Main Line (Linear Regression Line):
Represents the overall price trend over the selected period, allowing traders to easily observe the general s
FREE
Daily Range Breakout Optimizer Daily Range Breakout Optimizer is an expert advisor implementing a breakout strategy based on the previous day’s range, with filtering by market structure and trend. Suitable for testing and trading on various symbols, it calculates the daily range, applies filters, and places Buy Stop and Sell Stop pending orders, with position management via breakeven and time limits. How It Works At the start of a new day, the advisor analyzes the previous day’s range (high, low
FREE
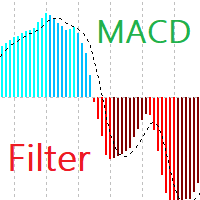
MACD Filter Introducing MACD Filter – a fresh take on the beloved MACD (Moving Average Convergence Divergence) indicator, developed specifically for the MetaTrader 5 platform. By applying the Fisher Transform for filtering and refining data, MACD Filter creates smoother lines, eliminating noise and providing clearer signals. Fisher Transform Filtering: Normalizes and smooths MACD data. This leads to smooth, less chaotic lines compared to traditional MACD, reducing false signals and simplifying
FREE

Take Control of Risk with Smart Trailing Stop Manager for MetaTrader 5 Looking for MetaTrader 4 version? I t is available separately in the Market: Smart Trailing Stop Manager MT4 Full User Guide – Public channel: CLICK HERE Tired of missed profits or manual stop loss adjustments?
Smart Trailing Stop Manager is a powerful utility for MetaTrader 5 designed to automate your trailing stop, breakeven, partial close, and SL management. Whether you're a discretionary trader, signal follower, o

Советник основанный на сигналах индикатора Relative Strength Index (RSI) и Stochastic в зоне перекупленности - продаем, в перепроданности - покупаем. Я рекомендую использовать этот советник только на VPS. Добавляйтесь в друзья, присылайте свои интересные стратегии. Возможно после обсуждения всех нюансов напишу советника бесплатно . Параметры: "_Slippage" - Проскальзывание; "_ Magic" - Идентификатор ордера;
FREE
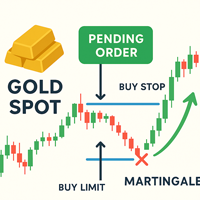
Gold Matrix Pending Pro Gold Matrix Pending Pro is an automated Expert Advisor developed for trading XAUUSD (Gold). It utilizes a pending-order execution model to align with market movements without manual intervention. The system operates strictly according to predefined technical rules. Strategy Overview The Expert Advisor manages entries by placing Buy Stop or Buy Limit pending orders based on current market structure and user-defined distance parameters. Entry Logic: Orders are placed at co
FREE

Shadow Bands Pro – MT5 说明(中英文) English Description (MT5) Shadow Bands Pro – Advanced Reversion System for MT5 This MT5 edition of Shadow Bands Pro takes full advantage of the MT5 platform, offering faster calculations, more timeframes, and better testing capabilities.
It remains a non-repainting (on close) trend-reversal / mean-reversion tool with dynamic channels, entity-break logic, and an integrated statistics panel. Key Features Optimized for MT5’s 64-bit, multi-threaded architecture Non-
FREE

EA peut clôturer des positions non rentables en recherchant et en fermant des positions rentables .
Cet assistant recherche , parmi tous les postes, le poste le moins rentable du terminal. De plus, en recherchant les positions rentables restantes, il calcule une série de positions pouvant couvrir la perte lorsque le profit d'une ou plusieurs positions est supérieur à la perte d'une autre position. Si un ensemble de telles positions est trouvé, le conseiller les ferme. Une série de
FREE
The Ultimate Dashboard New Year Sale - save $20 (normal price $79) Indicators are useful for traders, but when you put them into a dashboard that can scan 28 symbols at once they become even better, and when you can also combine different indicators and timeframes to give you synchronized alerts, then they become awesome. This easy to use dashboard provides you with 32 leading indicators, use them individually or together, to create powerful combination alerts. So when you want to know that RS

This is an indicator of trading sessions that can display all levels (Open-High-Low-Close) for four sessions . The indicator can also predict session levels. Sessions can be drawn with lines or rectangles (empty or filled), lines can be extended to the next session. You can easily hide/show each session by pressing hotkeys (by default '1', '2', '3', '4') You can see ASR (Average Session Range) lines (default hotkey 'A'). This is similar to the ADR calculation, only it is calculated based on t

HEDGING ACCOUNTS ONLY!!! DO NOT USE DEFAULT SETTINGS!! Multifarious is a multiple strategy trading robot. With 9 indicators, 82 possible trading strategies your possibilities are endless. You can use the following indicators individually or use them together to. Bollinger Bands Moving averages Stochastics RSI Momentum indicator Fibonacci Levels MACD indicator ADX Indicator Fractals Indicator The EA also has a highly configurable money management section to ensure low risk trading. Extra Featu
FREE

Major Swing Fibonacci Indicator - Professional Trading Tool What It Does Automatically detects major swing points not internal noise Generates buy/sell signals at key Fibonacci levels Displays professional GUI panel with real-time analysis Marks major swings with visual indicators Trading Strategy BUY at 38.2%-61.8% Fibonacci support in uptrends SELL Past performance is not indicative of future results. This indicator is for educational and informational purposes only and does not constitute in
FREE

This indicator, the BB Donchian Hybrid (Volatility Breakout Analyzer), is a dual-layered technical analysis tool designed to identify high-probability trend entries by combining statistical volatility with price-action extremes.
By merging the "elasticity" of Bollinger Bands with the "structural" boundaries of Donchian Channels, it filters out the market noise that often leads to false breakouts.
Core Mechanics The indicator operates on two primary mathematical pillars:
The Bollinger Band "S
FREE
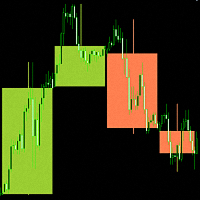
"Candlesticks MTF 5" is an informational indicator that displays "Japanese Candlesticks" . The indicator analyzes and determines the opening and closing times of candles from higher time frames.
An algorithm has been developed for the "Candlesticks MTF 5" indicator that corrects the discrepancy between the opening and closing times of candles from higher time frames. For example, if the opening time of a candle on a weekly time frame is the 1st of the month, and on the smaller time frame this
FREE
This indicator provides a clear, at-a-glance dashboard for monitoring both the Relative Strength Index (RSI) and Stochastic Oscillator on any instrument or timeframe.
Whenever both RSI and Stochastic %K simultaneously exceed their respective overbought or oversold levels, the indicator displays an arrow signal in the indicator window.
These signals highlight strong momentum and can help traders quickly identify high-probability reversal zones. As with all my free tools, the arrow symbol can be e
FREE
Le MetaTrader Market est un site simple et pratique où les développeurs peuvent vendre leurs applications de trading.
Nous vous aiderons à publier votre produit et vous expliquerons comment préparer la description de votre produit pour le marché. Toutes les applications de Market sont protégées par un cryptage et ne peuvent être exécutées que sur l'ordinateur de l'acheteur. La copie illégale est impossible.
Vous manquez des opportunités de trading :
- Applications de trading gratuites
- Plus de 8 000 signaux à copier
- Actualités économiques pour explorer les marchés financiers
Inscription
Se connecter
Si vous n'avez pas de compte, veuillez vous inscrire
Autorisez l'utilisation de cookies pour vous connecter au site Web MQL5.com.
Veuillez activer les paramètres nécessaires dans votre navigateur, sinon vous ne pourrez pas vous connecter.